---
id: mariadb-opentelemetry
title: MariaDB - OpenTelemetry Collector
sidebar_label: MariaDB - OTel Collector
description: Learn about the Sumo Logic OpenTelemetry app for MongoDB.
slug: /help/docs/integrations/databases/opentelemetry/mariadb-opentelemetry/
canonical: https://www.sumologic.com/help/docs/integrations/databases/opentelemetry/mariadb-opentelemetry/
---
import useBaseUrl from '@docusaurus/useBaseUrl';
import Tabs from '@theme/Tabs';
import TabItem from '@theme/TabItem';
})
}) The [MariaDB](https://mariadb.org/about/) app is a logs based app that helps you monitor MariaDB database. Pre-configured dashboards provide insight into the health of your database clusters, replication, error logs, slow queries and failed logins.
This app is tested with the following MariaDB versions:
- Non-Kubernetes: MariaDB - Version 10.7.1
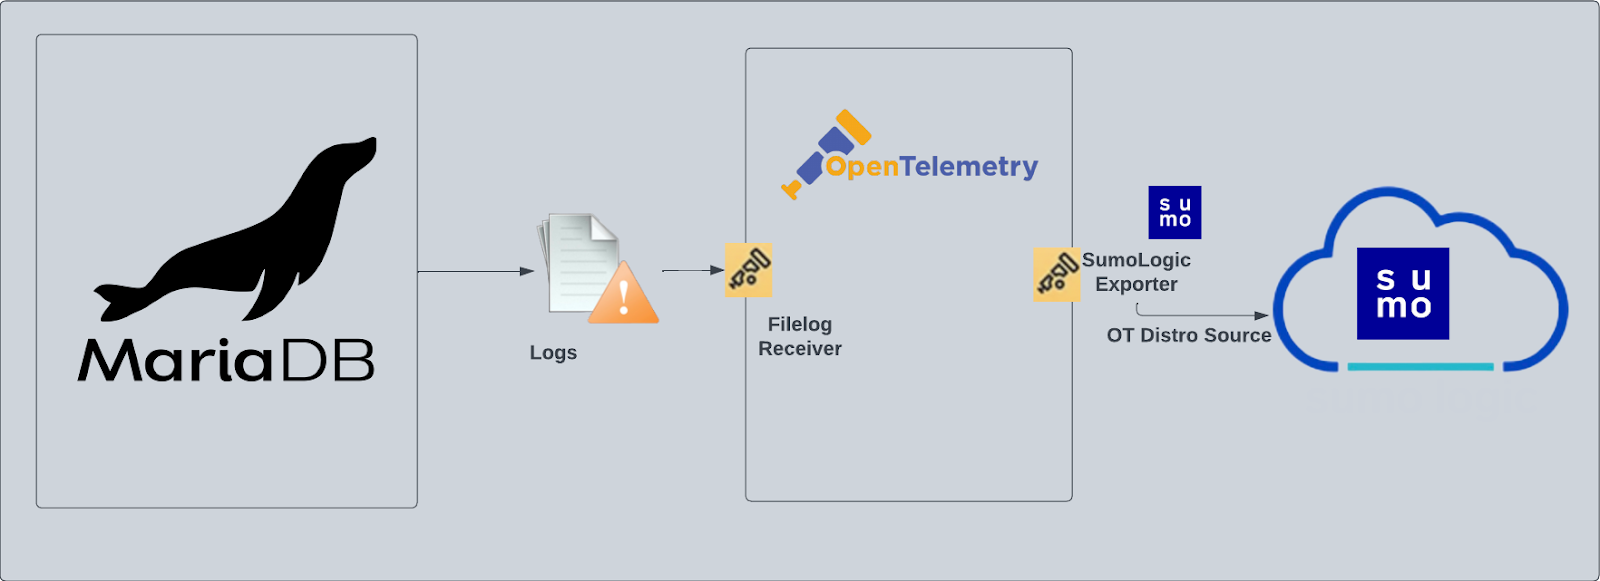
MariaDB logs are sent to Sumo Logic through OpenTelemetry [filelog receiver](https://github.com/open-telemetry/opentelemetry-collector-contrib/tree/main/receiver/filelogreceiver).
The [MariaDB](https://mariadb.org/about/) app is a logs based app that helps you monitor MariaDB database. Pre-configured dashboards provide insight into the health of your database clusters, replication, error logs, slow queries and failed logins.
This app is tested with the following MariaDB versions:
- Non-Kubernetes: MariaDB - Version 10.7.1
MariaDB logs are sent to Sumo Logic through OpenTelemetry [filelog receiver](https://github.com/open-telemetry/opentelemetry-collector-contrib/tree/main/receiver/filelogreceiver).
 ## Fields creation in Sumo Logic for MariaDB
Following are the [Fields](/docs/manage/fields/) which will be created as part of MariaDB App install if not already present.
- `db.cluster.name`. User configured. Enter a name to identify this MariaDb cluster. This cluster name will be shown in the Sumo Logic dashboards
- `db.system`. Has a fixed value of **mariadb**.
- `deployment.environment`. User configured. This is the deployment environment where the MariaDB cluster resides. For example: dev, prod, or qa.
- `sumo.datasource`. Has a fixed value of **mariadb**.
## Prerequisites
This section provides instructions for configuring log collection for MariaDB running on a non-Kubernetes environment for the Sumo Logic App for MariaDB. By default, MariaDB logs are stored in a log file.
MariaDB logs written to a log file can be collected via the Filelog receiver of OpenTelemetry.
1. To configure the MariaDB log files, locate your local `server.cnf` configuration file in the database directory.
2. Open `server.cnf` in a text editor.
3. Set the following parameters in the `[mariadb]` section:
```sql
[mariadb]
log_error=/var/log/mariadb/mariadb-error.log
log_output=FILE
slow_query_log=1
slow_query_log_file = /var/log/mariadb/slow_query.log
long_query_time=2
```
- [Error Logs](https://mariadb.com/kb/en/error-log/): MariaDB always writes its error log, but the destination is configurable.
- [Slow Query Logs](https://mariadb.com/kb/en/slow-query-log-overview/): The slow query log is disabled by default.
- [General Query Logs](https://mariadb.com/kb/en/general-query-log/). We do not recommend enabling general_log for performance reasons. These logs are not used by the Sumo Logic MariaDB App.
4. Save the `server.cnf` file.
5. Restart the MariaDB server: `systemctl restart mariadb`
import LogsCollectionPrereqisites from '../../../reuse/apps/logs-collection-prereqisites.md';
For Windows systems, log files which are collected should be accessible by the SYSTEM group. Use the following set of PowerShell commands if the SYSTEM group does not have access.
```
$NewAcl = Get-Acl -Path ""
# Set properties
$identity = "NT AUTHORITY\SYSTEM"
$fileSystemRights = "ReadAndExecute"
$type = "Allow"
# Create new rule
$fileSystemAccessRuleArgumentList = $identity, $fileSystemRights, $type
$fileSystemAccessRule = New-Object -TypeName System.Security.AccessControl.FileSystemAccessRule -ArgumentList $fileSystemAccessRuleArgumentList
# Apply new rule
$NewAcl.SetAccessRule($fileSystemAccessRule)
Set-Acl -Path "" -AclObject $NewAcl
```
## Collection configuration and app installation
import ConfigAppInstall from '../../../reuse/apps/opentelemetry/config-app-install.md';
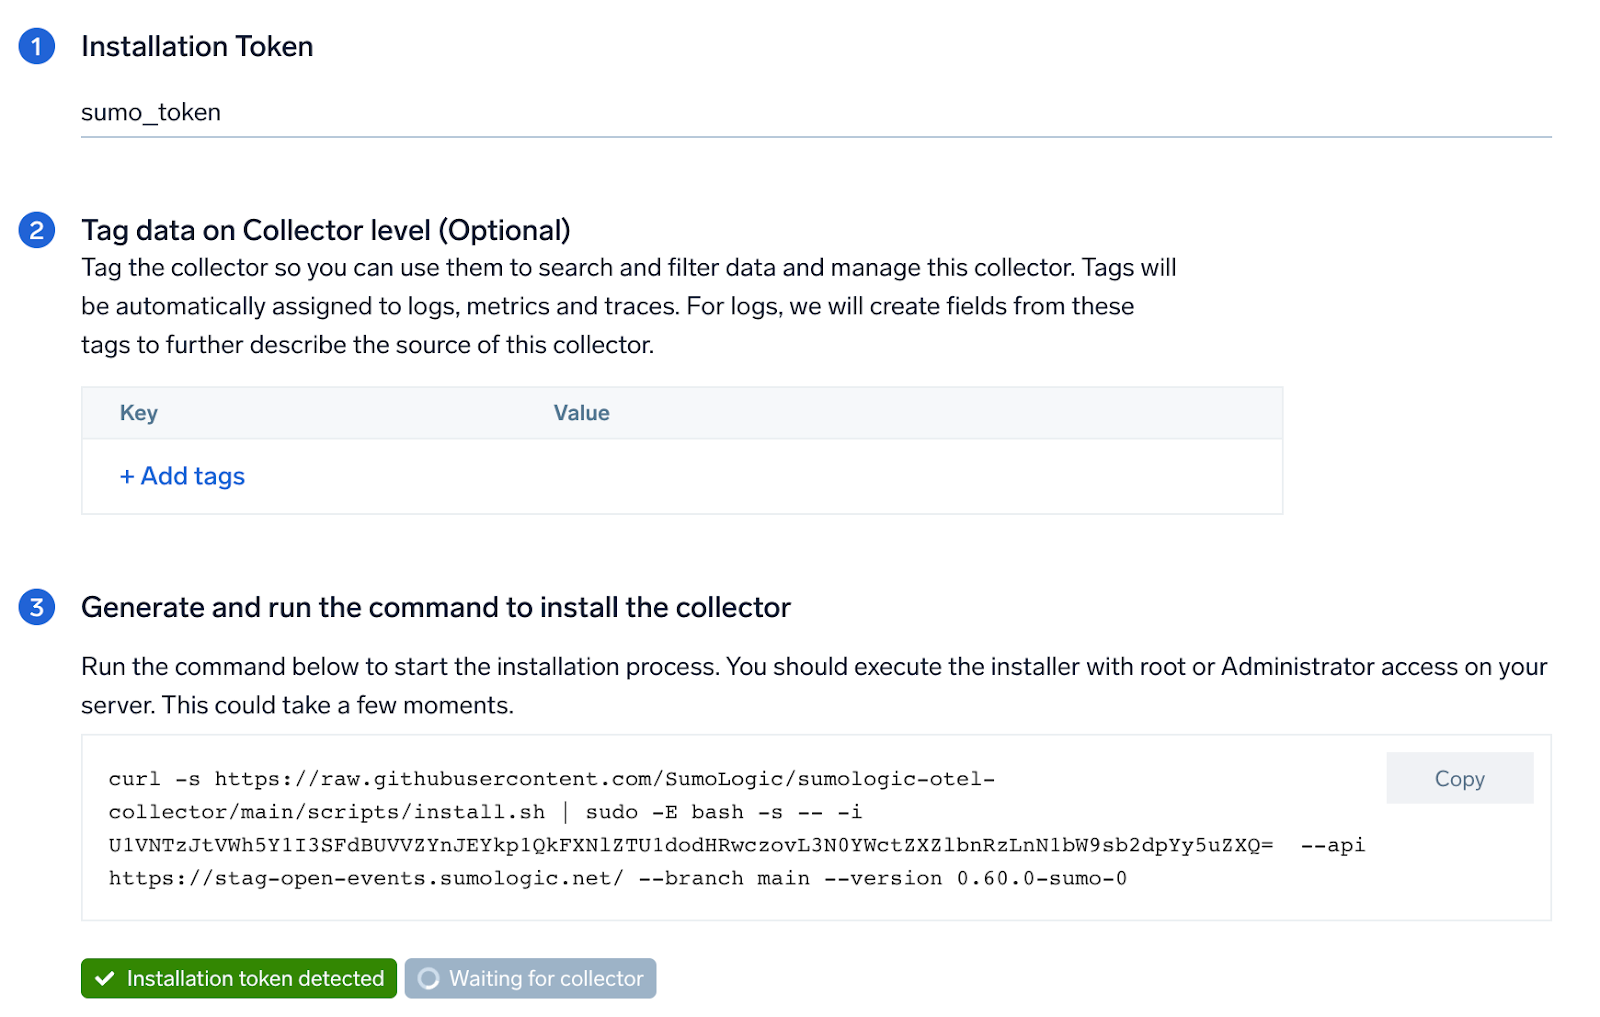
### Step 1: Set up Collector
import SetupColl from '../../../reuse/apps/opentelemetry/set-up-collector.md';
## Fields creation in Sumo Logic for MariaDB
Following are the [Fields](/docs/manage/fields/) which will be created as part of MariaDB App install if not already present.
- `db.cluster.name`. User configured. Enter a name to identify this MariaDb cluster. This cluster name will be shown in the Sumo Logic dashboards
- `db.system`. Has a fixed value of **mariadb**.
- `deployment.environment`. User configured. This is the deployment environment where the MariaDB cluster resides. For example: dev, prod, or qa.
- `sumo.datasource`. Has a fixed value of **mariadb**.
## Prerequisites
This section provides instructions for configuring log collection for MariaDB running on a non-Kubernetes environment for the Sumo Logic App for MariaDB. By default, MariaDB logs are stored in a log file.
MariaDB logs written to a log file can be collected via the Filelog receiver of OpenTelemetry.
1. To configure the MariaDB log files, locate your local `server.cnf` configuration file in the database directory.
2. Open `server.cnf` in a text editor.
3. Set the following parameters in the `[mariadb]` section:
```sql
[mariadb]
log_error=/var/log/mariadb/mariadb-error.log
log_output=FILE
slow_query_log=1
slow_query_log_file = /var/log/mariadb/slow_query.log
long_query_time=2
```
- [Error Logs](https://mariadb.com/kb/en/error-log/): MariaDB always writes its error log, but the destination is configurable.
- [Slow Query Logs](https://mariadb.com/kb/en/slow-query-log-overview/): The slow query log is disabled by default.
- [General Query Logs](https://mariadb.com/kb/en/general-query-log/). We do not recommend enabling general_log for performance reasons. These logs are not used by the Sumo Logic MariaDB App.
4. Save the `server.cnf` file.
5. Restart the MariaDB server: `systemctl restart mariadb`
import LogsCollectionPrereqisites from '../../../reuse/apps/logs-collection-prereqisites.md';
For Windows systems, log files which are collected should be accessible by the SYSTEM group. Use the following set of PowerShell commands if the SYSTEM group does not have access.
```
$NewAcl = Get-Acl -Path ""
# Set properties
$identity = "NT AUTHORITY\SYSTEM"
$fileSystemRights = "ReadAndExecute"
$type = "Allow"
# Create new rule
$fileSystemAccessRuleArgumentList = $identity, $fileSystemRights, $type
$fileSystemAccessRule = New-Object -TypeName System.Security.AccessControl.FileSystemAccessRule -ArgumentList $fileSystemAccessRuleArgumentList
# Apply new rule
$NewAcl.SetAccessRule($fileSystemAccessRule)
Set-Acl -Path "" -AclObject $NewAcl
```
## Collection configuration and app installation
import ConfigAppInstall from '../../../reuse/apps/opentelemetry/config-app-install.md';
### Step 1: Set up Collector
import SetupColl from '../../../reuse/apps/opentelemetry/set-up-collector.md';
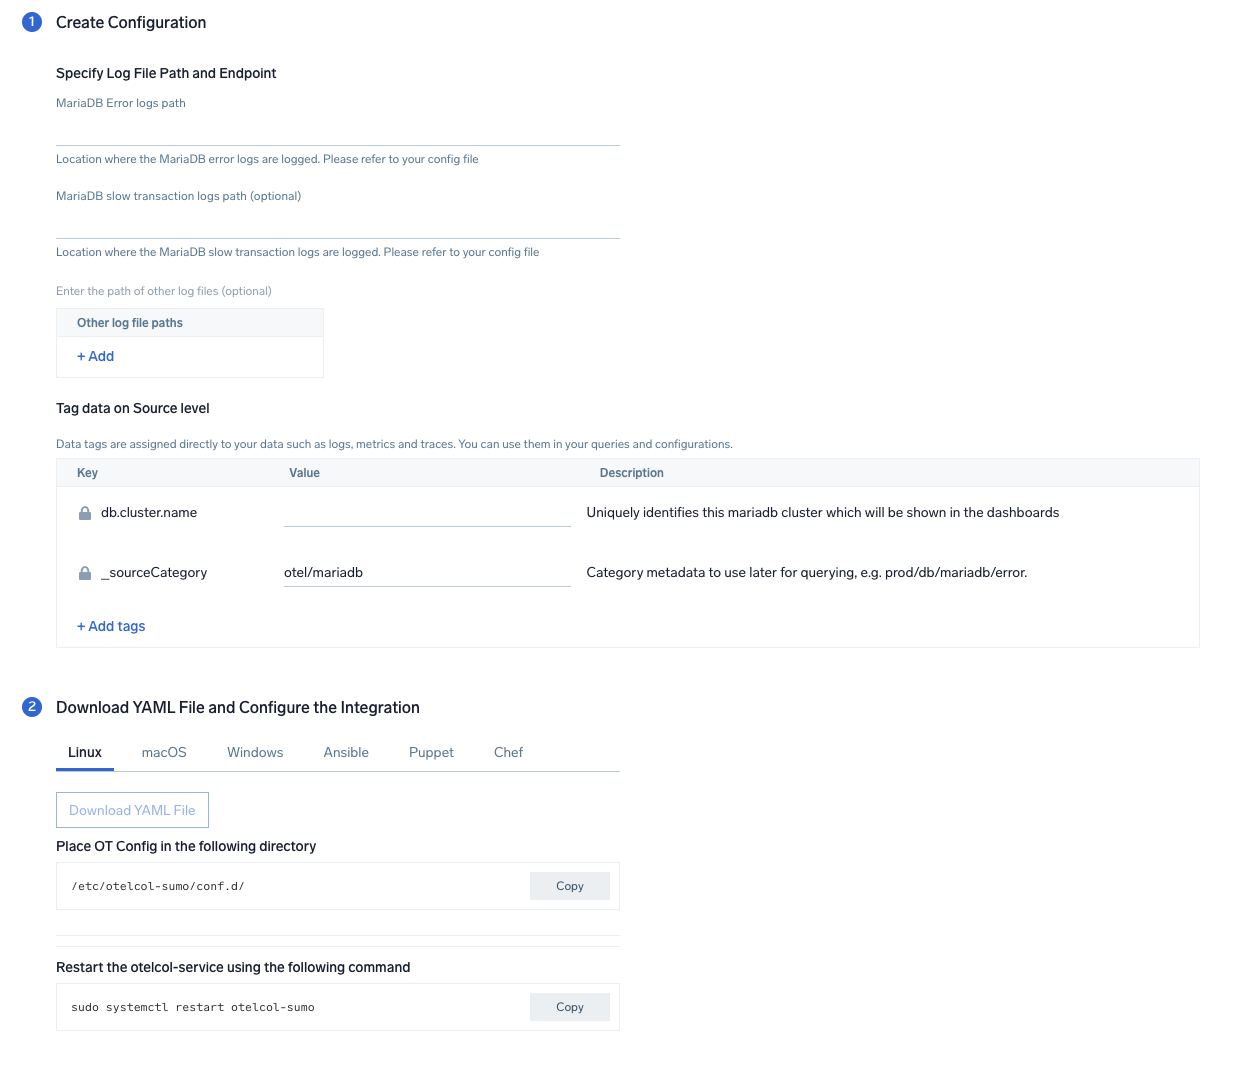
 ### Step 2: Configure integration
In this step, you will configure the yaml required for MariaDB Collection. Path of the log file configured to capture MariaDB logs is needed to be given here.
The files are typically located in `/var/log/mariadb/`. If you're using a customized path, check the respective conf file (default location: `/etc/my.cnf`) for this information. You can add any custom fields which you want to tag along with the data ingested in Sumo. Click on the **Download YAML File** button to get the yaml file.
import CollectorVersionNote from '../../../reuse/apps/opentelemetry/collector-version-note.md';
### Step 2: Configure integration
In this step, you will configure the yaml required for MariaDB Collection. Path of the log file configured to capture MariaDB logs is needed to be given here.
The files are typically located in `/var/log/mariadb/`. If you're using a customized path, check the respective conf file (default location: `/etc/my.cnf`) for this information. You can add any custom fields which you want to tag along with the data ingested in Sumo. Click on the **Download YAML File** button to get the yaml file.
import CollectorVersionNote from '../../../reuse/apps/opentelemetry/collector-version-note.md';
 ### Step 3: Send logs to Sumo Logic
Once you have the yaml file downloaded in step 2, you can copy the same to the machine which needs to be monitored. Follow the below steps based on the platform of the machine:
1. Copy the yaml file to `/etc/otelcol-sumo/conf.d/` folder in the MariaDb instance which needs to be monitored.
2. restart the collector using:
```sh
sudo systemctl restart otelcol-sumo
```
1. Copy the yaml file to `C:\ProgramData\Sumo Logic\OpenTelemetry Collector\config\conf.d` folder in the machine which needs to be monitored.
2. Restart the collector using:
```sh
Restart-Service -Name OtelcolSumo
```
1. Copy the yaml file to `/etc/otelcol-sumo/conf.d/` folder in the MariaDb instance which needs to be monitored.
2. Restart the otelcol-sumo process using:
```sh
otelcol-sumo --config /etc/otelcol-sumo/sumologic.yaml --config "glob:/etc/otelcol-sumo/conf.d/*.yaml"
```
import ChefNoEnv from '../../../reuse/apps/opentelemetry/chef-without-env.md';
import AnsibleNoEnv from '../../../reuse/apps/opentelemetry/ansible-without-env.md';
import PuppetNoEnv from '../../../reuse/apps/opentelemetry/puppet-without-env.md';
import LogsOutro from '../../../reuse/apps/opentelemetry/send-logs-outro.md';
## Sample logs
```sql
2023-01-09*04:51:04 0 [ERROR] mysqld: Event Scheduler: An error occurred when initializing system tables. Disabling the Event Scheduler.
```
## Sample queries
Following query is from the "Errors" panel of the overview dashboard in Mariadb app:
```sumo
%"sumo.datasource"=mariadb %"deployment.environment"=* %"db.cluster.name"=* "[ERROR]"
| json "log" nodrop
| if (isEmpty(log), _raw, log) as mariadb_log_message
| parse regex field=mariadb_log_message "\[(?[^\]]*)][\:]*\s(?.*)"
| where ErrorLogtype="ERROR" | count as error_count
```
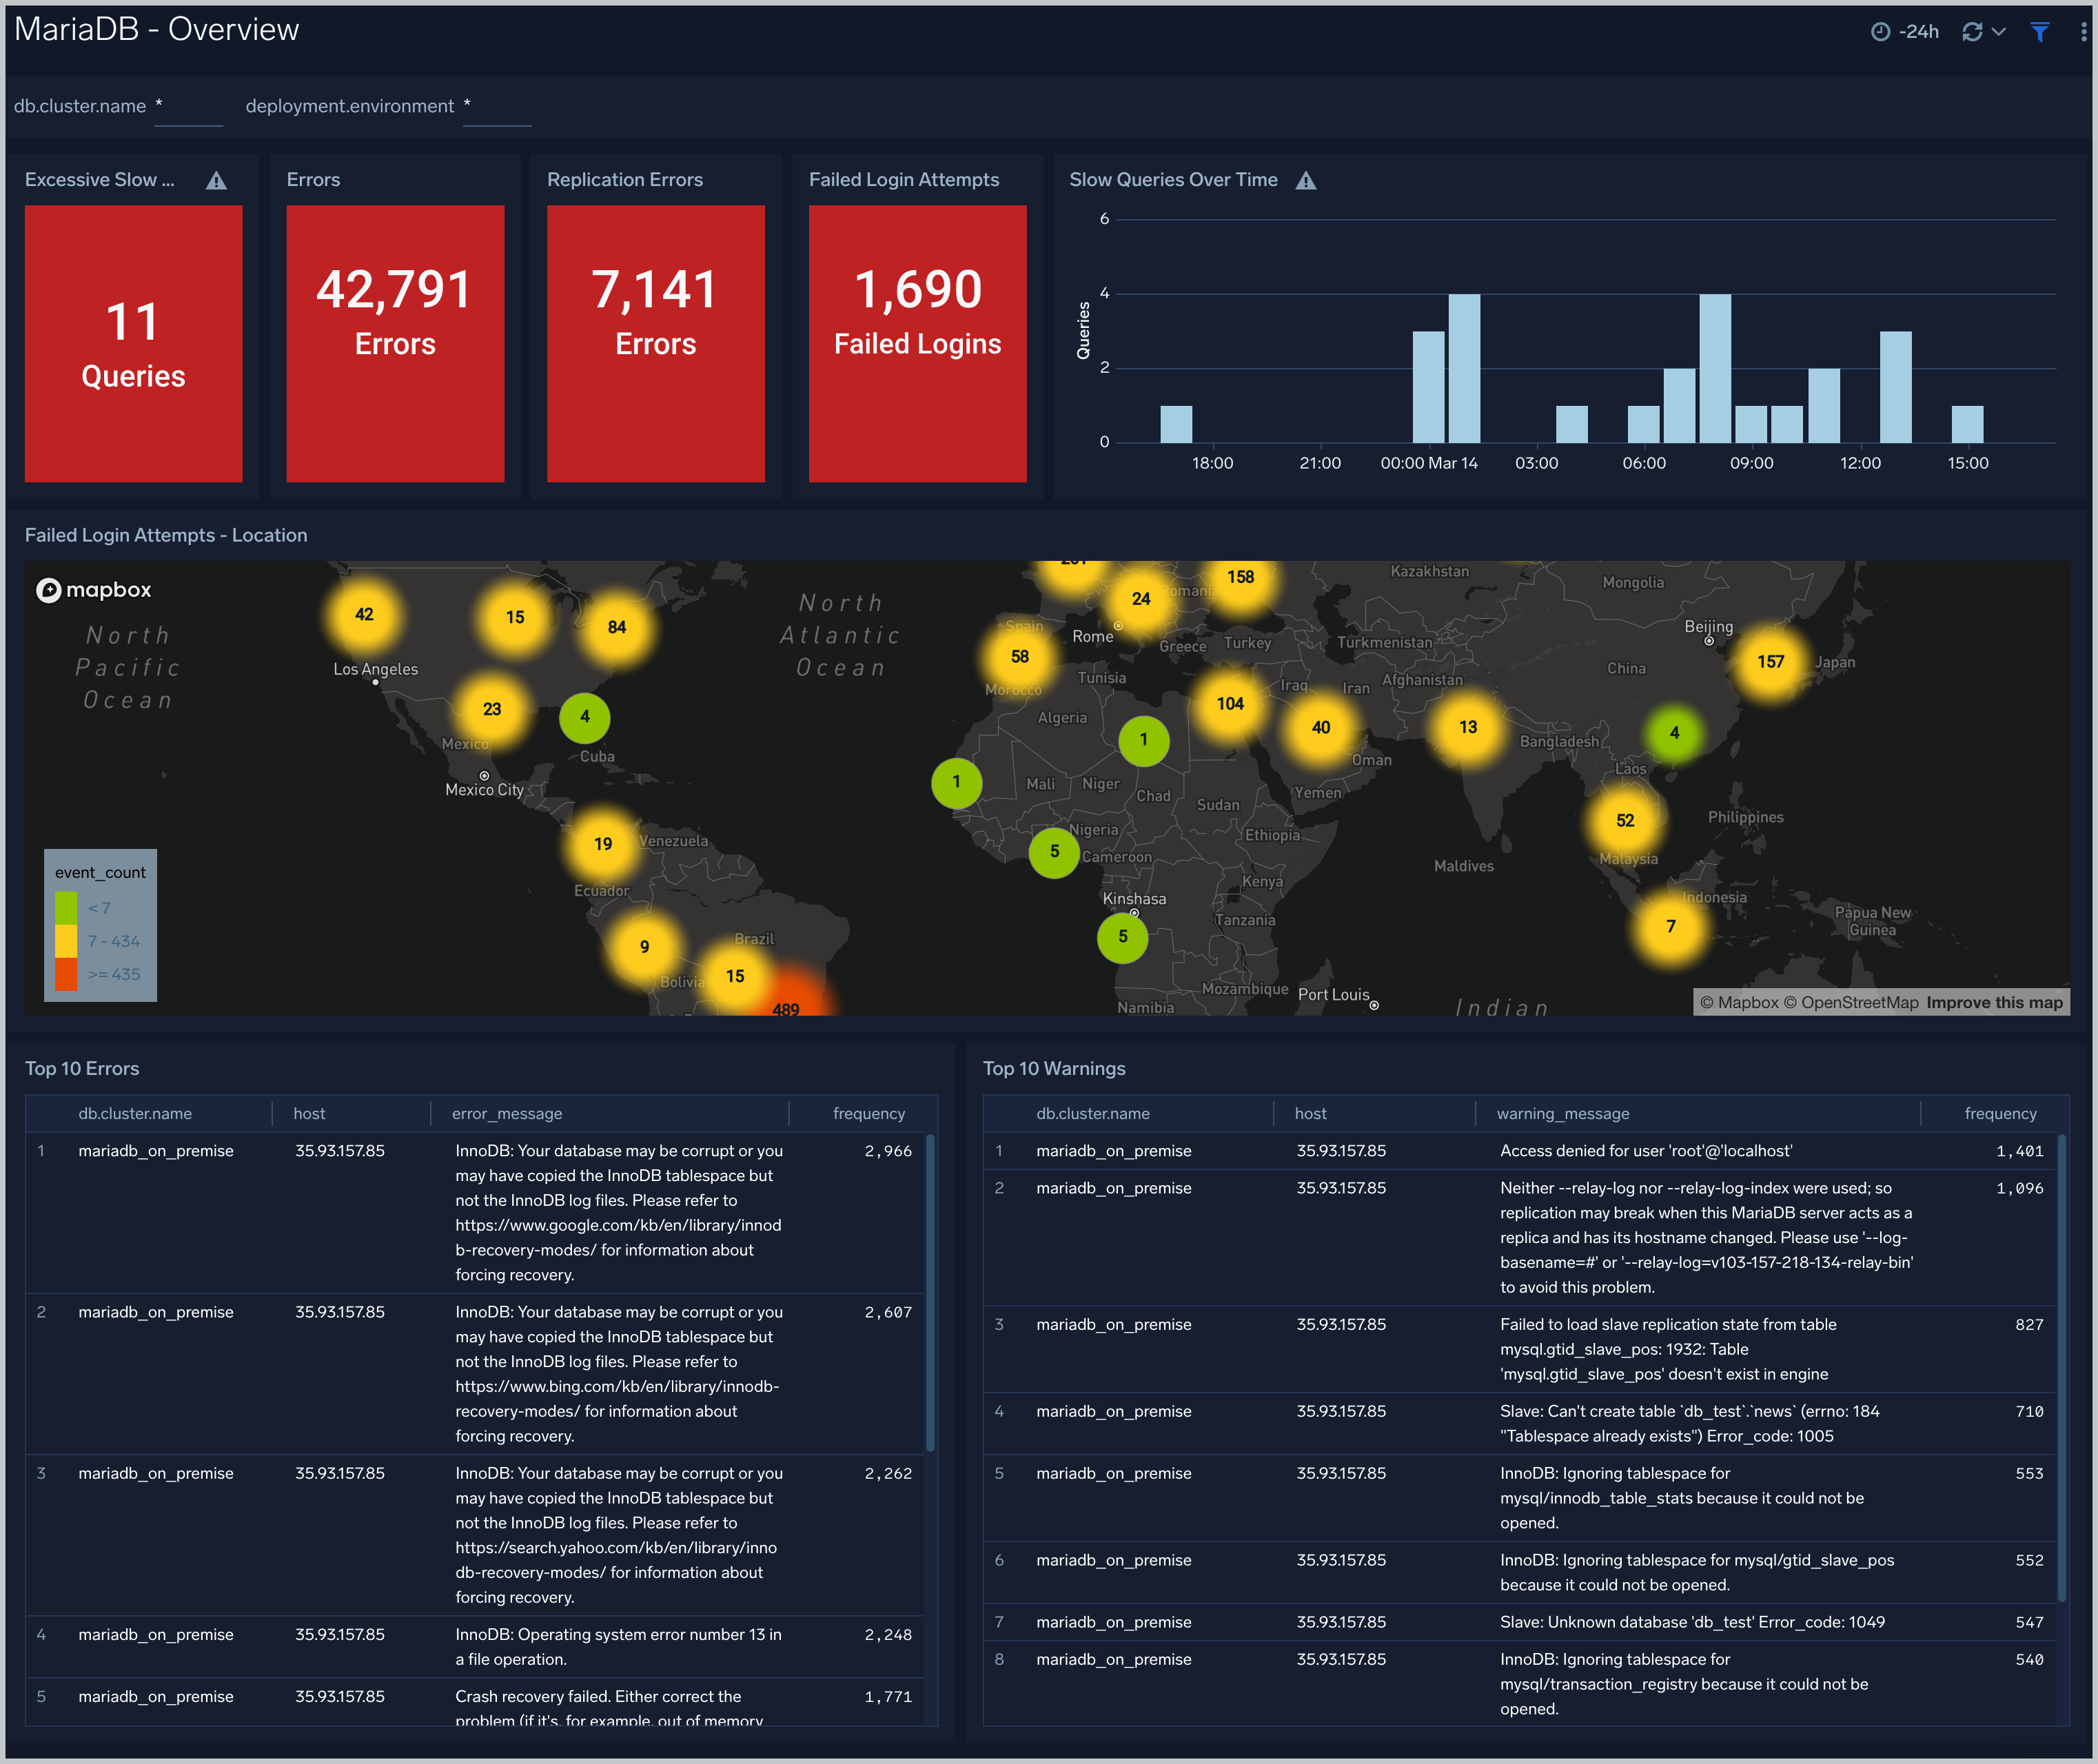
## Viewing MariaDB dashboards
### Overview
The **MariaDB - Overview** dashboard gives you an at-a-glance view of the state of your database clusters by monitoring key cluster information such as errors, failed logins, errors, queries executed, slow queries, lock waits, uptime, and more.
Use this dashboard to:
- Quickly identify the number of errors, excessive slow queries, replication errors and failed login attempts.
- Glance through the Top 10 errors and warning along with the geo location of the failed attempts of login.
### Step 3: Send logs to Sumo Logic
Once you have the yaml file downloaded in step 2, you can copy the same to the machine which needs to be monitored. Follow the below steps based on the platform of the machine:
1. Copy the yaml file to `/etc/otelcol-sumo/conf.d/` folder in the MariaDb instance which needs to be monitored.
2. restart the collector using:
```sh
sudo systemctl restart otelcol-sumo
```
1. Copy the yaml file to `C:\ProgramData\Sumo Logic\OpenTelemetry Collector\config\conf.d` folder in the machine which needs to be monitored.
2. Restart the collector using:
```sh
Restart-Service -Name OtelcolSumo
```
1. Copy the yaml file to `/etc/otelcol-sumo/conf.d/` folder in the MariaDb instance which needs to be monitored.
2. Restart the otelcol-sumo process using:
```sh
otelcol-sumo --config /etc/otelcol-sumo/sumologic.yaml --config "glob:/etc/otelcol-sumo/conf.d/*.yaml"
```
import ChefNoEnv from '../../../reuse/apps/opentelemetry/chef-without-env.md';
import AnsibleNoEnv from '../../../reuse/apps/opentelemetry/ansible-without-env.md';
import PuppetNoEnv from '../../../reuse/apps/opentelemetry/puppet-without-env.md';
import LogsOutro from '../../../reuse/apps/opentelemetry/send-logs-outro.md';
## Sample logs
```sql
2023-01-09*04:51:04 0 [ERROR] mysqld: Event Scheduler: An error occurred when initializing system tables. Disabling the Event Scheduler.
```
## Sample queries
Following query is from the "Errors" panel of the overview dashboard in Mariadb app:
```sumo
%"sumo.datasource"=mariadb %"deployment.environment"=* %"db.cluster.name"=* "[ERROR]"
| json "log" nodrop
| if (isEmpty(log), _raw, log) as mariadb_log_message
| parse regex field=mariadb_log_message "\[(?[^\]]*)][\:]*\s(?.*)"
| where ErrorLogtype="ERROR" | count as error_count
```
## Viewing MariaDB dashboards
### Overview
The **MariaDB - Overview** dashboard gives you an at-a-glance view of the state of your database clusters by monitoring key cluster information such as errors, failed logins, errors, queries executed, slow queries, lock waits, uptime, and more.
Use this dashboard to:
- Quickly identify the number of errors, excessive slow queries, replication errors and failed login attempts.
- Glance through the Top 10 errors and warning along with the geo location of the failed attempts of login.
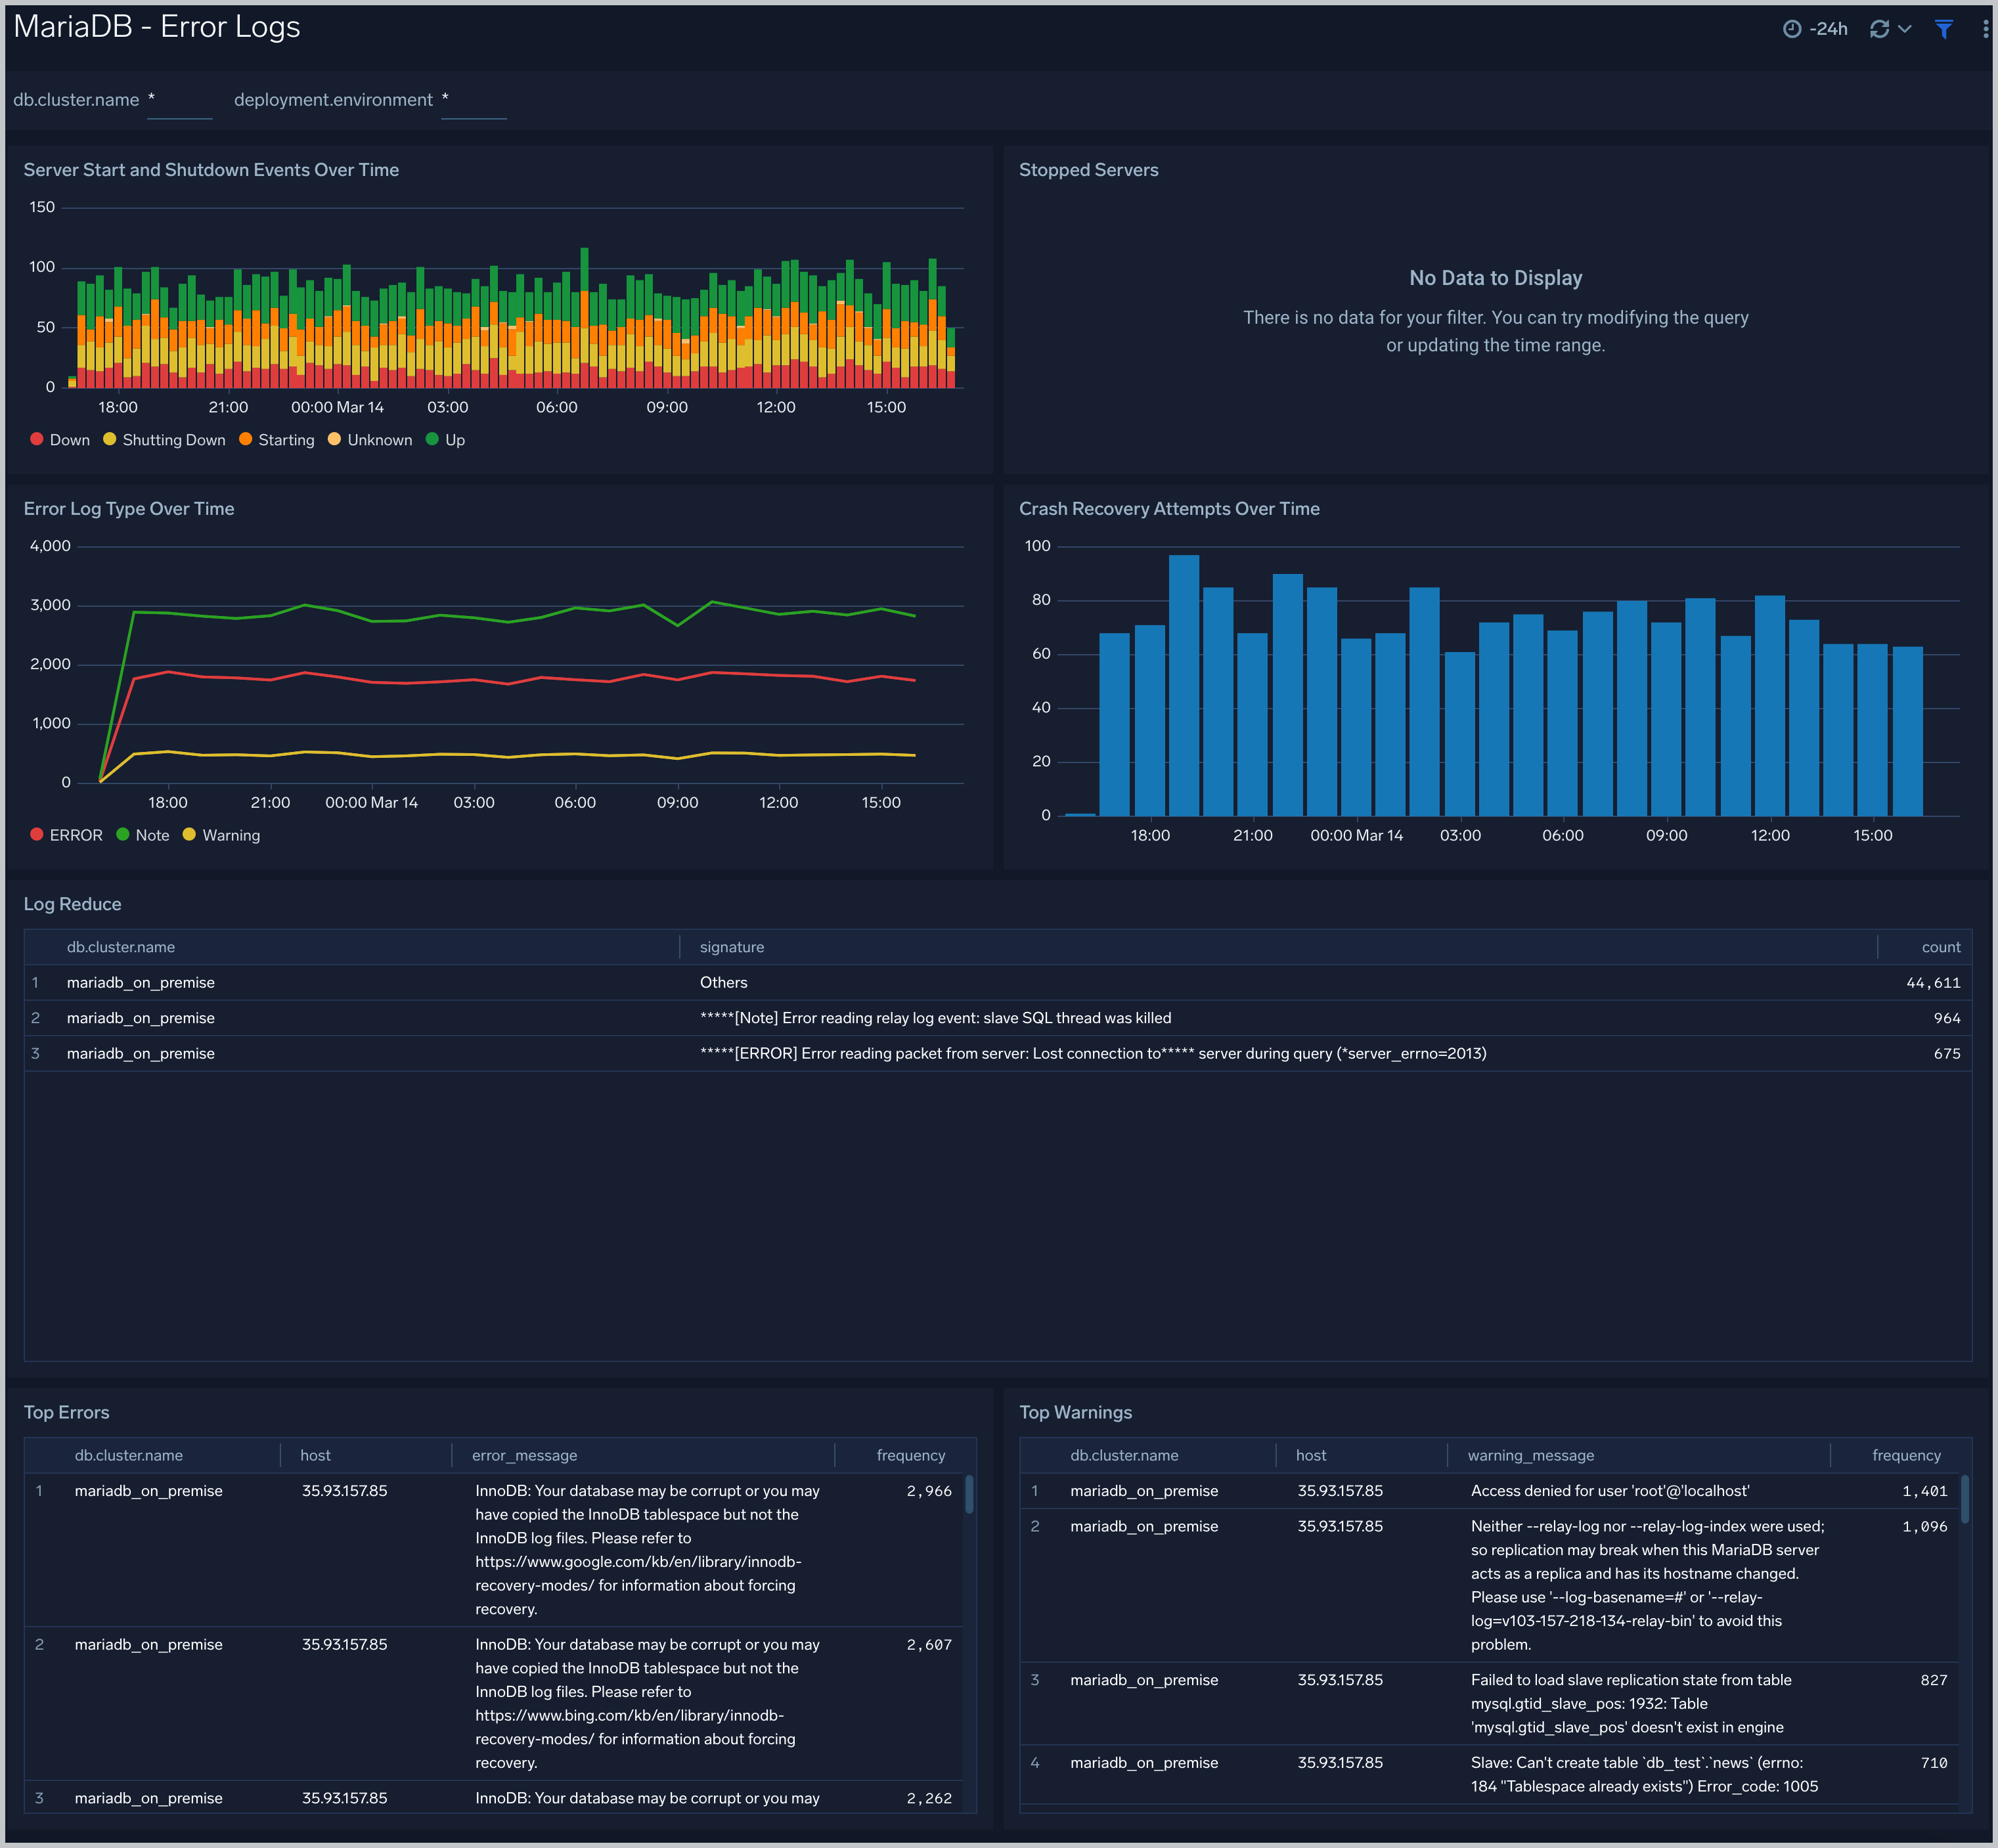
 ### Error Logs
The **MariaDB - Error Logs** dashboard provides insight into database error logs by specifically monitoring database shutdown/start events, errors over time, errors, warnings, and crash recovery attempts.
Use this dashboard to:
- Quickly identify errors and patterns in logs for troubleshooting.
- Monitor trends in the error log and identify outliers.
- Ensure that server start, server stop, and crash recovery events are in line with expectations.
- Dashboard filters allow you to narrow a search for the database clusters.
### Error Logs
The **MariaDB - Error Logs** dashboard provides insight into database error logs by specifically monitoring database shutdown/start events, errors over time, errors, warnings, and crash recovery attempts.
Use this dashboard to:
- Quickly identify errors and patterns in logs for troubleshooting.
- Monitor trends in the error log and identify outliers.
- Ensure that server start, server stop, and crash recovery events are in line with expectations.
- Dashboard filters allow you to narrow a search for the database clusters.
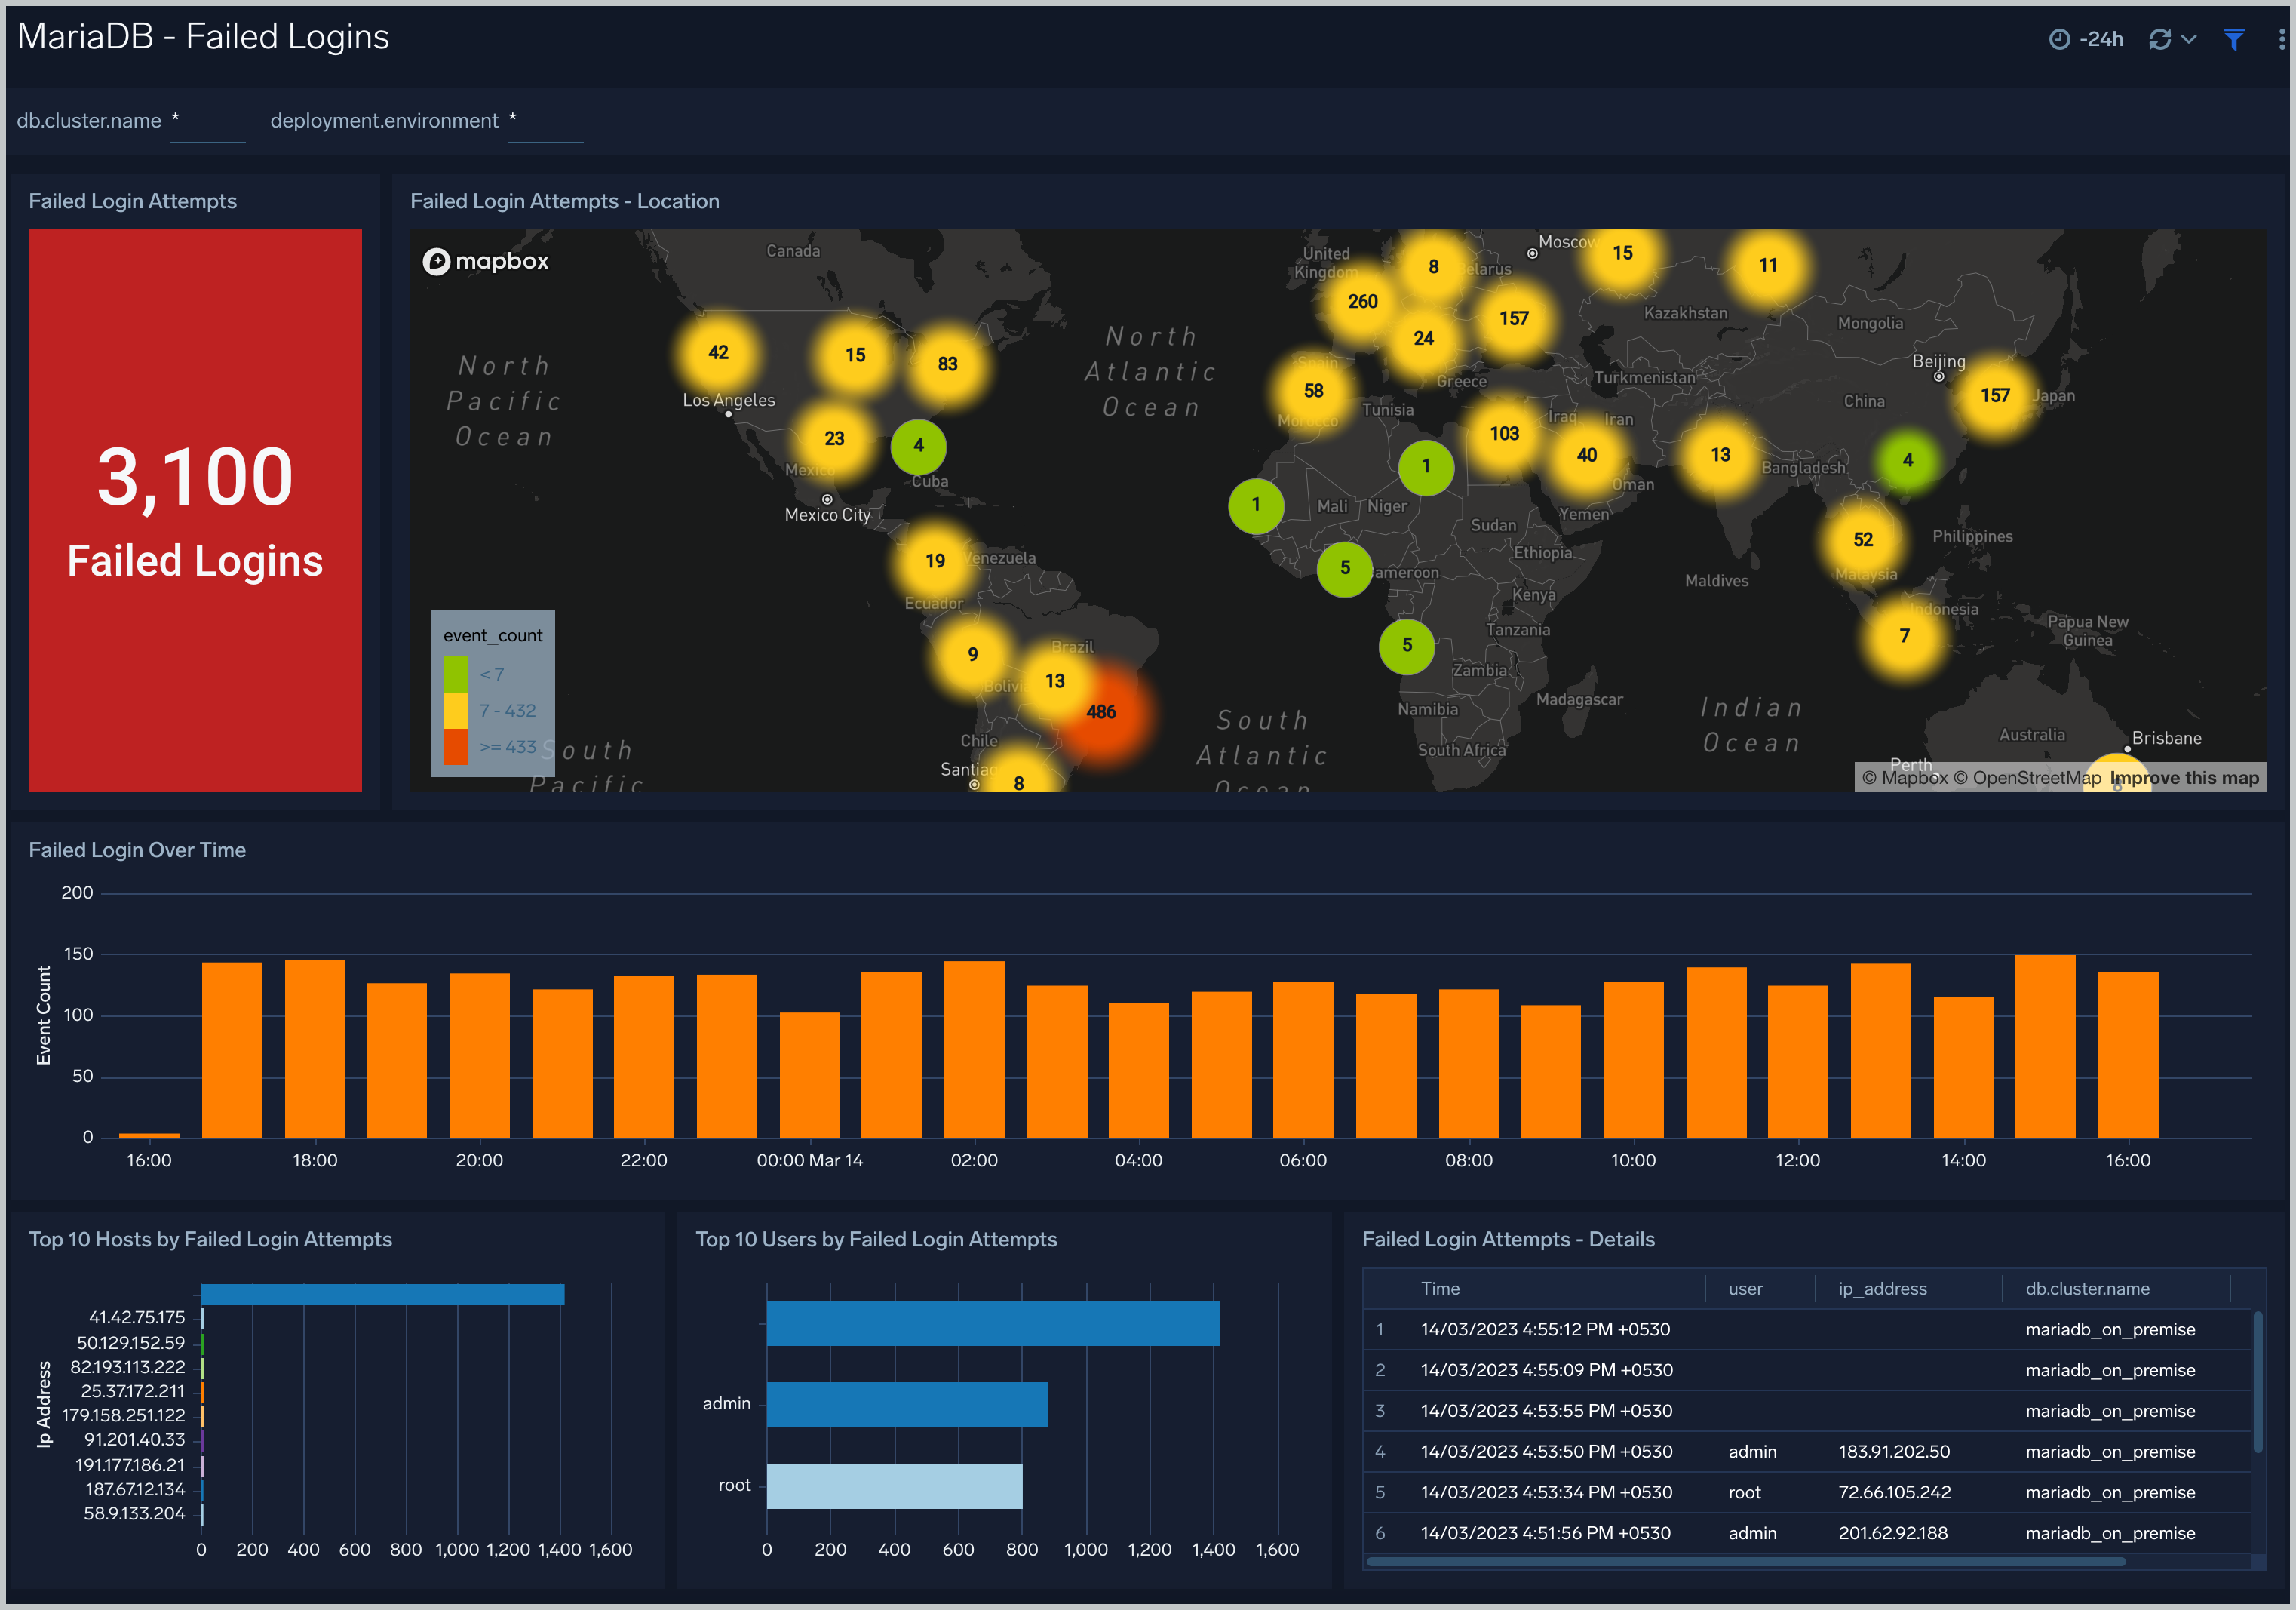
 ### Failed Logins
The **MariaDB - Failed Logins** dashboard provides insights into all failed login attempts by location, users and hosts.
Use this dashboard to:
- Monitor all failed login attempts and identify any unusual or suspicious activity.
### Failed Logins
The **MariaDB - Failed Logins** dashboard provides insights into all failed login attempts by location, users and hosts.
Use this dashboard to:
- Monitor all failed login attempts and identify any unusual or suspicious activity.
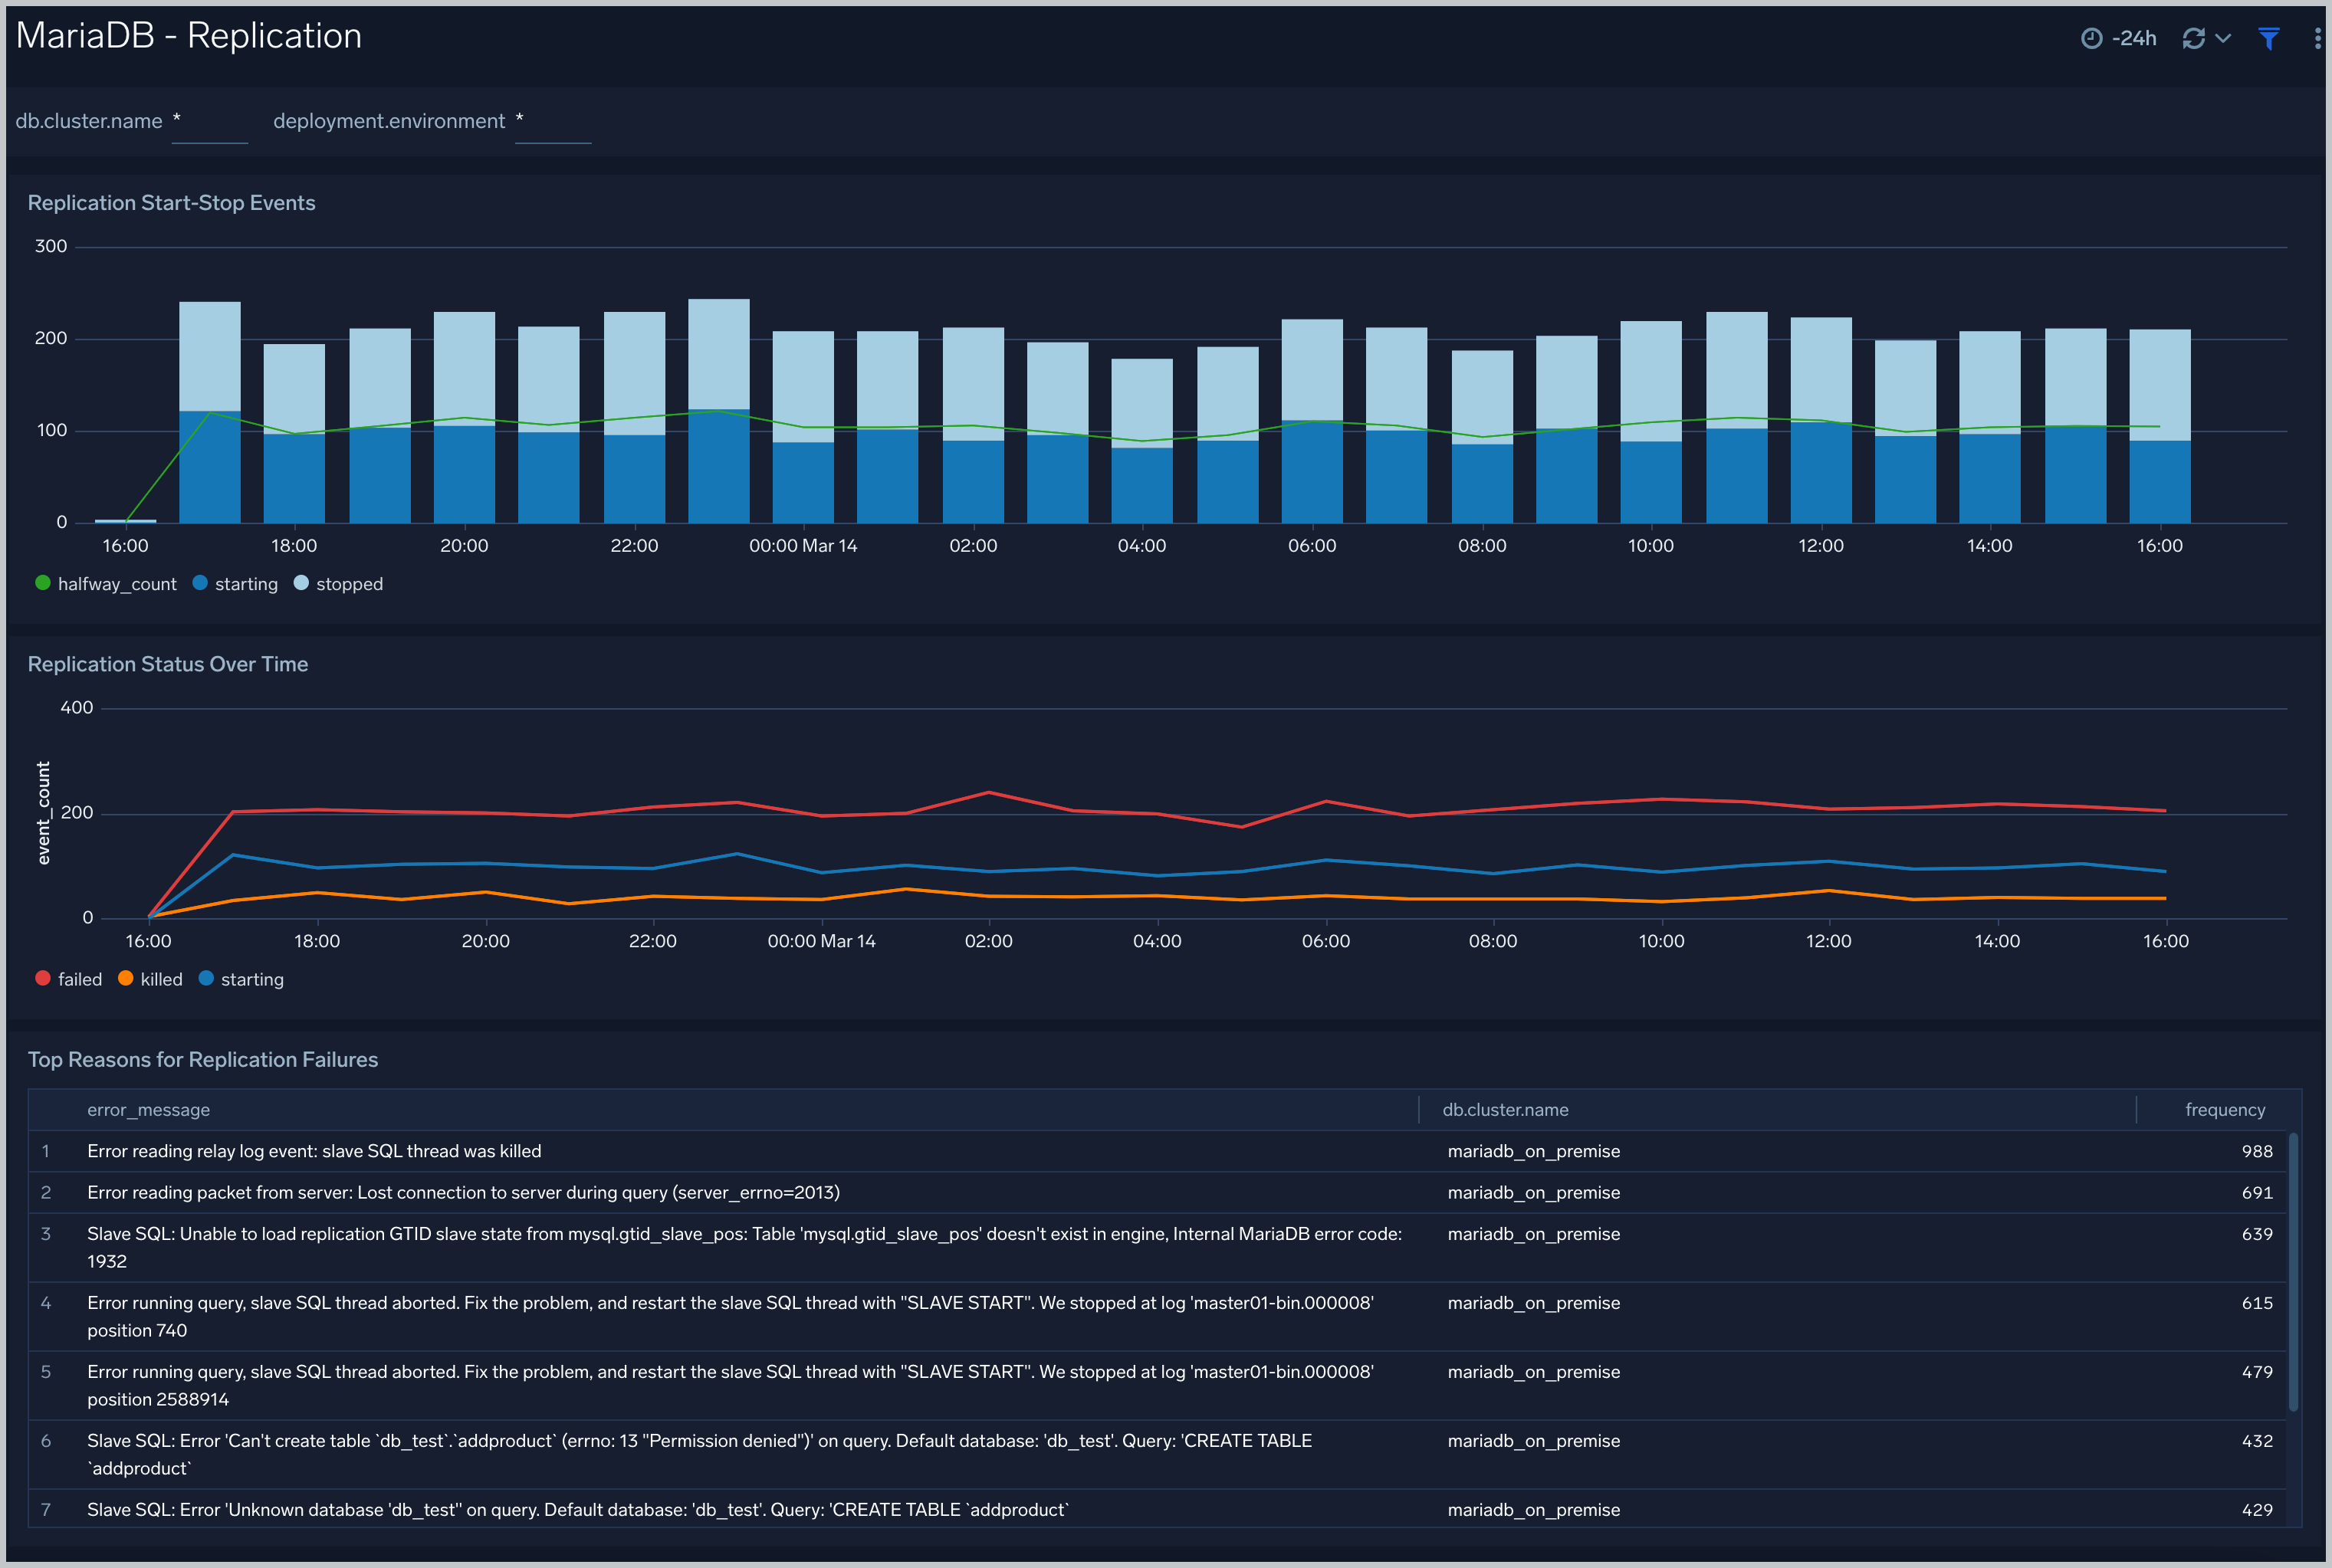
 ### Replication
The **MariaDB - Replication** dashboard provides insights into the state of database replication.
Use this dashboard to:
- Quickly determine reasons for replication failures.
- Monitor replication status trends.
### Replication
The **MariaDB - Replication** dashboard provides insights into the state of database replication.
Use this dashboard to:
- Quickly determine reasons for replication failures.
- Monitor replication status trends.
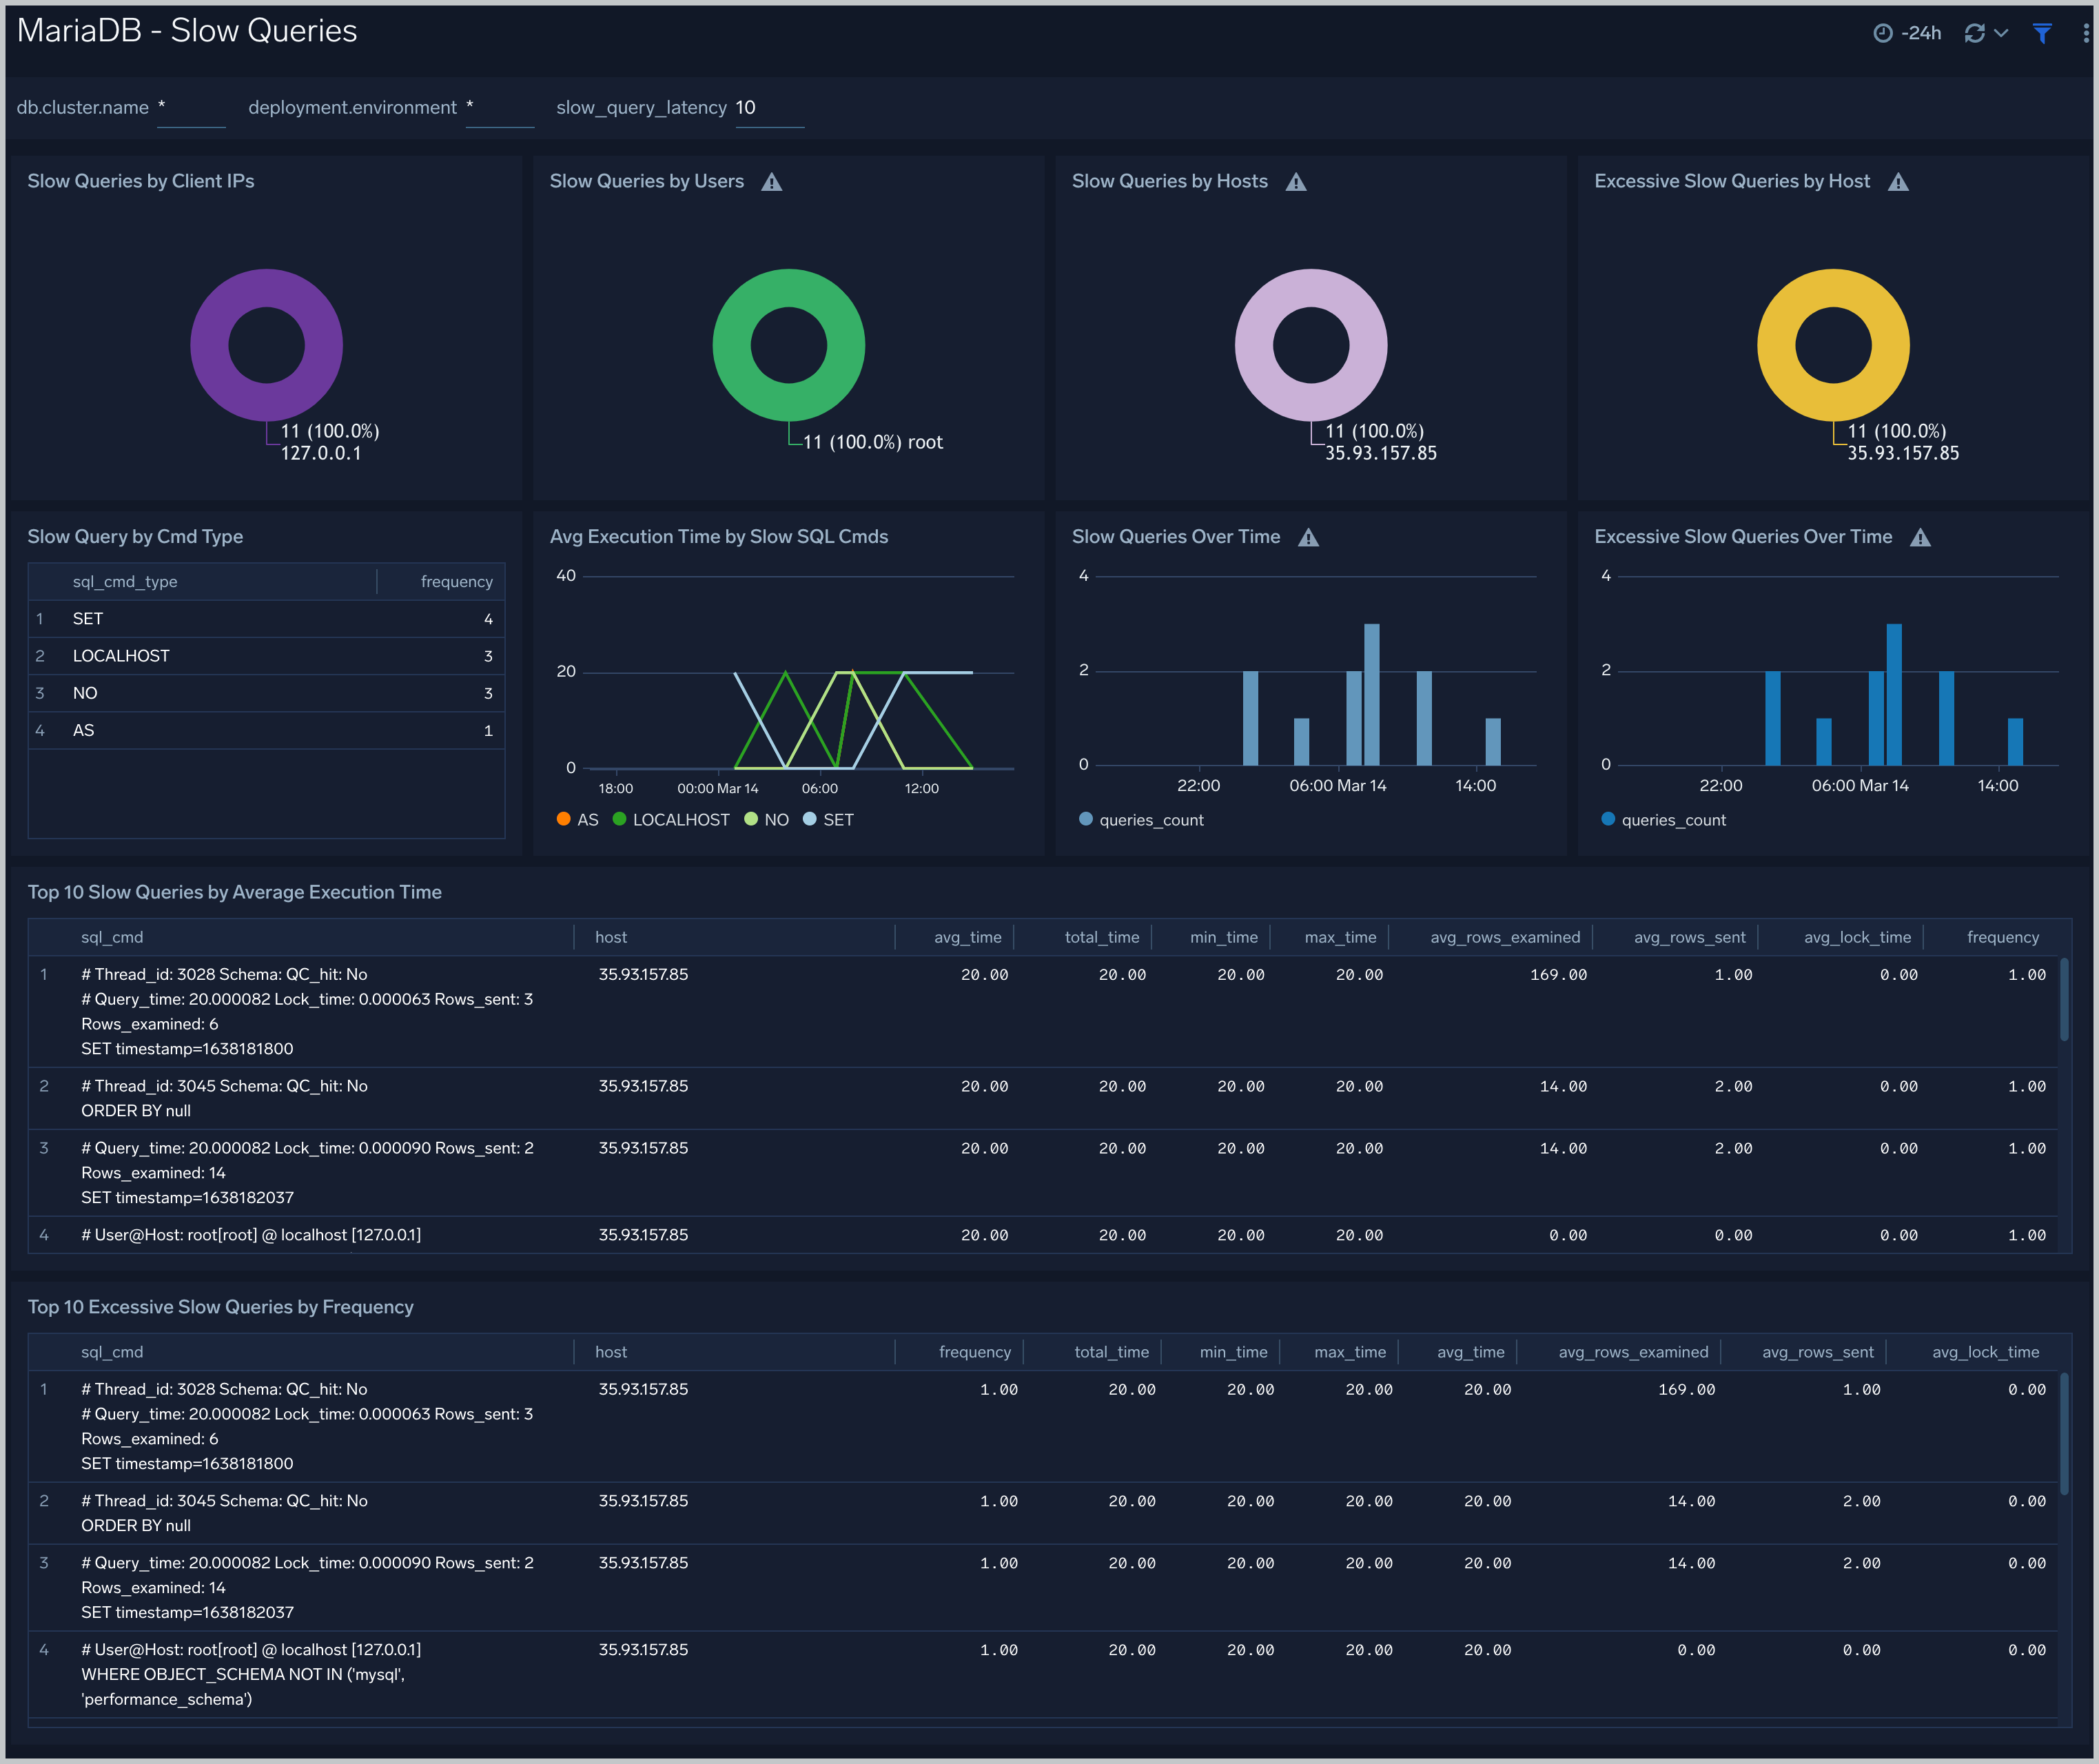
 ### Slow Queries
The **MariaDB - Slow Queries** dashboard provides insights into all slow queries executed on the database.
Slow queries are queries that take 10 seconds or more to execute (default value is 10 seconds as per MariaDB configuration which can be altered) and excessive slow queries are those that take 15 seconds or more to execute.
Use this dashboard to:
- Identify all slow queries.
- Quickly determine which queries have been identified as slow or excessive slow queries.
- Monitor users and hosts running slow queries.
- Determine which SQL commands are slower than others.
- Examine slow query trends to determine if there are periodic performance bottlenecks in your database clusters.
### Slow Queries
The **MariaDB - Slow Queries** dashboard provides insights into all slow queries executed on the database.
Slow queries are queries that take 10 seconds or more to execute (default value is 10 seconds as per MariaDB configuration which can be altered) and excessive slow queries are those that take 15 seconds or more to execute.
Use this dashboard to:
- Identify all slow queries.
- Quickly determine which queries have been identified as slow or excessive slow queries.
- Monitor users and hosts running slow queries.
- Determine which SQL commands are slower than others.
- Examine slow query trends to determine if there are periodic performance bottlenecks in your database clusters.
 ## Create monitors for MariaDB app
import CreateMonitors from '../../../reuse/apps/create-monitors.md';
### MariaDB alerts
| Name | Description | Alert Condition | Recover Condition |
|:--|:--|:--|:--|
| `MariaDB - Critical Errors` | This alert is triggered when there are critical database errors. | Count `>` 10 | Count `<=` 10 |
| `MariaDB - Excessive Slow Query Detected` | This alert is triggered when the average time to execute a query is more than 15 seconds for a 5 minute time interval. | Count `>=` 1 | Count `<` 1 |
| `MariaDB - Failed Login Attempts` | This alert is triggered when there are excessive failed login attempts in a short period. | Count `>=` 1 | Count `<` 1 |
| `MariaDB - Instance down` | This alert is triggered when the MariaDB instance is down. | Count `>=` 1 | Count `<` 1 |
| `MariaDB - Replication Failure` | This alert is triggered when there are replication failures. | Count `>=` 1 | Count `<` 1 |
## Create monitors for MariaDB app
import CreateMonitors from '../../../reuse/apps/create-monitors.md';
### MariaDB alerts
| Name | Description | Alert Condition | Recover Condition |
|:--|:--|:--|:--|
| `MariaDB - Critical Errors` | This alert is triggered when there are critical database errors. | Count `>` 10 | Count `<=` 10 |
| `MariaDB - Excessive Slow Query Detected` | This alert is triggered when the average time to execute a query is more than 15 seconds for a 5 minute time interval. | Count `>=` 1 | Count `<` 1 |
| `MariaDB - Failed Login Attempts` | This alert is triggered when there are excessive failed login attempts in a short period. | Count `>=` 1 | Count `<` 1 |
| `MariaDB - Instance down` | This alert is triggered when the MariaDB instance is down. | Count `>=` 1 | Count `<` 1 |
| `MariaDB - Replication Failure` | This alert is triggered when there are replication failures. | Count `>=` 1 | Count `<` 1 |