---
id: memcached-opentelemetry
title: Memcached - OpenTelemetry Collector
sidebar_label: Memcached - OTel Collector
description: Learn about the Sumo Logic OpenTelemetry app for Memcached.
slug: /help/docs/integrations/databases/opentelemetry/memcached-opentelemetry/
canonical: https://www.sumologic.com/help/docs/integrations/databases/opentelemetry/memcached-opentelemetry/
---
import useBaseUrl from '@docusaurus/useBaseUrl';
import Tabs from '@theme/Tabs';
import TabItem from '@theme/TabItem';
})
}) The [Memcached](https://memcached.org/about) app is a logs-based app that helps you monitor the availability, performance, health, and resource utilization of your Memcached clusters. Preconfigured dashboards provide insight into operational metrics, cache performance, resource utilization, errors, warnings, and commands executed.
The Sumo Logic app for Memcached is tested for Version: 1.4.15.
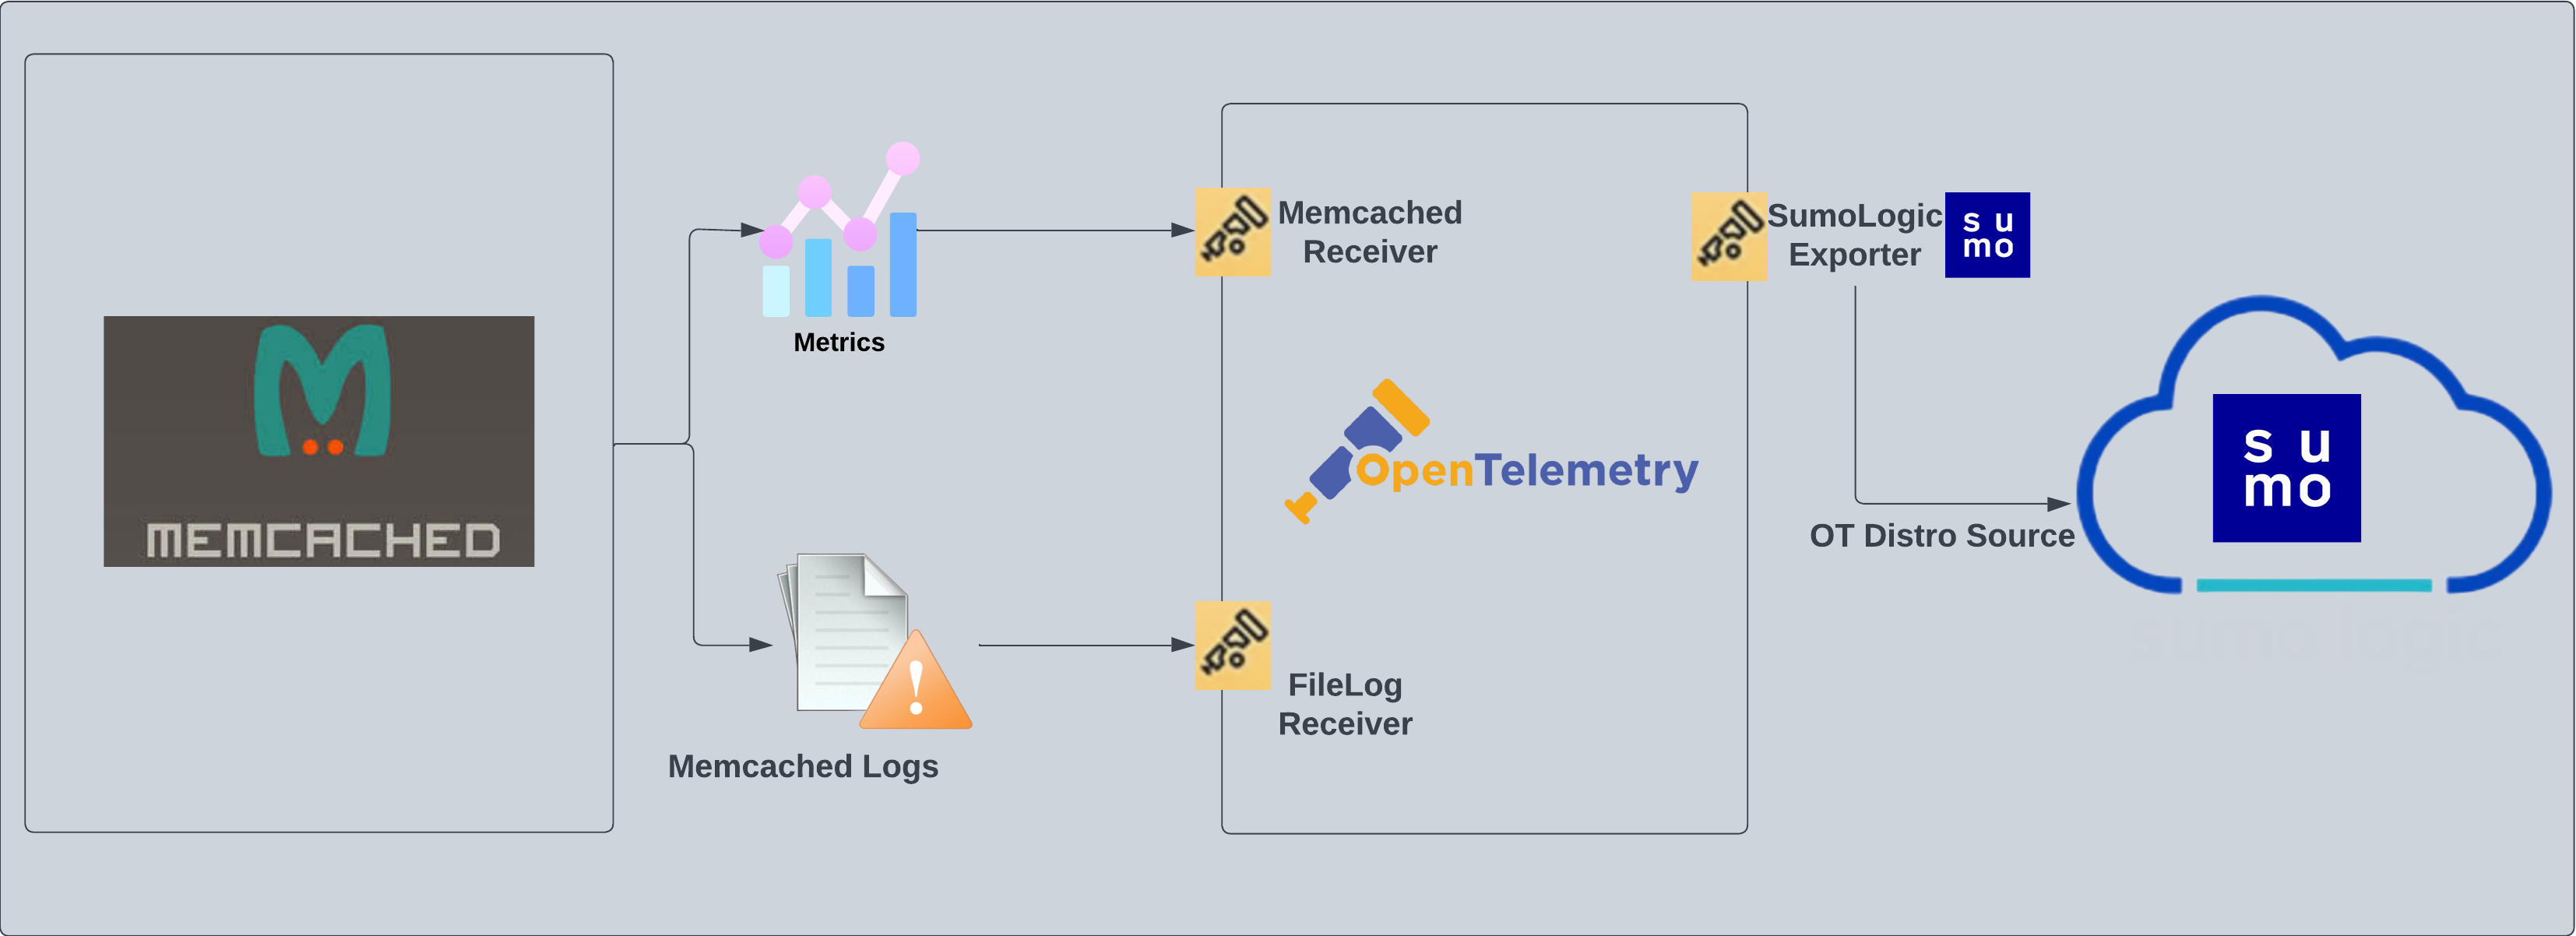
Memcached logs are sent to Sumo Logic through the OpenTelemetry [filelog receiver](https://github.com/open-telemetry/opentelemetry-collector-contrib/tree/main/receiver/filelogreceiver). Memcached metrics are sent through the [Memcached](https://github.com/open-telemetry/opentelemetry-collector-contrib/tree/main/receiver/memcachedreceiver) metrics receiver.
The [Memcached](https://memcached.org/about) app is a logs-based app that helps you monitor the availability, performance, health, and resource utilization of your Memcached clusters. Preconfigured dashboards provide insight into operational metrics, cache performance, resource utilization, errors, warnings, and commands executed.
The Sumo Logic app for Memcached is tested for Version: 1.4.15.
Memcached logs are sent to Sumo Logic through the OpenTelemetry [filelog receiver](https://github.com/open-telemetry/opentelemetry-collector-contrib/tree/main/receiver/filelogreceiver). Memcached metrics are sent through the [Memcached](https://github.com/open-telemetry/opentelemetry-collector-contrib/tree/main/receiver/memcachedreceiver) metrics receiver.
 :::info
This app includes [built-in monitors](#memcached-alerts). For details on creating custom monitors, refer to the [Create monitors for Memcached app](#create-monitors-for-memcached-app).
:::
## Fields creation in Sumo Logic for Memcached
Following are the [Fields](/docs/manage/fields/) which will be created as part of Memcached App install if not already present.
- **`sumo.datasource`**. Has a fixed value of **memcached**.
- **`db.system`**. Has a fixed value of **memcached**.
- **`deployment.environment`**. User configured. This is the deployment environment where the Memcache cluster resides. For example: dev, prod, or qa.
- **`db.cluster.name`**. User configured. Enter a name to identify this Memcached cluster. This cluster name will be shown in the Sumo Logic dashboards.
- **`db.node.name`**. This has value of the FQDN of the machine where OpenTelemetry collector is collecting logs and metrics from.
## Prerequisites
1. Configure logging in Memcached: By default, the installation of Memcached will not write any request logs to disk. To add a log file for Memcached, you can use the following syntax:
```sql
memcached -d -m 3072 -l localhost -p 11211 -u nobody -v 2>>/var/log/memcached/memcached.log
```
2. Or, if you're on RHEL/CentOS, you can edit the file `/etc/sysconfig/memcached` like so:
```sql
PORT="11211"
USER="memcached"
MAXCONN="3048"
CACHESIZE="256"
OPTIONS="-vv >> /var/log/memcached/memcached.log 2>&1"
```
3. Save the file and restart Memcached.
import LogsCollectionPrereqisites from '../../../reuse/apps/logs-collection-prereqisites.md';
For Windows systems, log files which are collected should be accessible by the SYSTEM group. Use the following set of PowerShell commands if the SYSTEM group does not have access.
```
$NewAcl = Get-Acl -Path ""
# Set properties
$identity = "NT AUTHORITY\SYSTEM"
$fileSystemRights = "ReadAndExecute"
$type = "Allow"
# Create new rule
$fileSystemAccessRuleArgumentList = $identity, $fileSystemRights, $type
$fileSystemAccessRule = New-Object -TypeName System.Security.AccessControl.FileSystemAccessRule -ArgumentList $fileSystemAccessRuleArgumentList
# Apply new rule
$NewAcl.SetAccessRule($fileSystemAccessRule)
Set-Acl -Path "" -AclObject $NewAcl
```
## Collection configuration and app installation
import ConfigAppInstall from '../../../reuse/apps/opentelemetry/config-app-install.md';
### Step 1: Set up Collector
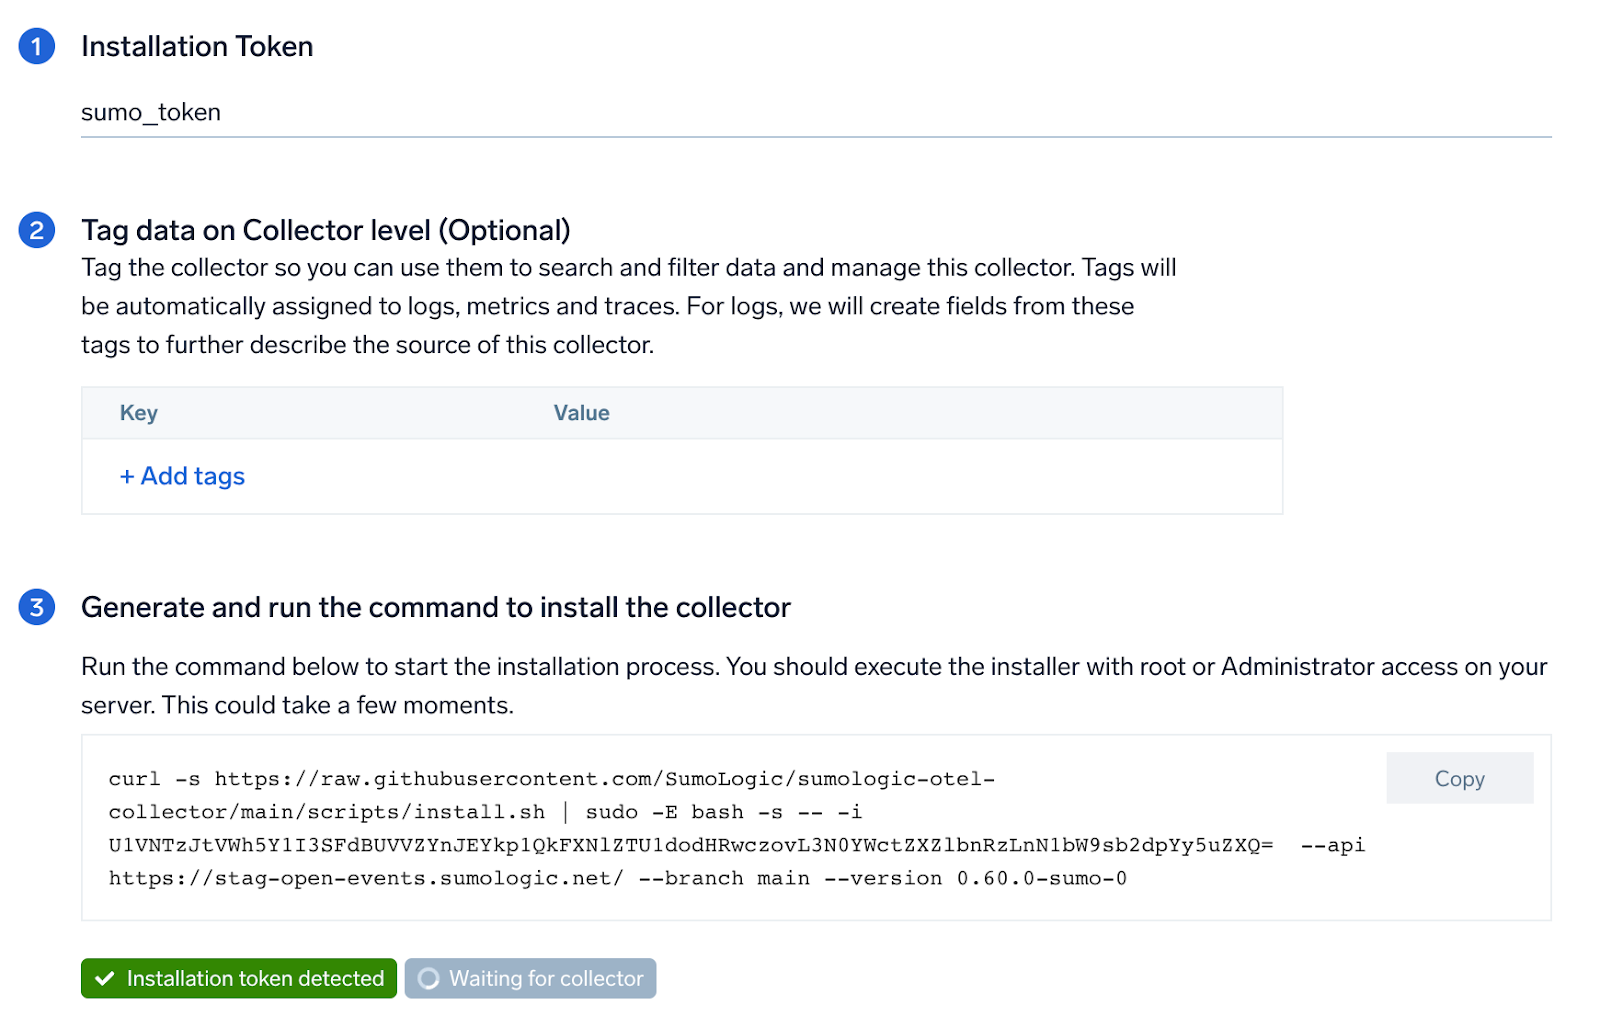
import SetupColl from '../../../reuse/apps/opentelemetry/set-up-collector.md';
:::info
This app includes [built-in monitors](#memcached-alerts). For details on creating custom monitors, refer to the [Create monitors for Memcached app](#create-monitors-for-memcached-app).
:::
## Fields creation in Sumo Logic for Memcached
Following are the [Fields](/docs/manage/fields/) which will be created as part of Memcached App install if not already present.
- **`sumo.datasource`**. Has a fixed value of **memcached**.
- **`db.system`**. Has a fixed value of **memcached**.
- **`deployment.environment`**. User configured. This is the deployment environment where the Memcache cluster resides. For example: dev, prod, or qa.
- **`db.cluster.name`**. User configured. Enter a name to identify this Memcached cluster. This cluster name will be shown in the Sumo Logic dashboards.
- **`db.node.name`**. This has value of the FQDN of the machine where OpenTelemetry collector is collecting logs and metrics from.
## Prerequisites
1. Configure logging in Memcached: By default, the installation of Memcached will not write any request logs to disk. To add a log file for Memcached, you can use the following syntax:
```sql
memcached -d -m 3072 -l localhost -p 11211 -u nobody -v 2>>/var/log/memcached/memcached.log
```
2. Or, if you're on RHEL/CentOS, you can edit the file `/etc/sysconfig/memcached` like so:
```sql
PORT="11211"
USER="memcached"
MAXCONN="3048"
CACHESIZE="256"
OPTIONS="-vv >> /var/log/memcached/memcached.log 2>&1"
```
3. Save the file and restart Memcached.
import LogsCollectionPrereqisites from '../../../reuse/apps/logs-collection-prereqisites.md';
For Windows systems, log files which are collected should be accessible by the SYSTEM group. Use the following set of PowerShell commands if the SYSTEM group does not have access.
```
$NewAcl = Get-Acl -Path ""
# Set properties
$identity = "NT AUTHORITY\SYSTEM"
$fileSystemRights = "ReadAndExecute"
$type = "Allow"
# Create new rule
$fileSystemAccessRuleArgumentList = $identity, $fileSystemRights, $type
$fileSystemAccessRule = New-Object -TypeName System.Security.AccessControl.FileSystemAccessRule -ArgumentList $fileSystemAccessRuleArgumentList
# Apply new rule
$NewAcl.SetAccessRule($fileSystemAccessRule)
Set-Acl -Path "" -AclObject $NewAcl
```
## Collection configuration and app installation
import ConfigAppInstall from '../../../reuse/apps/opentelemetry/config-app-install.md';
### Step 1: Set up Collector
import SetupColl from '../../../reuse/apps/opentelemetry/set-up-collector.md';
 ### Step 2: Configure integration
In this step, you will configure the yaml file required for Memcached Collection. Path of the log file configured to capture Memcached logs needs to be given here.
The files are typically located in `/var/log/memcached/memcached.log`. If you're using a customized path, check the respective conf file (default location: `/etc/memcached.conf`) for this information.
For metrics, you're required to provide the Memcached endpoint (default is localhost:11211) along with the `collection_interval` (default is 1 minute).
You can add any custom fields which you want to tag along with the data ingested in Sumo. Click on the **Download YAML File** button to get the yaml file.
import CollectorVersionNote from '../../../reuse/apps/opentelemetry/collector-version-note.md';
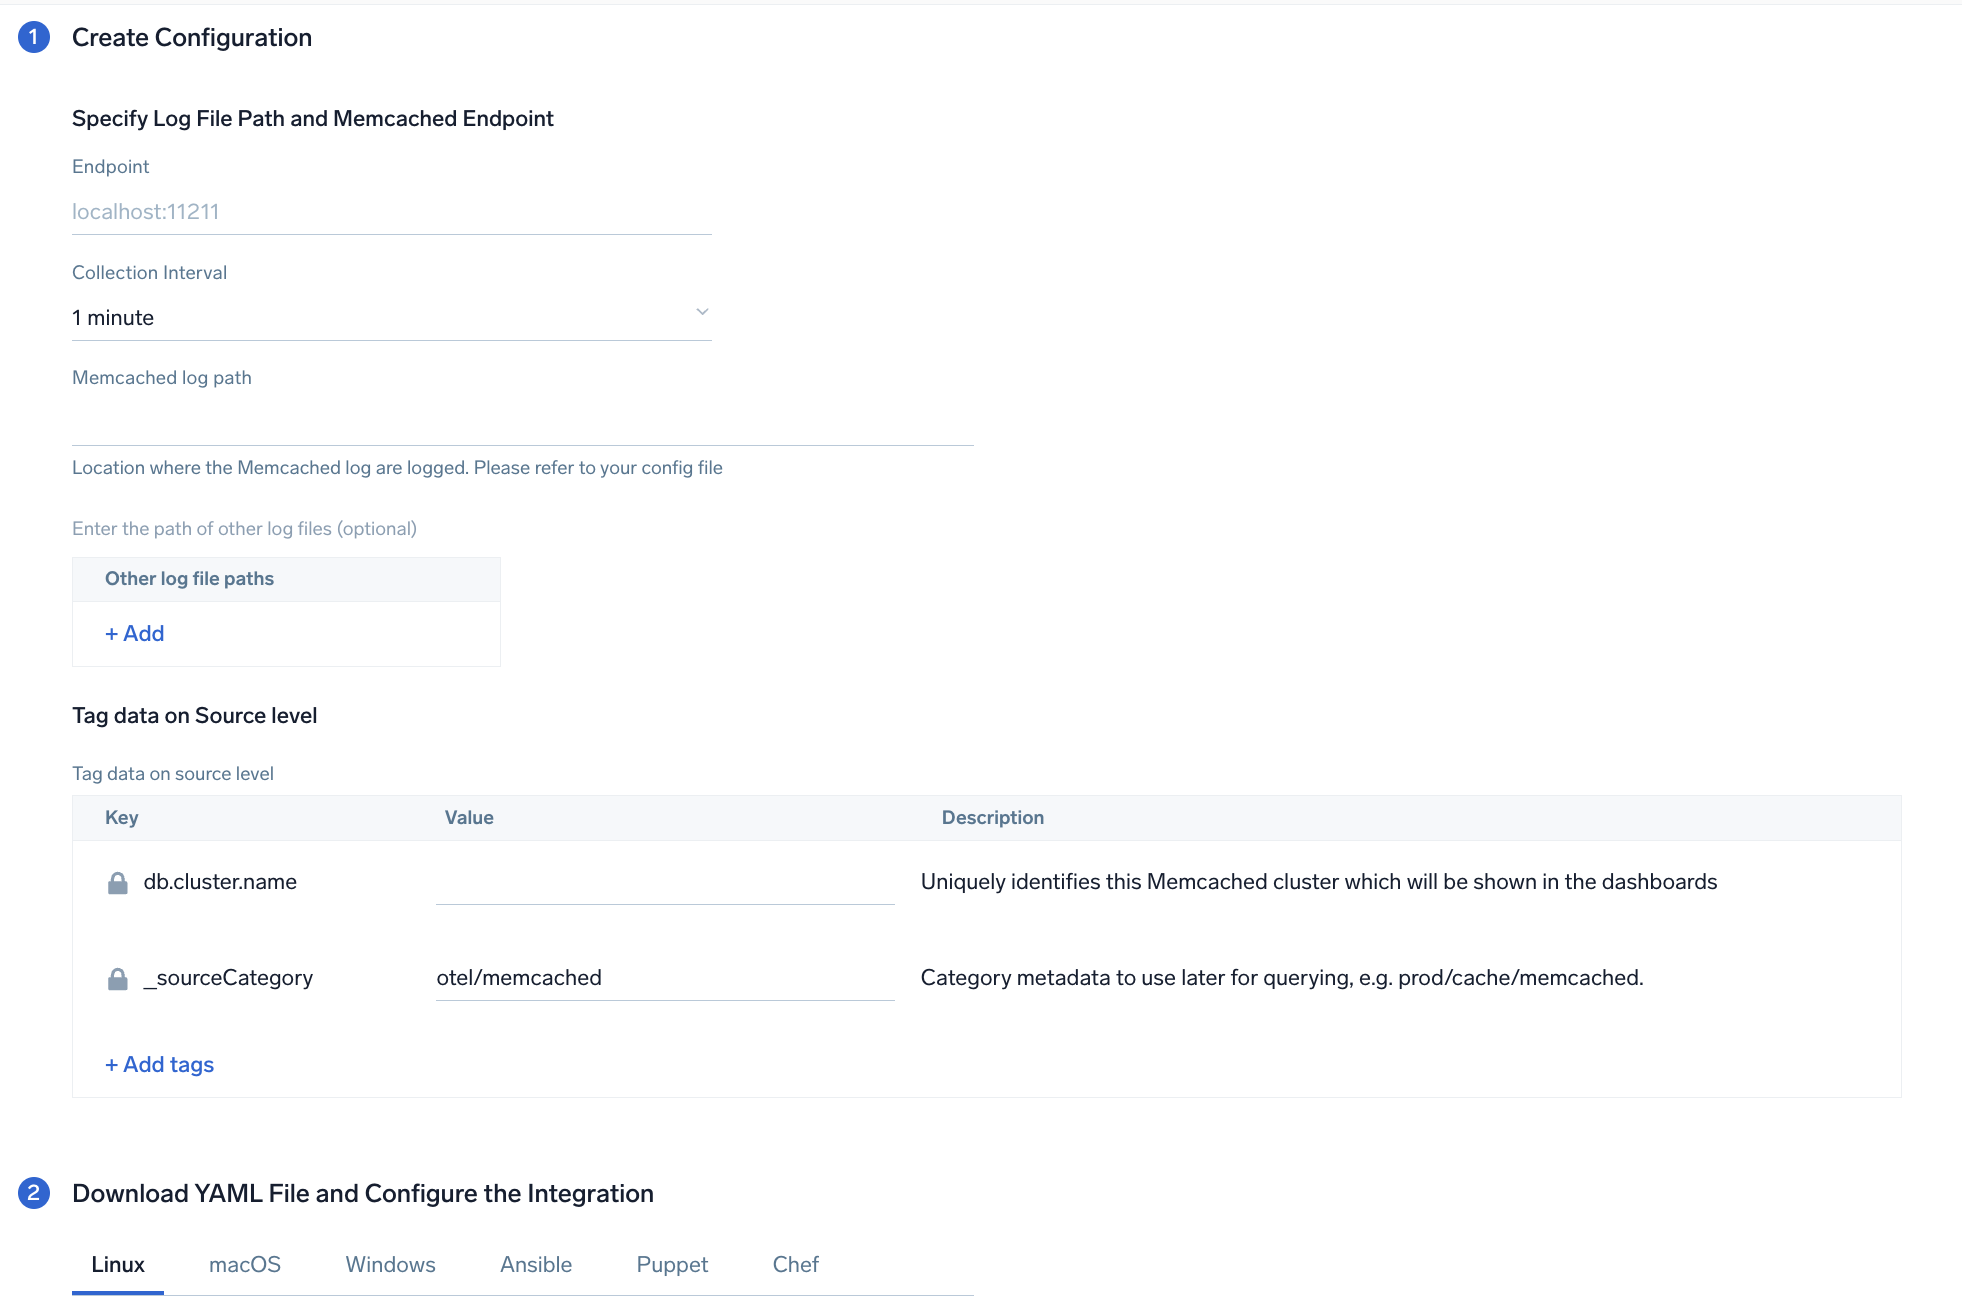
### Step 2: Configure integration
In this step, you will configure the yaml file required for Memcached Collection. Path of the log file configured to capture Memcached logs needs to be given here.
The files are typically located in `/var/log/memcached/memcached.log`. If you're using a customized path, check the respective conf file (default location: `/etc/memcached.conf`) for this information.
For metrics, you're required to provide the Memcached endpoint (default is localhost:11211) along with the `collection_interval` (default is 1 minute).
You can add any custom fields which you want to tag along with the data ingested in Sumo. Click on the **Download YAML File** button to get the yaml file.
import CollectorVersionNote from '../../../reuse/apps/opentelemetry/collector-version-note.md';
 ### Step 3: Send logs to Sumo Logic
import LogsIntro from '../../../reuse/apps/opentelemetry/send-logs-intro.md';
1. Copy the yaml file to `/etc/otelcol-sumo/conf.d/` folder in the Memcache instance which needs to be monitored.
2. Restart the collector using:
```sh
sudo systemctl restart otelcol-sumo
```
1. Copy the yaml file to `C:\ProgramData\Sumo Logic\OpenTelemetry Collector\config\conf.d` folder in the machine which needs to be monitored.
2. Restart the collector using:
```sh
Restart-Service -Name OtelcolSumo
```
1. Copy the yaml file to `/etc/otelcol-sumo/conf.d/` folder in the Memcache instance which needs to be monitored.
2. Restart the otelcol-sumo process using:
```sh
otelcol-sumo --config /etc/otelcol-sumo/sumologic.yaml --config "glob:/etc/otelcol-sumo/conf.d/*.yaml"
```
import ChefNoEnv from '../../../reuse/apps/opentelemetry/chef-without-env.md';
import AnsibleNoEnv from '../../../reuse/apps/opentelemetry/ansible-without-env.md';
import PuppetNoEnv from '../../../reuse/apps/opentelemetry/puppet-without-env.md';
import LogsOutro from '../../../reuse/apps/opentelemetry/send-logs-outro.md';
## Sample log messages
```
Jun 23 07:35:01 node03 memcached: \
<31 set GFcIh47CswfCnwk3JkmJ 0 0 4096
```
## Sample metric messages
```
{
"queryId": "A",
"_source": "memcached-otel",
"_metricId": "lU4jhUa6YoiLX9eJZGHHjA",
"_sourceName": "Http Input",
"host.id": "i-0cc7753247bad73ae",
"host.group": "memcachedlinux",
"os.type": "linux",
"sumo.datasource": "memcached",
"db.system": "memcached",
"command": "touch",
"db.node.name": "ip-172-31-64-180.ec2.internal",
"_sourceCategory": "Labs/memcached-otel",
"deployment.environment": "memcachedlinux",
"_contentType": "Carbon2",
"host.name": "ip-172-31-64-180.ec2.internal",
"metric": "memcached.commands",
"_collectorId": "000000000F90B095",
"_sourceId": "00000000594E7C3A",
"unit": "{commands}",
"db.cluster.name": "test",
"_collector": "Labs - memcached-otel",
"max": 10,
"min": 0,
"avg": 7,
"sum": 70,
"latest": 10,
"count": 10
}
```
## Sample logs queries
Following is the query from Errors panel of Memcached app's overview Dashboard:
```sumo
%"deployment.environment"=* %"db.cluster.name"=* %"sumo.datasource"=memcached memcached ">" ERROR | json "log" as _rawlog nodrop
| if (isEmpty(_rawlog), _raw, _rawlog) as memcached_log_message
| parse regex field=memcached_log_message ">(?\d+) (?\w+)"
| if(cmd matches "ERROR",1,0) as ERROR
| timeslice by 1h
| sum(ERROR) as ERROR by _timeslice
```
## Sample metrics queries
```sql title="Total Get"
sumo.datasource=memcached deployment.environment=* db.cluster.name=* db.node.name=* metric=memcached.commands command=get | sum
```
## Viewing the Memcached dashboards
### Overview
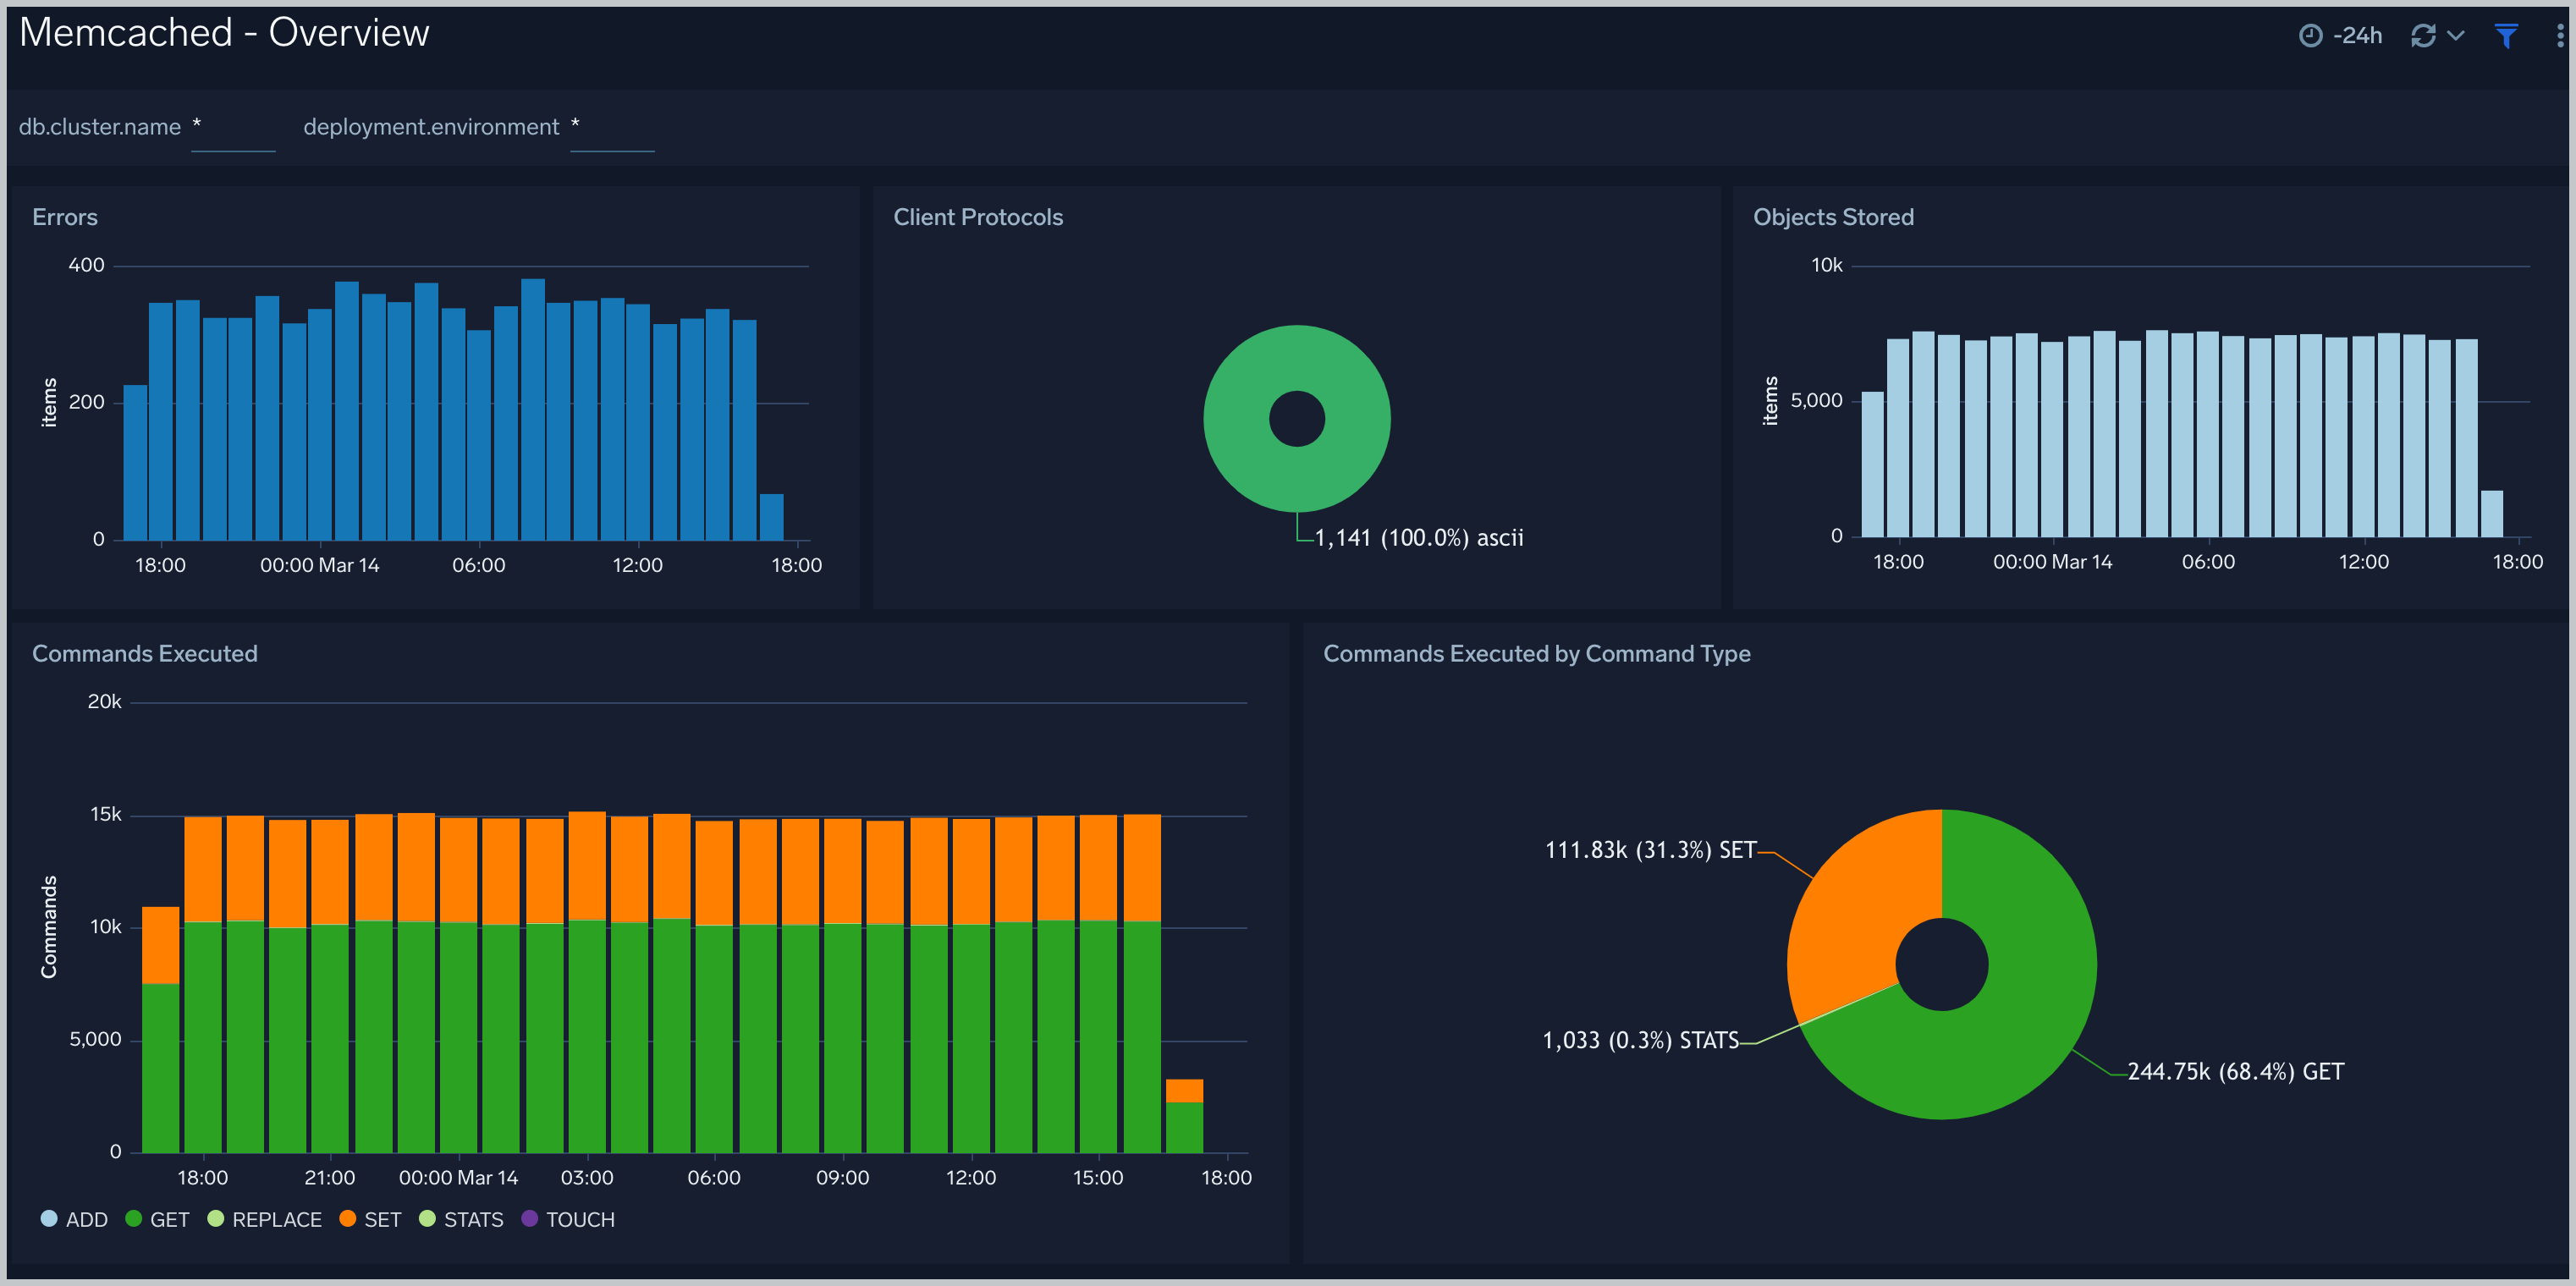
The **Memcached - Overview** dashboard provides an at-a-glance view of the Memcached server status, error logs, and database metrics.
### Step 3: Send logs to Sumo Logic
import LogsIntro from '../../../reuse/apps/opentelemetry/send-logs-intro.md';
1. Copy the yaml file to `/etc/otelcol-sumo/conf.d/` folder in the Memcache instance which needs to be monitored.
2. Restart the collector using:
```sh
sudo systemctl restart otelcol-sumo
```
1. Copy the yaml file to `C:\ProgramData\Sumo Logic\OpenTelemetry Collector\config\conf.d` folder in the machine which needs to be monitored.
2. Restart the collector using:
```sh
Restart-Service -Name OtelcolSumo
```
1. Copy the yaml file to `/etc/otelcol-sumo/conf.d/` folder in the Memcache instance which needs to be monitored.
2. Restart the otelcol-sumo process using:
```sh
otelcol-sumo --config /etc/otelcol-sumo/sumologic.yaml --config "glob:/etc/otelcol-sumo/conf.d/*.yaml"
```
import ChefNoEnv from '../../../reuse/apps/opentelemetry/chef-without-env.md';
import AnsibleNoEnv from '../../../reuse/apps/opentelemetry/ansible-without-env.md';
import PuppetNoEnv from '../../../reuse/apps/opentelemetry/puppet-without-env.md';
import LogsOutro from '../../../reuse/apps/opentelemetry/send-logs-outro.md';
## Sample log messages
```
Jun 23 07:35:01 node03 memcached: \
<31 set GFcIh47CswfCnwk3JkmJ 0 0 4096
```
## Sample metric messages
```
{
"queryId": "A",
"_source": "memcached-otel",
"_metricId": "lU4jhUa6YoiLX9eJZGHHjA",
"_sourceName": "Http Input",
"host.id": "i-0cc7753247bad73ae",
"host.group": "memcachedlinux",
"os.type": "linux",
"sumo.datasource": "memcached",
"db.system": "memcached",
"command": "touch",
"db.node.name": "ip-172-31-64-180.ec2.internal",
"_sourceCategory": "Labs/memcached-otel",
"deployment.environment": "memcachedlinux",
"_contentType": "Carbon2",
"host.name": "ip-172-31-64-180.ec2.internal",
"metric": "memcached.commands",
"_collectorId": "000000000F90B095",
"_sourceId": "00000000594E7C3A",
"unit": "{commands}",
"db.cluster.name": "test",
"_collector": "Labs - memcached-otel",
"max": 10,
"min": 0,
"avg": 7,
"sum": 70,
"latest": 10,
"count": 10
}
```
## Sample logs queries
Following is the query from Errors panel of Memcached app's overview Dashboard:
```sumo
%"deployment.environment"=* %"db.cluster.name"=* %"sumo.datasource"=memcached memcached ">" ERROR | json "log" as _rawlog nodrop
| if (isEmpty(_rawlog), _raw, _rawlog) as memcached_log_message
| parse regex field=memcached_log_message ">(?\d+) (?\w+)"
| if(cmd matches "ERROR",1,0) as ERROR
| timeslice by 1h
| sum(ERROR) as ERROR by _timeslice
```
## Sample metrics queries
```sql title="Total Get"
sumo.datasource=memcached deployment.environment=* db.cluster.name=* db.node.name=* metric=memcached.commands command=get | sum
```
## Viewing the Memcached dashboards
### Overview
The **Memcached - Overview** dashboard provides an at-a-glance view of the Memcached server status, error logs, and database metrics.
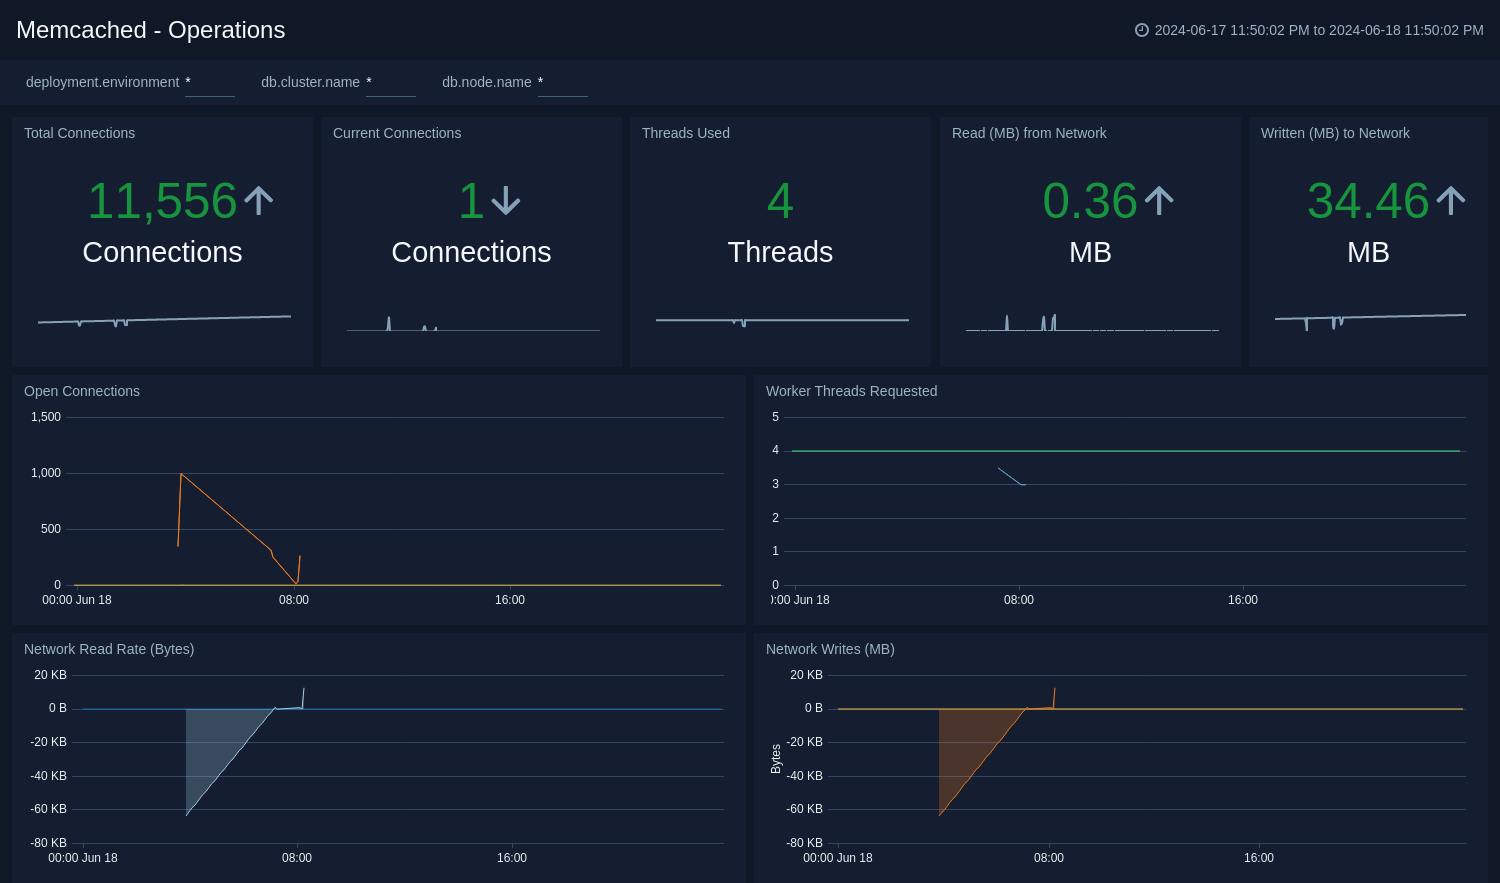
 ### Operations
The **Memcached - Operations** Dashboard provides detailed analysis on connections, thread requested, network bytes, and table size.
### Operations
The **Memcached - Operations** Dashboard provides detailed analysis on connections, thread requested, network bytes, and table size.
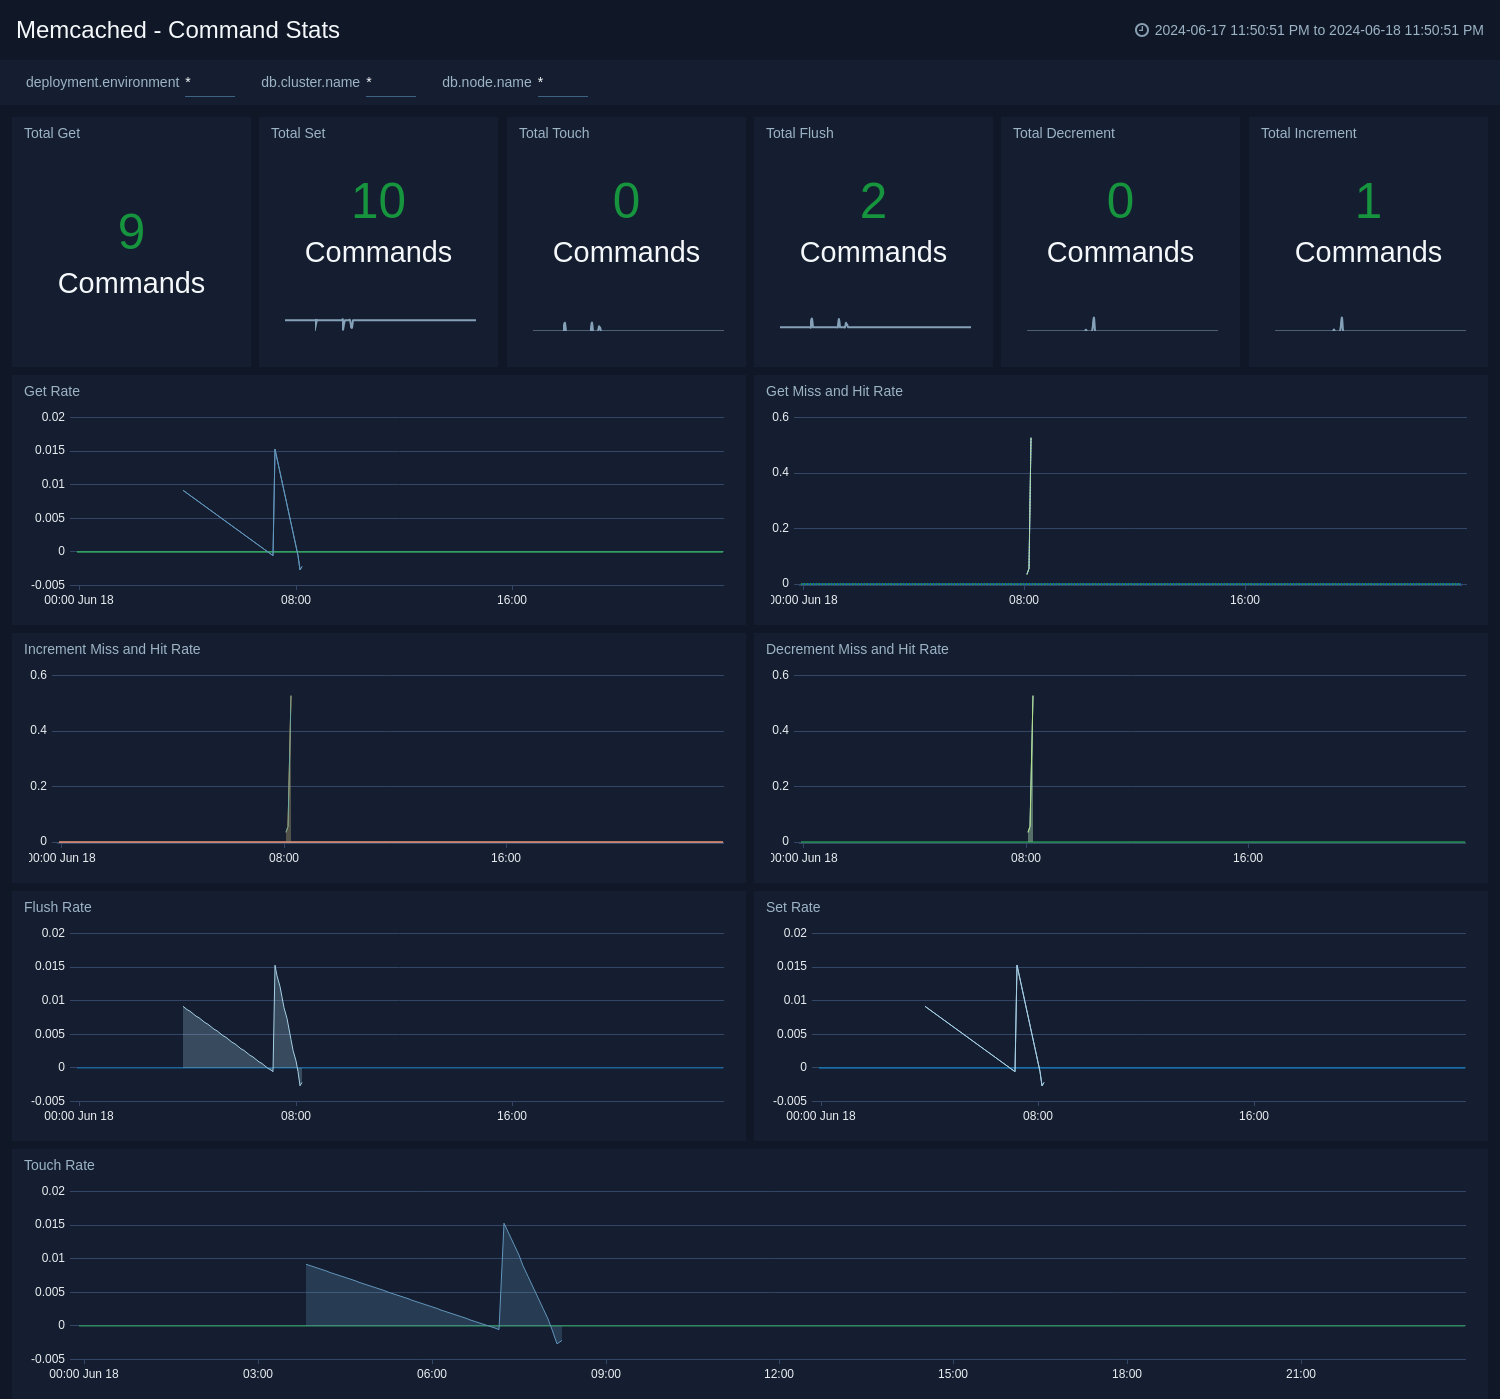
 ### Command Stats
The **Memcached - Command Stats** dashboard provides detailed insights into the number of commands being performed.
### Command Stats
The **Memcached - Command Stats** dashboard provides detailed insights into the number of commands being performed.
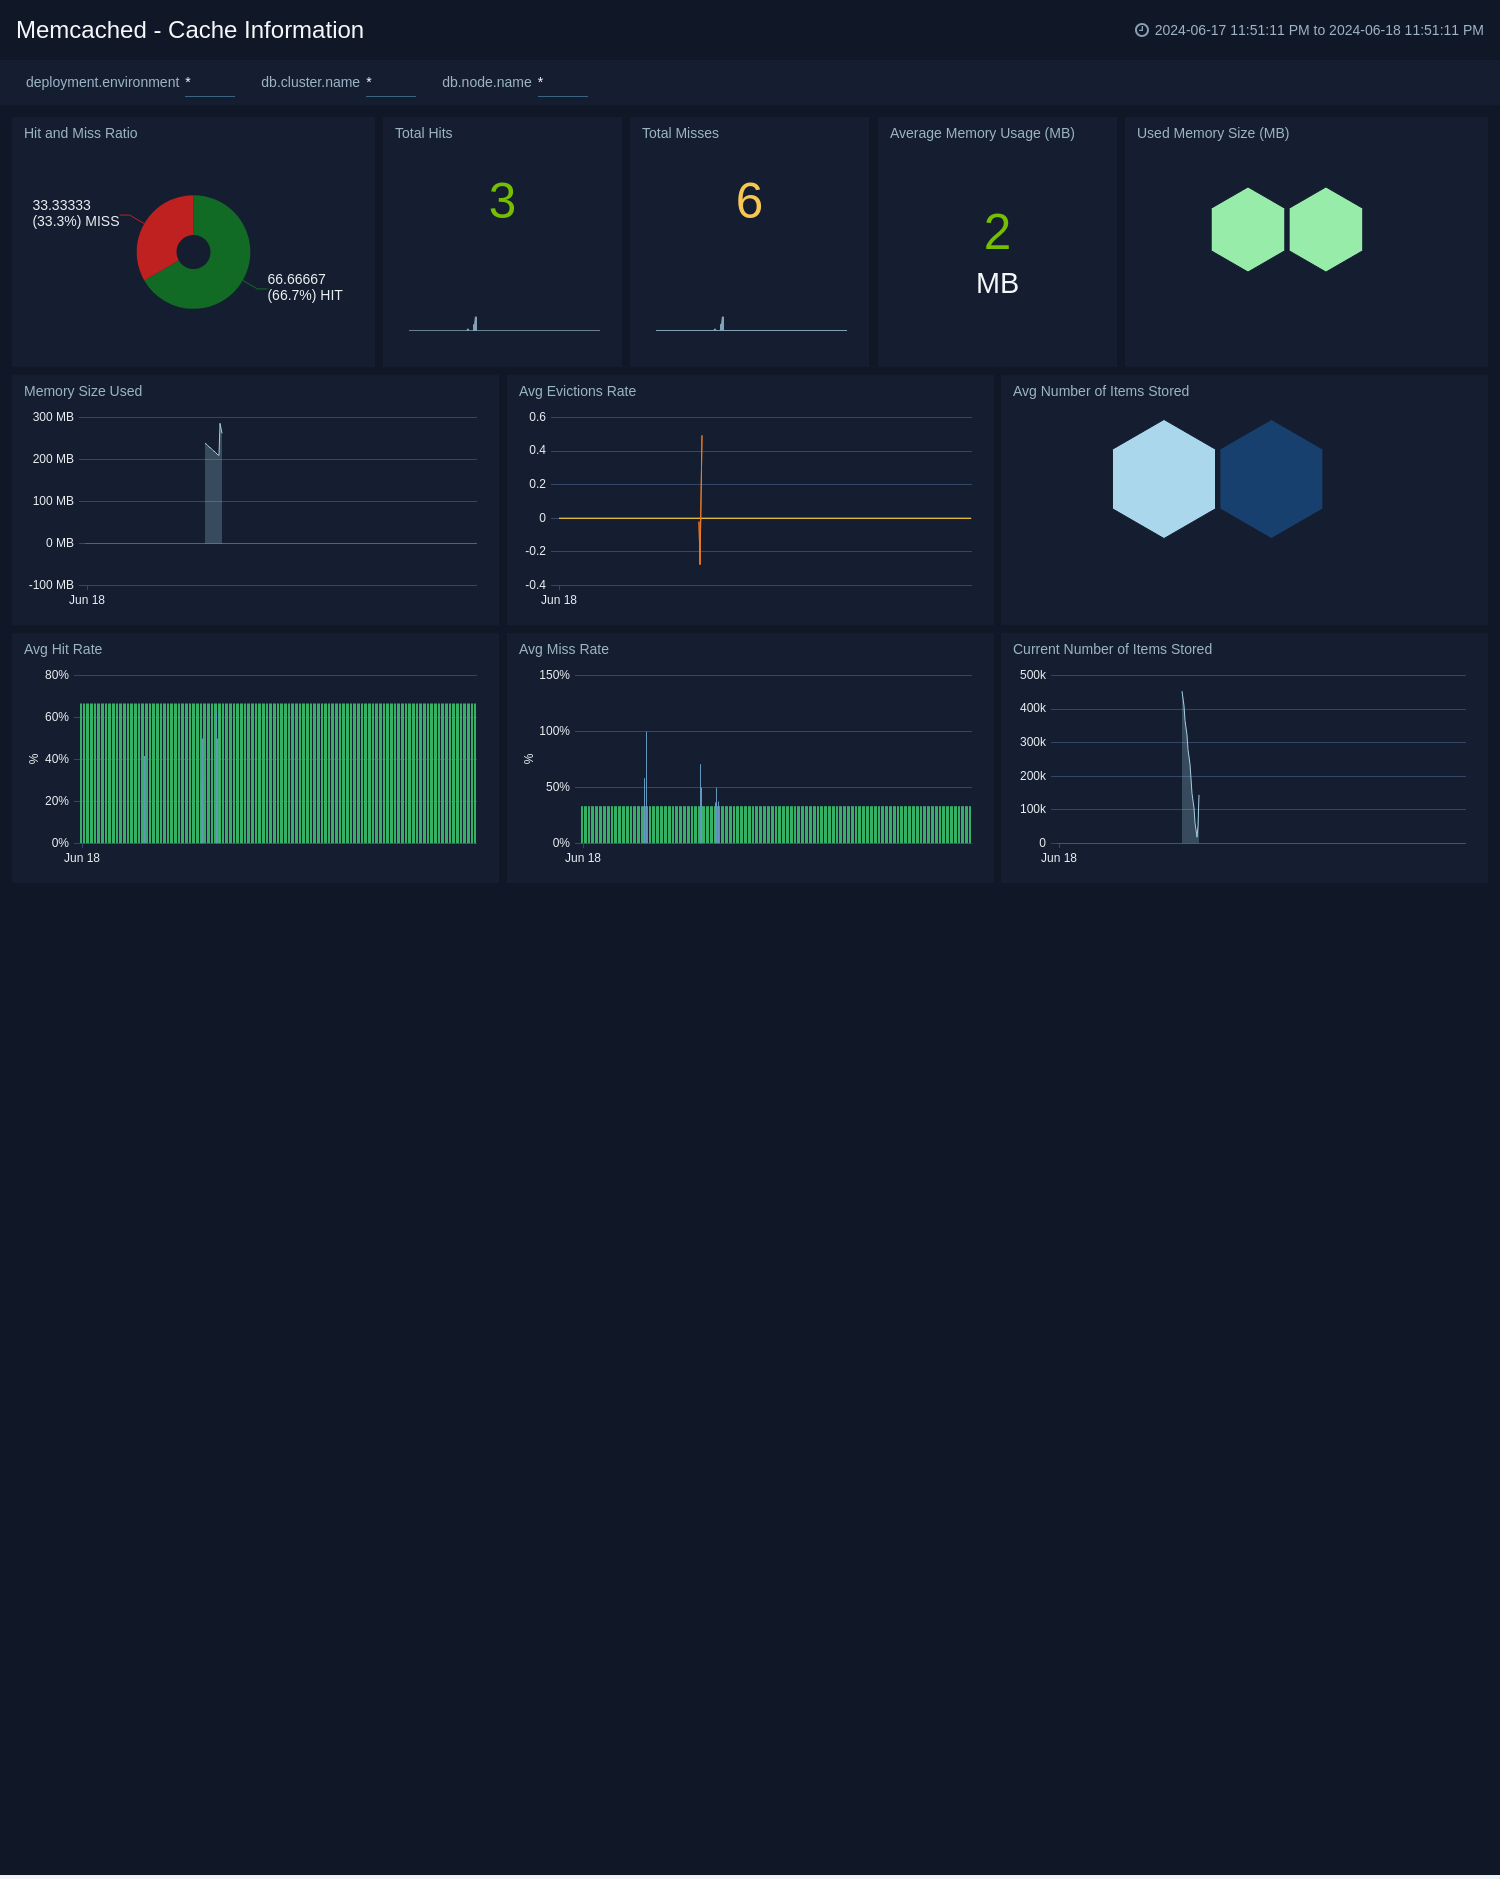
 ### Cache Information
The **Memcached - Cache Information** dashboard provides insight into cache states, cache hit, and miss rate over time.
### Cache Information
The **Memcached - Cache Information** dashboard provides insight into cache states, cache hit, and miss rate over time.
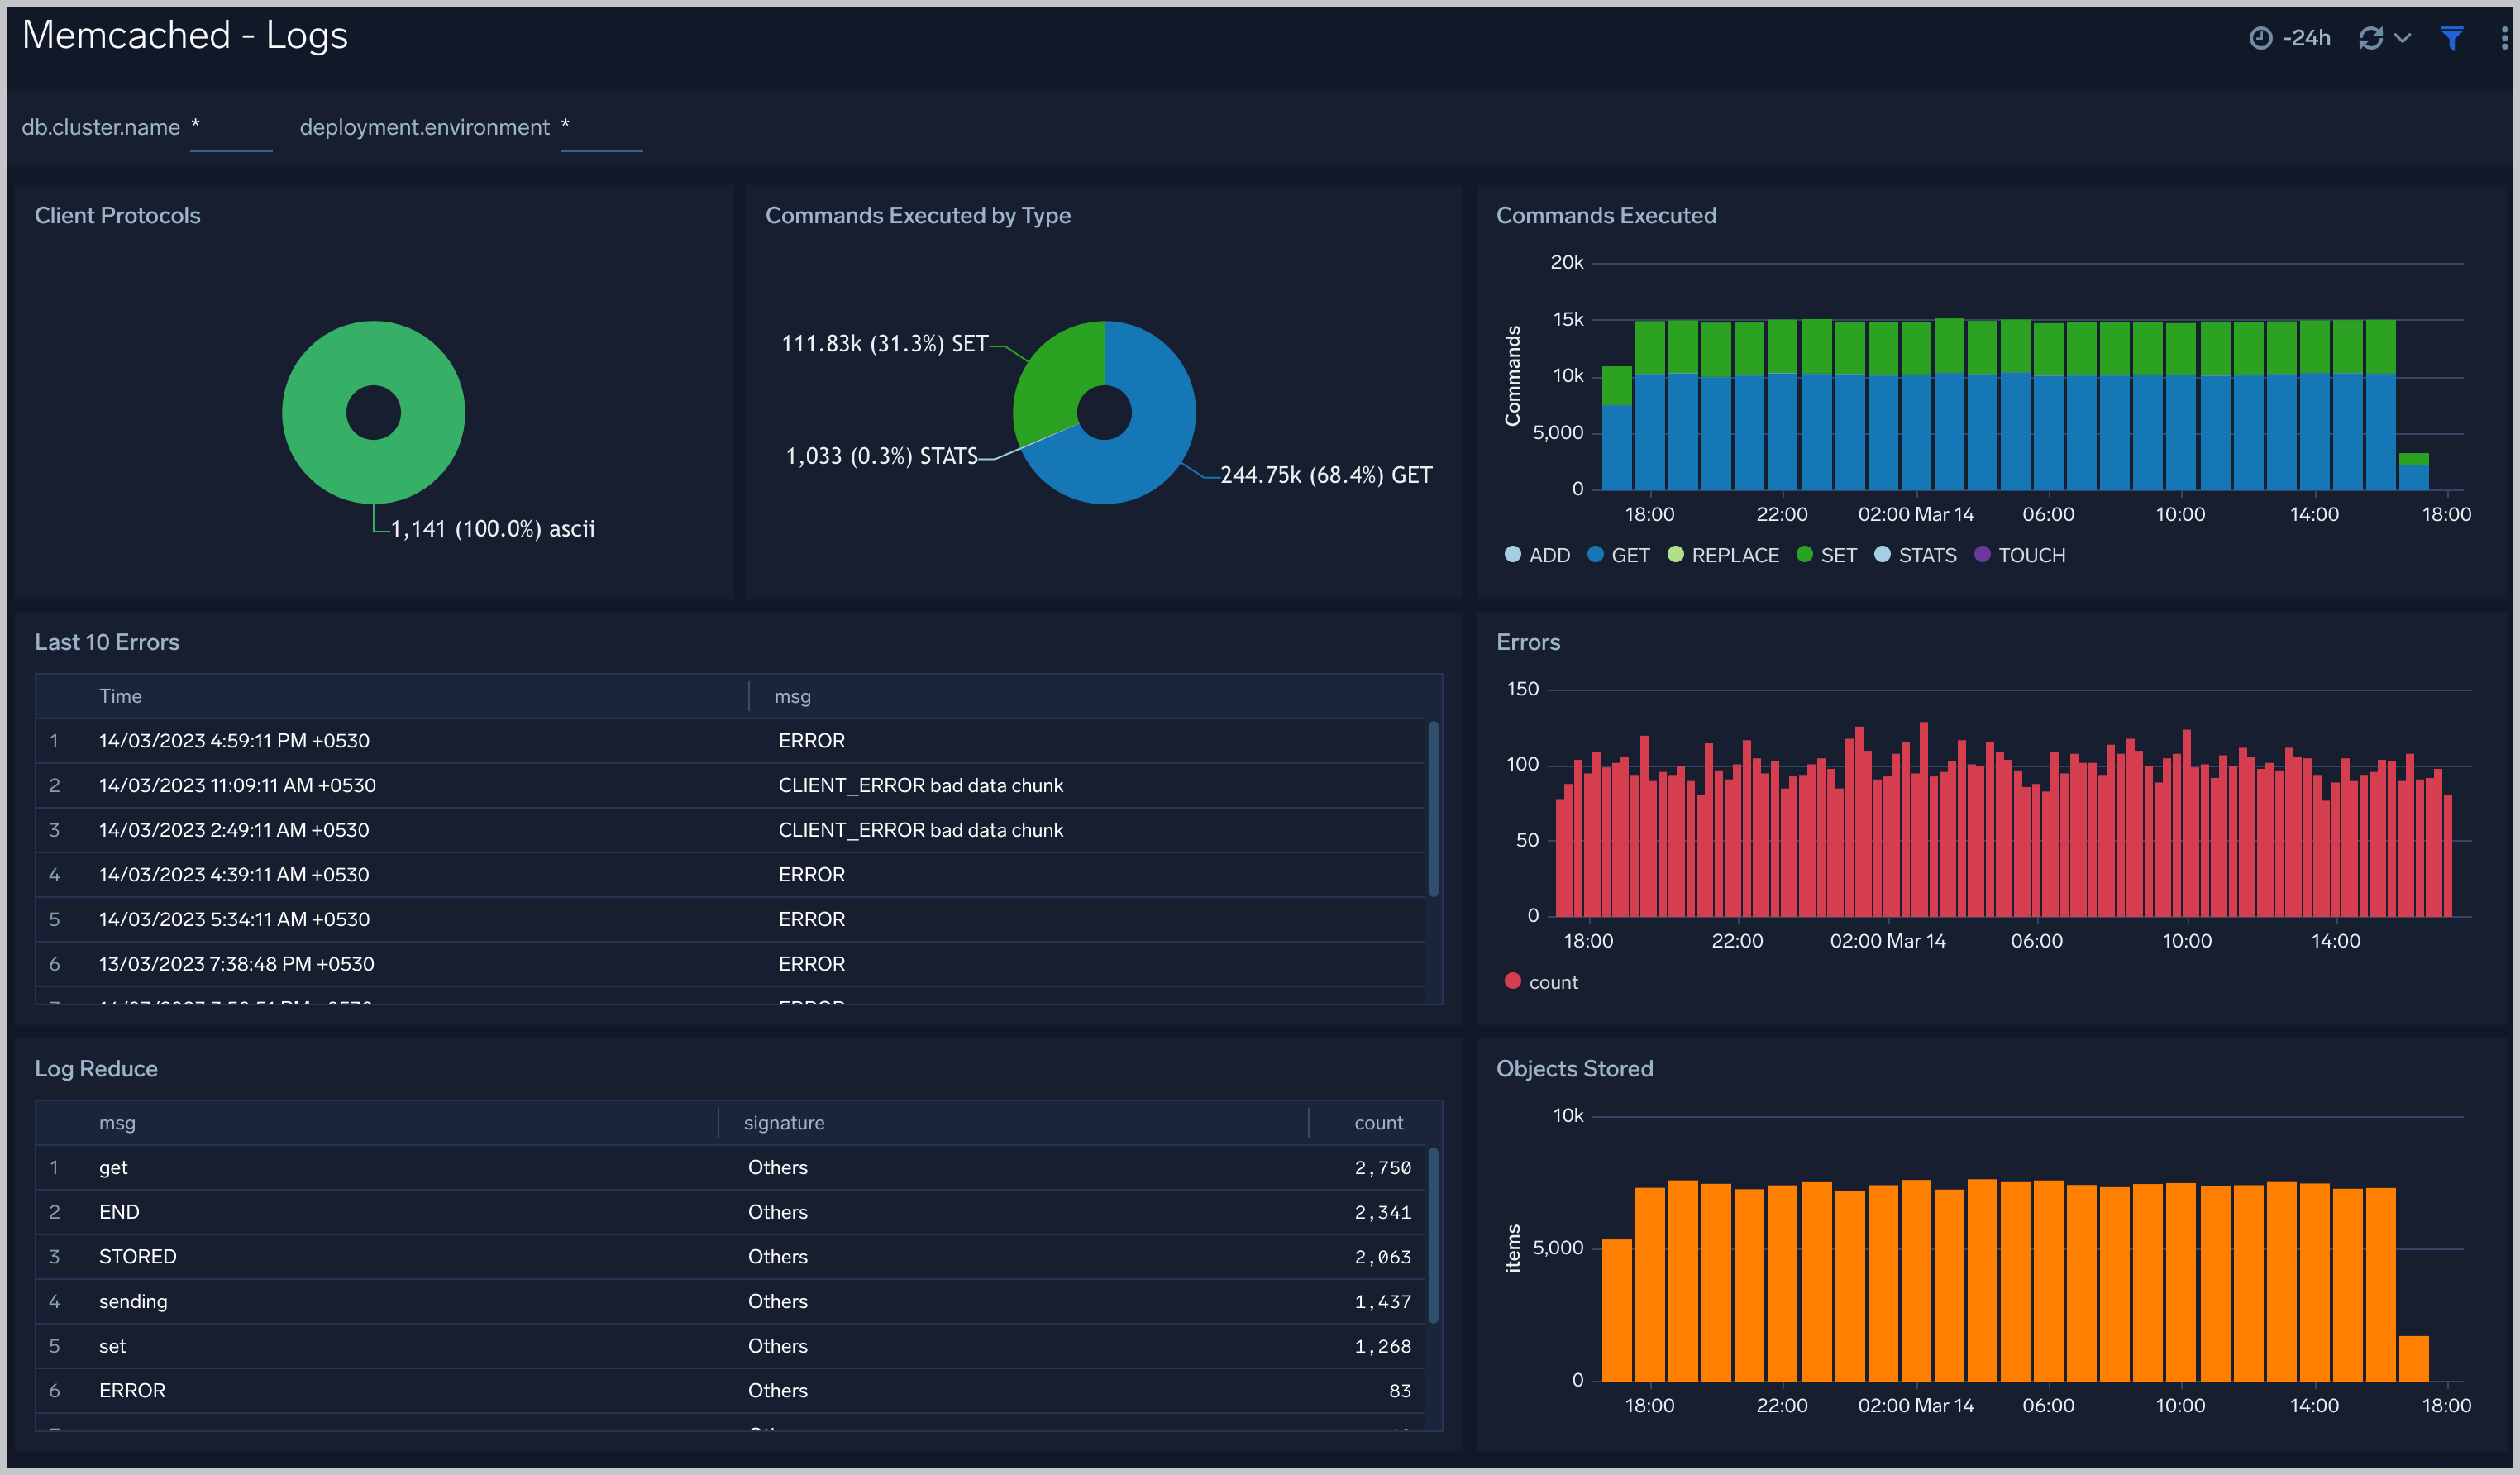
 ### Logs
The **Memcached - Logs** dashboard helps you quickly analyze your Memcached error logs, commands executed, and objects stored.
### Logs
The **Memcached - Logs** dashboard helps you quickly analyze your Memcached error logs, commands executed, and objects stored.
 ## Create monitors for Memcached app
import CreateMonitors from '../../../reuse/apps/create-monitors.md';
### Memcached alerts
| Name | Description | Alert Condition | Recover Condition |
|:--|:--|:--|:--|
| `Memcached - Cache Hit Ratio` | This alert is triggered when low cache hit ratio is less than 50%. The hit rate is one of the most important indicators of Memcached performance. A high hit rate means faster responses to your users. If the hit rate is falling, you need quick visibility into why. | Count < = 50% | Count > 50% |
| `Memcached - Commands Error` | This alert is triggered when Memcached has error commands. | Count > 0 | Count < = 0 |
| `Memcached - Current Connections` | This alert is triggered when current connections to Memcached are zero. | Count < = 0 | Count > 0 |
| `Memcached - High Memory Usage` | This alert is triggered when the Memcached exceed given threshold memory usage (in GB). | Count > 5 | Count < = 5 |
| `Memcached - High Number of Connections` | This alert is triggered when the number of current connection for Memcached exceed given threshold. | Count > = 1000 | Count < 1000 |
## Create monitors for Memcached app
import CreateMonitors from '../../../reuse/apps/create-monitors.md';
### Memcached alerts
| Name | Description | Alert Condition | Recover Condition |
|:--|:--|:--|:--|
| `Memcached - Cache Hit Ratio` | This alert is triggered when low cache hit ratio is less than 50%. The hit rate is one of the most important indicators of Memcached performance. A high hit rate means faster responses to your users. If the hit rate is falling, you need quick visibility into why. | Count < = 50% | Count > 50% |
| `Memcached - Commands Error` | This alert is triggered when Memcached has error commands. | Count > 0 | Count < = 0 |
| `Memcached - Current Connections` | This alert is triggered when current connections to Memcached are zero. | Count < = 0 | Count > 0 |
| `Memcached - High Memory Usage` | This alert is triggered when the Memcached exceed given threshold memory usage (in GB). | Count > 5 | Count < = 5 |
| `Memcached - High Number of Connections` | This alert is triggered when the number of current connection for Memcached exceed given threshold. | Count > = 1000 | Count < 1000 |