---
id: mongodb-opentelemetry
title: MongoDB - OpenTelemetry Collector
sidebar_label: MongoDB - OTel Collector
description: Learn about the Sumo Logic OpenTelemetry app for MongoDB.
slug: /help/docs/integrations/databases/opentelemetry/mongodb-opentelemetry/
canonical: https://www.sumologic.com/help/docs/integrations/databases/opentelemetry/mongodb-opentelemetry/
---
import useBaseUrl from '@docusaurus/useBaseUrl';
import Tabs from '@theme/Tabs';
import TabItem from '@theme/TabItem';
})
}) [MongoDB](https://www.mongodb.com/why-use-mongodb#:~:text=MongoDB%20is%20a%20document%20database,development%20teams%20using%20agile%20methodologies.) is a source-available cross-platform document-oriented database program. The Sumo Logic app for MongoDB supports logs and metrics from the open source version of MongoDB. The app is tested on the 7.0.14 version of MongoDB.
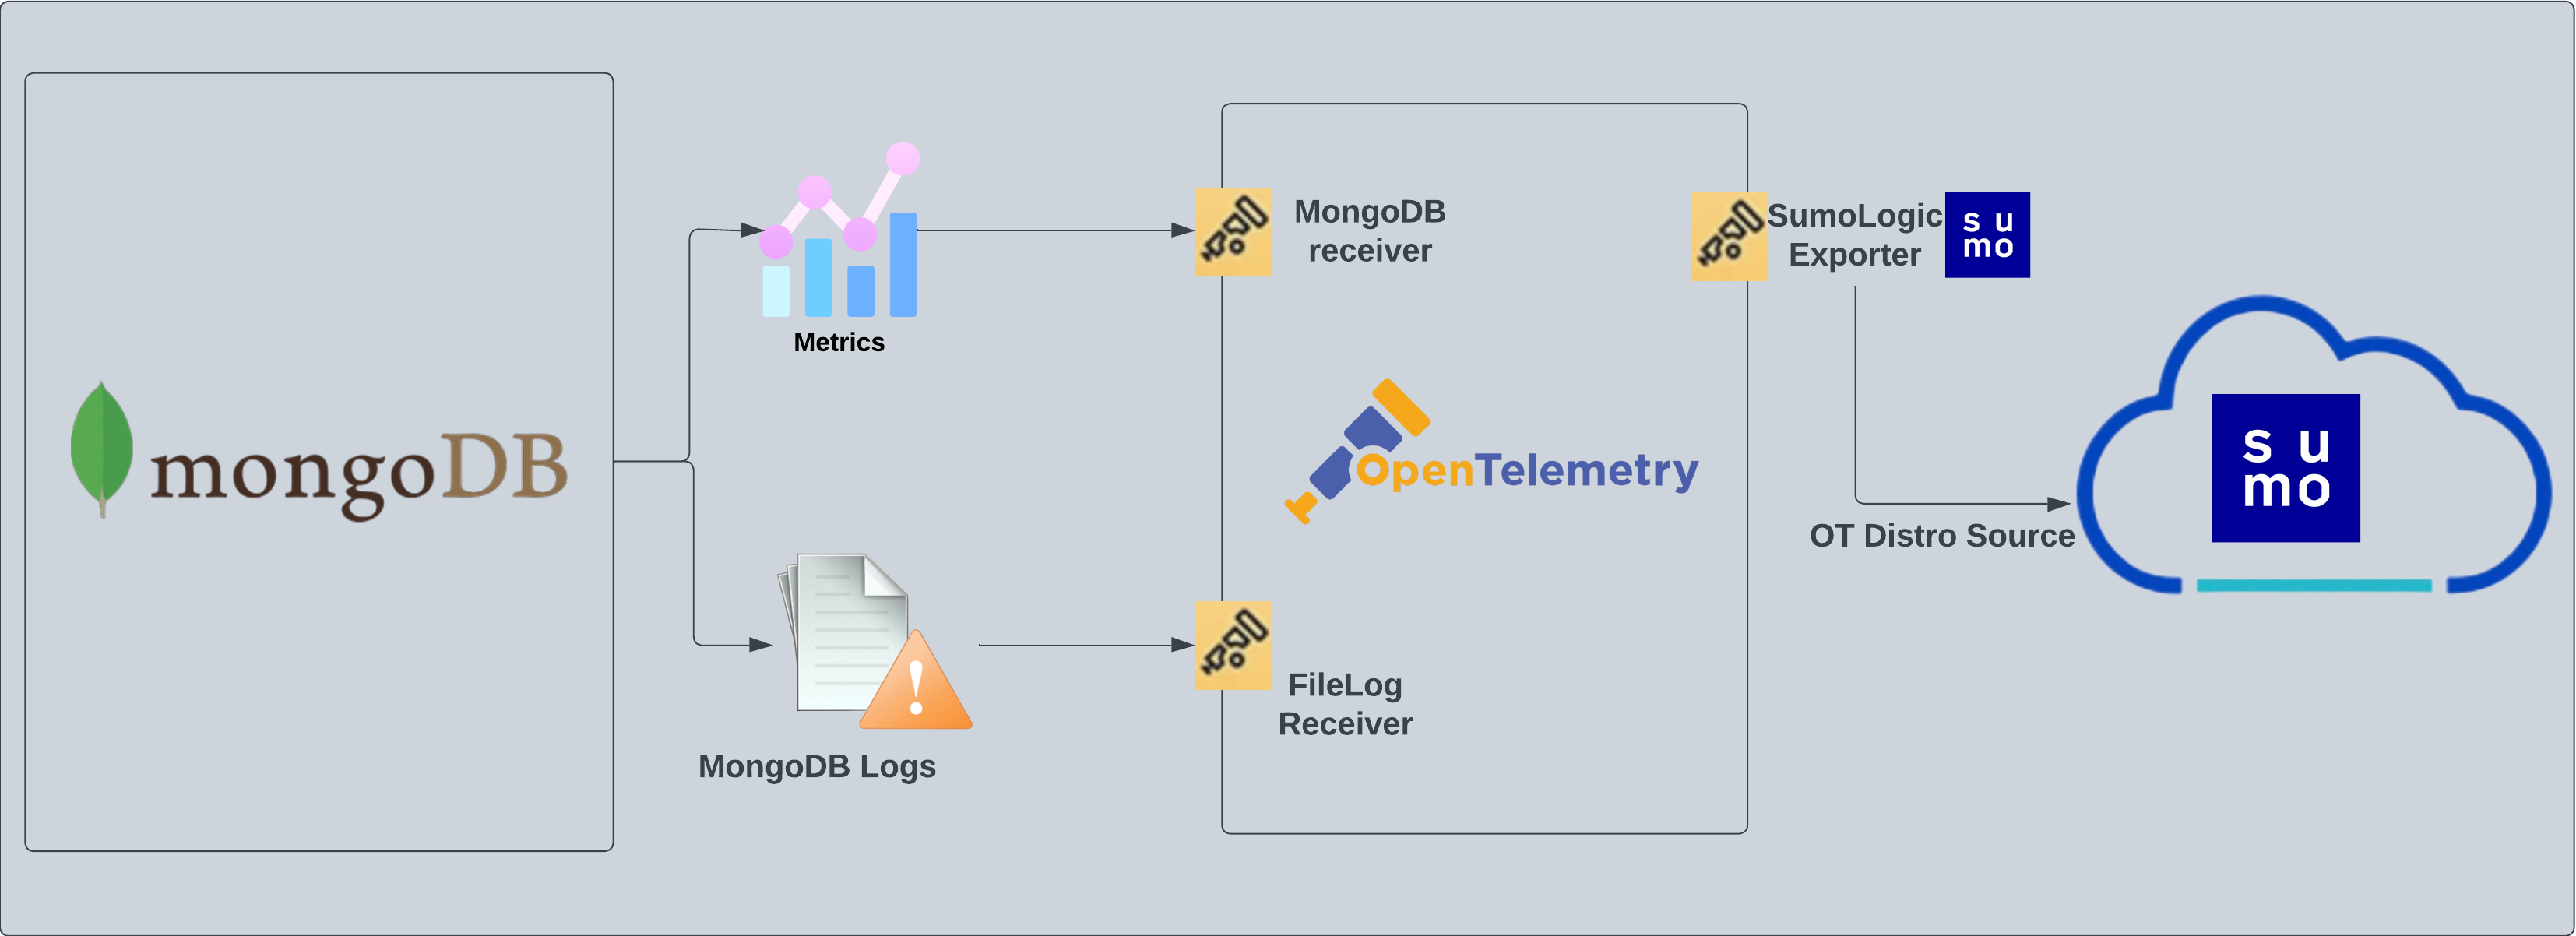
MongoDB logs are sent to Sumo Logic through OpenTelemetry [filelog receiver](https://github.com/open-telemetry/opentelemetry-collector-contrib/tree/main/receiver/filelogreceiver). The OpenTelemetry collector runs on the same host as MongoDB and uses the [MongoDB Receiver](https://github.com/open-telemetry/opentelemetry-collector-contrib/tree/main/receiver/mongodbreceiver) and the [Sumo Logic OpenTelemetry Exporter](https://github.com/open-telemetry/opentelemetry-collector-contrib/tree/main/exporter/sumologicexporter) to send the metrics to Sumo Logic.
[MongoDB](https://www.mongodb.com/why-use-mongodb#:~:text=MongoDB%20is%20a%20document%20database,development%20teams%20using%20agile%20methodologies.) is a source-available cross-platform document-oriented database program. The Sumo Logic app for MongoDB supports logs and metrics from the open source version of MongoDB. The app is tested on the 7.0.14 version of MongoDB.
MongoDB logs are sent to Sumo Logic through OpenTelemetry [filelog receiver](https://github.com/open-telemetry/opentelemetry-collector-contrib/tree/main/receiver/filelogreceiver). The OpenTelemetry collector runs on the same host as MongoDB and uses the [MongoDB Receiver](https://github.com/open-telemetry/opentelemetry-collector-contrib/tree/main/receiver/mongodbreceiver) and the [Sumo Logic OpenTelemetry Exporter](https://github.com/open-telemetry/opentelemetry-collector-contrib/tree/main/exporter/sumologicexporter) to send the metrics to Sumo Logic.
 ## Log and metrics types
This app supports logs and metrics for MongoDB instance. The MongoDB logs are generated in files as configured in this configuration file `/var/log/mongodb/mongodb.log`. For more details on MongoDB logs, refer to the [MongoDB documentation](https://docs.mongodb.com/manual/reference/log-messages/).
The app supports metrics generated by the [MongoDB Receiver](https://github.com/open-telemetry/opentelemetry-collector-contrib/blob/main/receiver/mongodbreceiver/documentation.md).
:::info
This app includes [built-in monitors](#mongodb-alerts). For details on creating custom monitors, refer to the [Create monitors for MongoDB app](#create-monitors-for-mongodb-app).
:::
## Fields creation in Sumo Logic for MongoDB
Following are the [Fields](/docs/manage/fields/) which will be created as part of MongoDB App install if not already present.
- **`db.cluster.name`**. User configured. Enter a name to identify this MongoDb cluster. This cluster name will be shown in the Sumo Logic dashboards.
- **`db.system`**. Has fixed value of **mongodb**.
- **`deployment.environment`**. User configured. This is the deployment environment where the Mongodb cluster resides. For example: dev, prod, or qa.
- **`sumo.datasource`**. has a fixed value of **mongodb**.
* **`db.node.name`**. Has the value of host name of the machine which is being monitored.
## Prerequisites
### For metrics collection
The MongoDB receiver fetches stats from a MongoDB instance using the [golang mongo driver](https://github.com/mongodb/mongo-go-driver). Stats are collected via MongoDB's `dbStats`, `serverStatus`, and `top` commands. The MongoDB receiver extracts values from the result and converts them to OpenTelemetry metrics.
### For logs collection
By default, MongoDB logs are stored in a log file.
1. Configure logging verbosity in MongoDB.
## Log and metrics types
This app supports logs and metrics for MongoDB instance. The MongoDB logs are generated in files as configured in this configuration file `/var/log/mongodb/mongodb.log`. For more details on MongoDB logs, refer to the [MongoDB documentation](https://docs.mongodb.com/manual/reference/log-messages/).
The app supports metrics generated by the [MongoDB Receiver](https://github.com/open-telemetry/opentelemetry-collector-contrib/blob/main/receiver/mongodbreceiver/documentation.md).
:::info
This app includes [built-in monitors](#mongodb-alerts). For details on creating custom monitors, refer to the [Create monitors for MongoDB app](#create-monitors-for-mongodb-app).
:::
## Fields creation in Sumo Logic for MongoDB
Following are the [Fields](/docs/manage/fields/) which will be created as part of MongoDB App install if not already present.
- **`db.cluster.name`**. User configured. Enter a name to identify this MongoDb cluster. This cluster name will be shown in the Sumo Logic dashboards.
- **`db.system`**. Has fixed value of **mongodb**.
- **`deployment.environment`**. User configured. This is the deployment environment where the Mongodb cluster resides. For example: dev, prod, or qa.
- **`sumo.datasource`**. has a fixed value of **mongodb**.
* **`db.node.name`**. Has the value of host name of the machine which is being monitored.
## Prerequisites
### For metrics collection
The MongoDB receiver fetches stats from a MongoDB instance using the [golang mongo driver](https://github.com/mongodb/mongo-go-driver). Stats are collected via MongoDB's `dbStats`, `serverStatus`, and `top` commands. The MongoDB receiver extracts values from the result and converts them to OpenTelemetry metrics.
### For logs collection
By default, MongoDB logs are stored in a log file.
1. Configure logging verbosity in MongoDB.
MongoDB logs have six levels of verbosity. All logging settings are located in [MongoDB.conf](https://docs.mongodb.com/manual/reference/method/db.setLogLevel/). To select a level, set loglevel to one of:
- 0 is the MongoDB's default log verbosity level, to include [Informational](https://docs.mongodb.com/manual/reference/log-messages/#std-label-log-severity-levels) messages.
- 1 to 5 increases the verbosity level to include[ Debug](https://docs.mongodb.com/manual/reference/log-messages/#std-label-log-severity-levels) messages.
2. You need to set the [profiling_level](https://www.mongodb.com/docs/manual/reference/method/db.setProfilingLevel/) to a value of 1.
But by default it is set to 0. You can also configure the value of [slowms](https://www.mongodb.com/docs/manual/reference/method/db.setProfilingLevel/#std-label-set-profiling-level-options-slowms) to a value greater than or equal to 100. Thus can be done using the below command in mongosh:
`db.setProfilingLevel(1,100)`
3. Configure MongoDB to log to a local file.
By default, MongoDB logs are stored in `/var/log/mongodb/mongodb.log`. The default directory for log files is listed in the `MongoDB.conf` file. To configure the log output destination to a log file, use one of the following settings, either in the [configuration file](https://docs.mongodb.com/manual/reference/configuration-options/) or command-line:
- Configuration file: The [systemLog.destination](https://docs.mongodb.com/manual/reference/configuration-options/#mongodb-setting-systemLog.destination) option for file.
- Command-line:
- The [--logpath](https://docs.mongodb.com/manual/reference/program/mongod/#std-option-mongod.--logpath) option for [mongod](https://docs.mongodb.com/manual/reference/program/mongod/#mongodb-binary-bin.mongod) for file.
- The [--logpath](https://docs.mongodb.com/manual/reference/program/mongos/#std-option-mongos.--logpath) option for [mongos](https://docs.mongodb.com/manual/reference/program/mongos/#mongodb-binary-bin.mongos) for file.
import LogsCollectionPrereqisites from '../../../reuse/apps/logs-collection-prereqisites.md';
For Windows systems, log files which are collected should be accessible by the SYSTEM group. Use the following set of PowerShell commands if the SYSTEM group does not have access.
```
$NewAcl = Get-Acl -Path ""
# Set properties
$identity = "NT AUTHORITY\SYSTEM"
$fileSystemRights = "ReadAndExecute"
$type = "Allow"
# Create new rule
$fileSystemAccessRuleArgumentList = $identity, $fileSystemRights, $type
$fileSystemAccessRule = New-Object -TypeName System.Security.AccessControl.FileSystemAccessRule -ArgumentList $fileSystemAccessRuleArgumentList
# Apply new rule
$NewAcl.SetAccessRule($fileSystemAccessRule)
Set-Acl -Path "" -AclObject $NewAcl
```
## Collection configuration and app installation
import ConfigAppInstall from '../../../reuse/apps/opentelemetry/config-app-install.md';
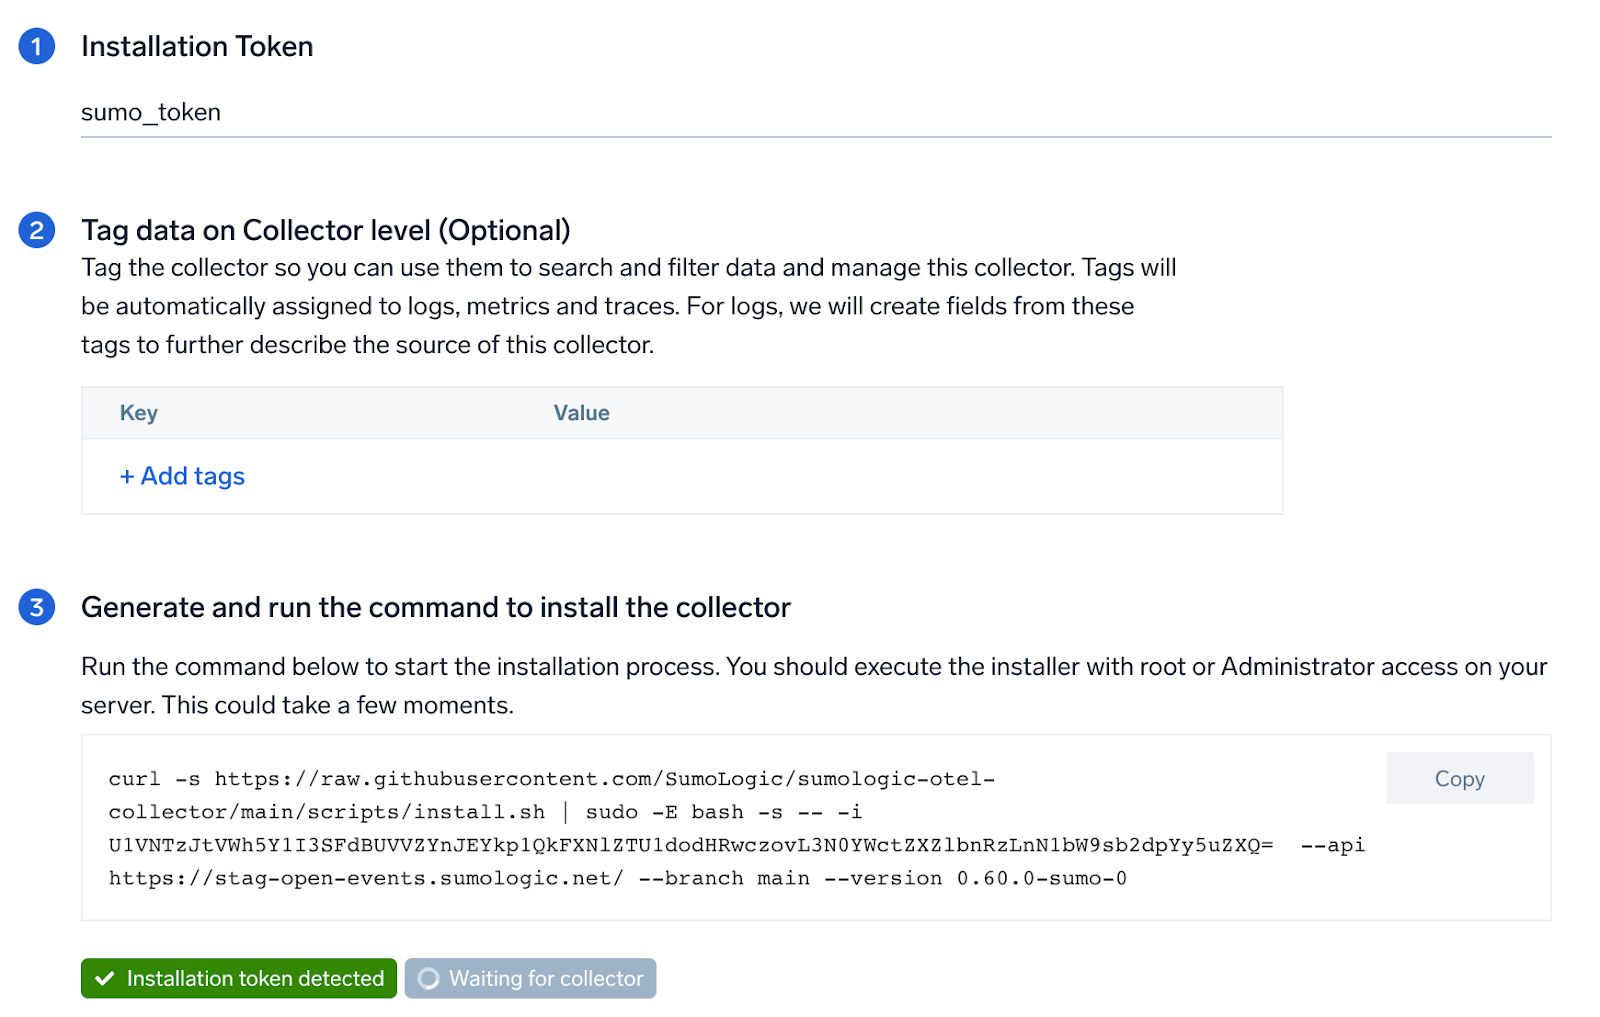
### Step 1: Set up Collector
import SetupColl from '../../../reuse/apps/opentelemetry/set-up-collector.md';
 ### Step 2: Configure integration
OpenTelemetry works with a [configuration](https://opentelemetry.io/docs/collector/configuration/) YAML file with all the details concerning the data that needs to be collected. For example, it specifies the location of a log file that is read and sent to the Sumo Logic platform.
In this step, you will configure the YAML file required for MongoDB collection.
Below are the inputs required:
- **`Endpoint (no default)`**. The hostname and port of the MognoDB instance, separated by a colon. This is required to scrap metrics. (For example: `localhost:27017`.)
:::note
For collecting metrics, *only* use the `mongod` endpoint. The Sumo Logic OpenTelemetry collector *does not* support the `mongos` endpoint.
:::
- **`Logs Path`**. Provide the path to the mongo db log file configured as part of above steps. Typically the logs are located at the location: `/var/log/mongodb/mongodb.log`.
- **`username (optional)`**. If authentication is required, the user can with clusterMonitor permissions can be provided here.
- **`password (optional)`**. If authentication is required, the password can be provided here.
You can add any custom fields which you want to tag along with the data ingested in Sumo. Click on the **Download YAML File** button to get the YAML file.
import CollectorVersionNote from '../../../reuse/apps/opentelemetry/collector-version-note.md';
import EnvVar from '../../../reuse/apps/opentelemetry/env-var-required.md';
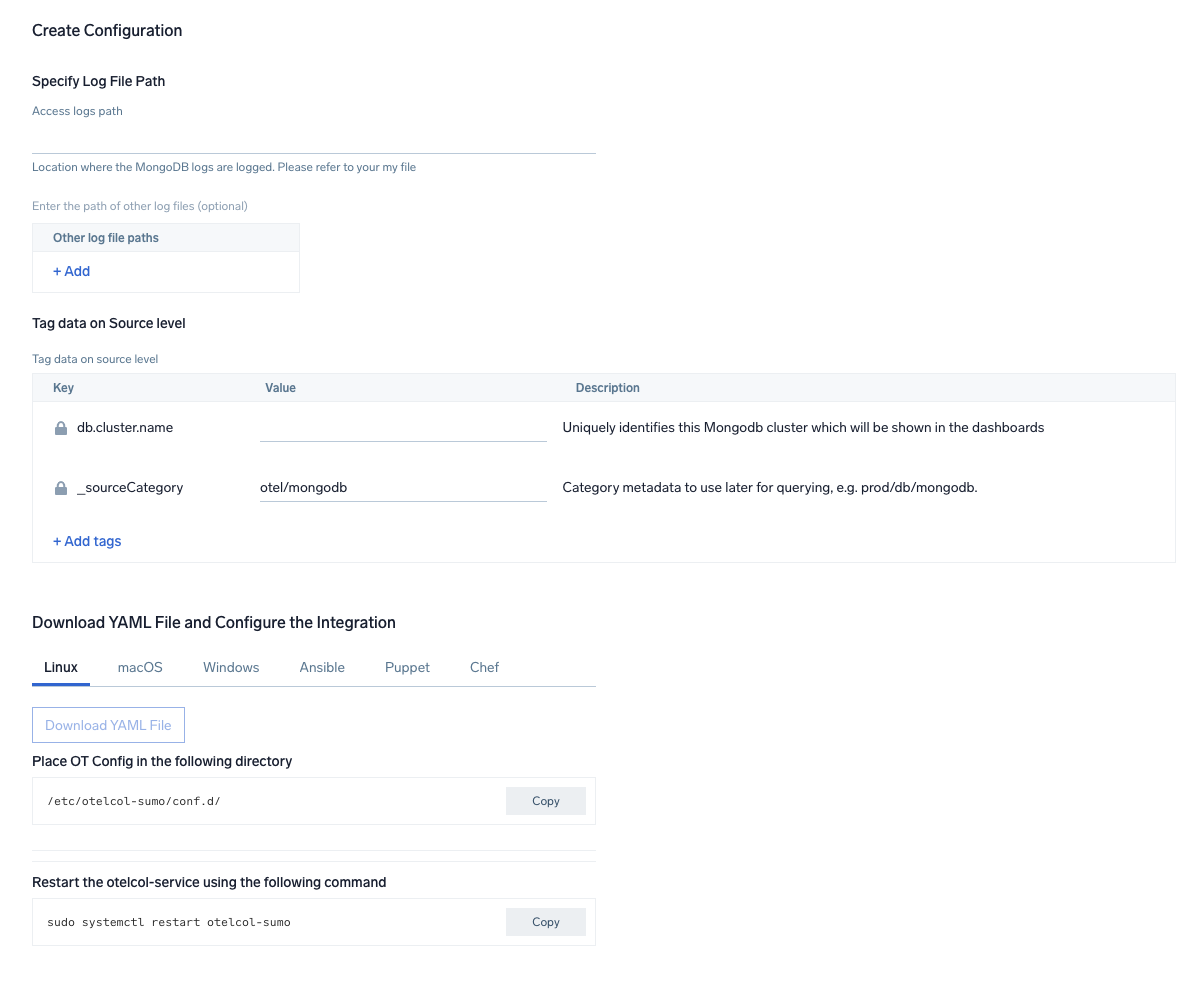
### Step 2: Configure integration
OpenTelemetry works with a [configuration](https://opentelemetry.io/docs/collector/configuration/) YAML file with all the details concerning the data that needs to be collected. For example, it specifies the location of a log file that is read and sent to the Sumo Logic platform.
In this step, you will configure the YAML file required for MongoDB collection.
Below are the inputs required:
- **`Endpoint (no default)`**. The hostname and port of the MognoDB instance, separated by a colon. This is required to scrap metrics. (For example: `localhost:27017`.)
:::note
For collecting metrics, *only* use the `mongod` endpoint. The Sumo Logic OpenTelemetry collector *does not* support the `mongos` endpoint.
:::
- **`Logs Path`**. Provide the path to the mongo db log file configured as part of above steps. Typically the logs are located at the location: `/var/log/mongodb/mongodb.log`.
- **`username (optional)`**. If authentication is required, the user can with clusterMonitor permissions can be provided here.
- **`password (optional)`**. If authentication is required, the password can be provided here.
You can add any custom fields which you want to tag along with the data ingested in Sumo. Click on the **Download YAML File** button to get the YAML file.
import CollectorVersionNote from '../../../reuse/apps/opentelemetry/collector-version-note.md';
import EnvVar from '../../../reuse/apps/opentelemetry/env-var-required.md';
 ### Step 3: Send logs to Sumo Logic
import LogsIntro from '../../../reuse/apps/opentelemetry/send-logs-intro.md';
1. Copy the YAML file to `/etc/otelcol-sumo/conf.d/` folder in the Mongodb instance which needs to be monitored.
2. Place Env file in the following directory:
```sh
/etc/otelcol-sumo/env/
```
3. restart the collector using:
```sh
sudo systemctl restart otelcol-sumo
```
1. Copy the YAML file to `C:\ProgramData\Sumo Logic\OpenTelemetry Collector\config\conf.d` folder in the machine which needs to be monitored.
2. Restart the collector using:
```sh
Restart-Service -Name OtelcolSumo
```
1. Copy the YAML file to `/etc/otelcol-sumo/conf.d/` folder in the Mongodb instance which needs to be monitored.
2. Restart the otelcol-sumo process using:
```sh
otelcol-sumo --config /etc/otelcol-sumo/sumologic.yaml --config "glob:/etc/otelcol-sumo/conf.d/*.yaml"
```
import ChefNoEnv from '../../../reuse/apps/opentelemetry/chef-without-env.md';
import AnsibleNoEnv from '../../../reuse/apps/opentelemetry/ansible-without-env.md';
import PuppetNoEnv from '../../../reuse/apps/opentelemetry/puppet-without-env.md';
import LogsOutro from '../../../reuse/apps/opentelemetry/send-logs-outro.md';
## Sample log messages
```json
{
"t":{
"$date":"2021-05-21T10:22:57.373+00:00"
},
"s":"I",
"c":"NETWORK",
"id":51800,
"ctx":"conn500659",
"msg":"client metadata",
"attr":{
"remote":"127.0.0.1:49472",
"client":"conn500659",
"doc":{
"application":{
"name":"MongoDB Shell"
},
"driver":{
"name":"MongoDB Internal Client",
"version":"4.4.4"
},
"os":{
"type":"Linux",
"name":"PRETTY_NAME=\"Debian GNU/Linux 10 (buster)\"",
"architecture":"x86_64",
"version":"Kernel 4.4.0-62-generic"
}
}
}
}
```
## Sample queries
```sumo title="Errors by Component( MongoDB - Errors and Warnings)"
deployment.environment=* db.cluster.name=* sumo.datasource=mongodb | json "log" as _rawlog nodrop
| if (isEmpty(_rawlog), _raw, _rawlog) as _raw
| json field=_raw "t.$date" as timestamp
| json field=_raw "s" as severity
| json field=_raw "c" as component
| json field=_raw "ctx" as context
| json field=_raw "msg" as msg
| where severity in ("E")
| count by component
```
## Viewing the MongoDB dashboards
import ViewDashboards from '../../../reuse/apps/view-dashboards.md';
### Overview
The **MongoDB - Overview** dashboard provides an at-a-glance view of MongoDB health, performance, and problems causing errors.
Use this dashboard to:
- Identify slow CRUD and DB commands.
- Gain insights into errors logs by component and context.
- Know the number of up servers.
### Step 3: Send logs to Sumo Logic
import LogsIntro from '../../../reuse/apps/opentelemetry/send-logs-intro.md';
1. Copy the YAML file to `/etc/otelcol-sumo/conf.d/` folder in the Mongodb instance which needs to be monitored.
2. Place Env file in the following directory:
```sh
/etc/otelcol-sumo/env/
```
3. restart the collector using:
```sh
sudo systemctl restart otelcol-sumo
```
1. Copy the YAML file to `C:\ProgramData\Sumo Logic\OpenTelemetry Collector\config\conf.d` folder in the machine which needs to be monitored.
2. Restart the collector using:
```sh
Restart-Service -Name OtelcolSumo
```
1. Copy the YAML file to `/etc/otelcol-sumo/conf.d/` folder in the Mongodb instance which needs to be monitored.
2. Restart the otelcol-sumo process using:
```sh
otelcol-sumo --config /etc/otelcol-sumo/sumologic.yaml --config "glob:/etc/otelcol-sumo/conf.d/*.yaml"
```
import ChefNoEnv from '../../../reuse/apps/opentelemetry/chef-without-env.md';
import AnsibleNoEnv from '../../../reuse/apps/opentelemetry/ansible-without-env.md';
import PuppetNoEnv from '../../../reuse/apps/opentelemetry/puppet-without-env.md';
import LogsOutro from '../../../reuse/apps/opentelemetry/send-logs-outro.md';
## Sample log messages
```json
{
"t":{
"$date":"2021-05-21T10:22:57.373+00:00"
},
"s":"I",
"c":"NETWORK",
"id":51800,
"ctx":"conn500659",
"msg":"client metadata",
"attr":{
"remote":"127.0.0.1:49472",
"client":"conn500659",
"doc":{
"application":{
"name":"MongoDB Shell"
},
"driver":{
"name":"MongoDB Internal Client",
"version":"4.4.4"
},
"os":{
"type":"Linux",
"name":"PRETTY_NAME=\"Debian GNU/Linux 10 (buster)\"",
"architecture":"x86_64",
"version":"Kernel 4.4.0-62-generic"
}
}
}
}
```
## Sample queries
```sumo title="Errors by Component( MongoDB - Errors and Warnings)"
deployment.environment=* db.cluster.name=* sumo.datasource=mongodb | json "log" as _rawlog nodrop
| if (isEmpty(_rawlog), _raw, _rawlog) as _raw
| json field=_raw "t.$date" as timestamp
| json field=_raw "s" as severity
| json field=_raw "c" as component
| json field=_raw "ctx" as context
| json field=_raw "msg" as msg
| where severity in ("E")
| count by component
```
## Viewing the MongoDB dashboards
import ViewDashboards from '../../../reuse/apps/view-dashboards.md';
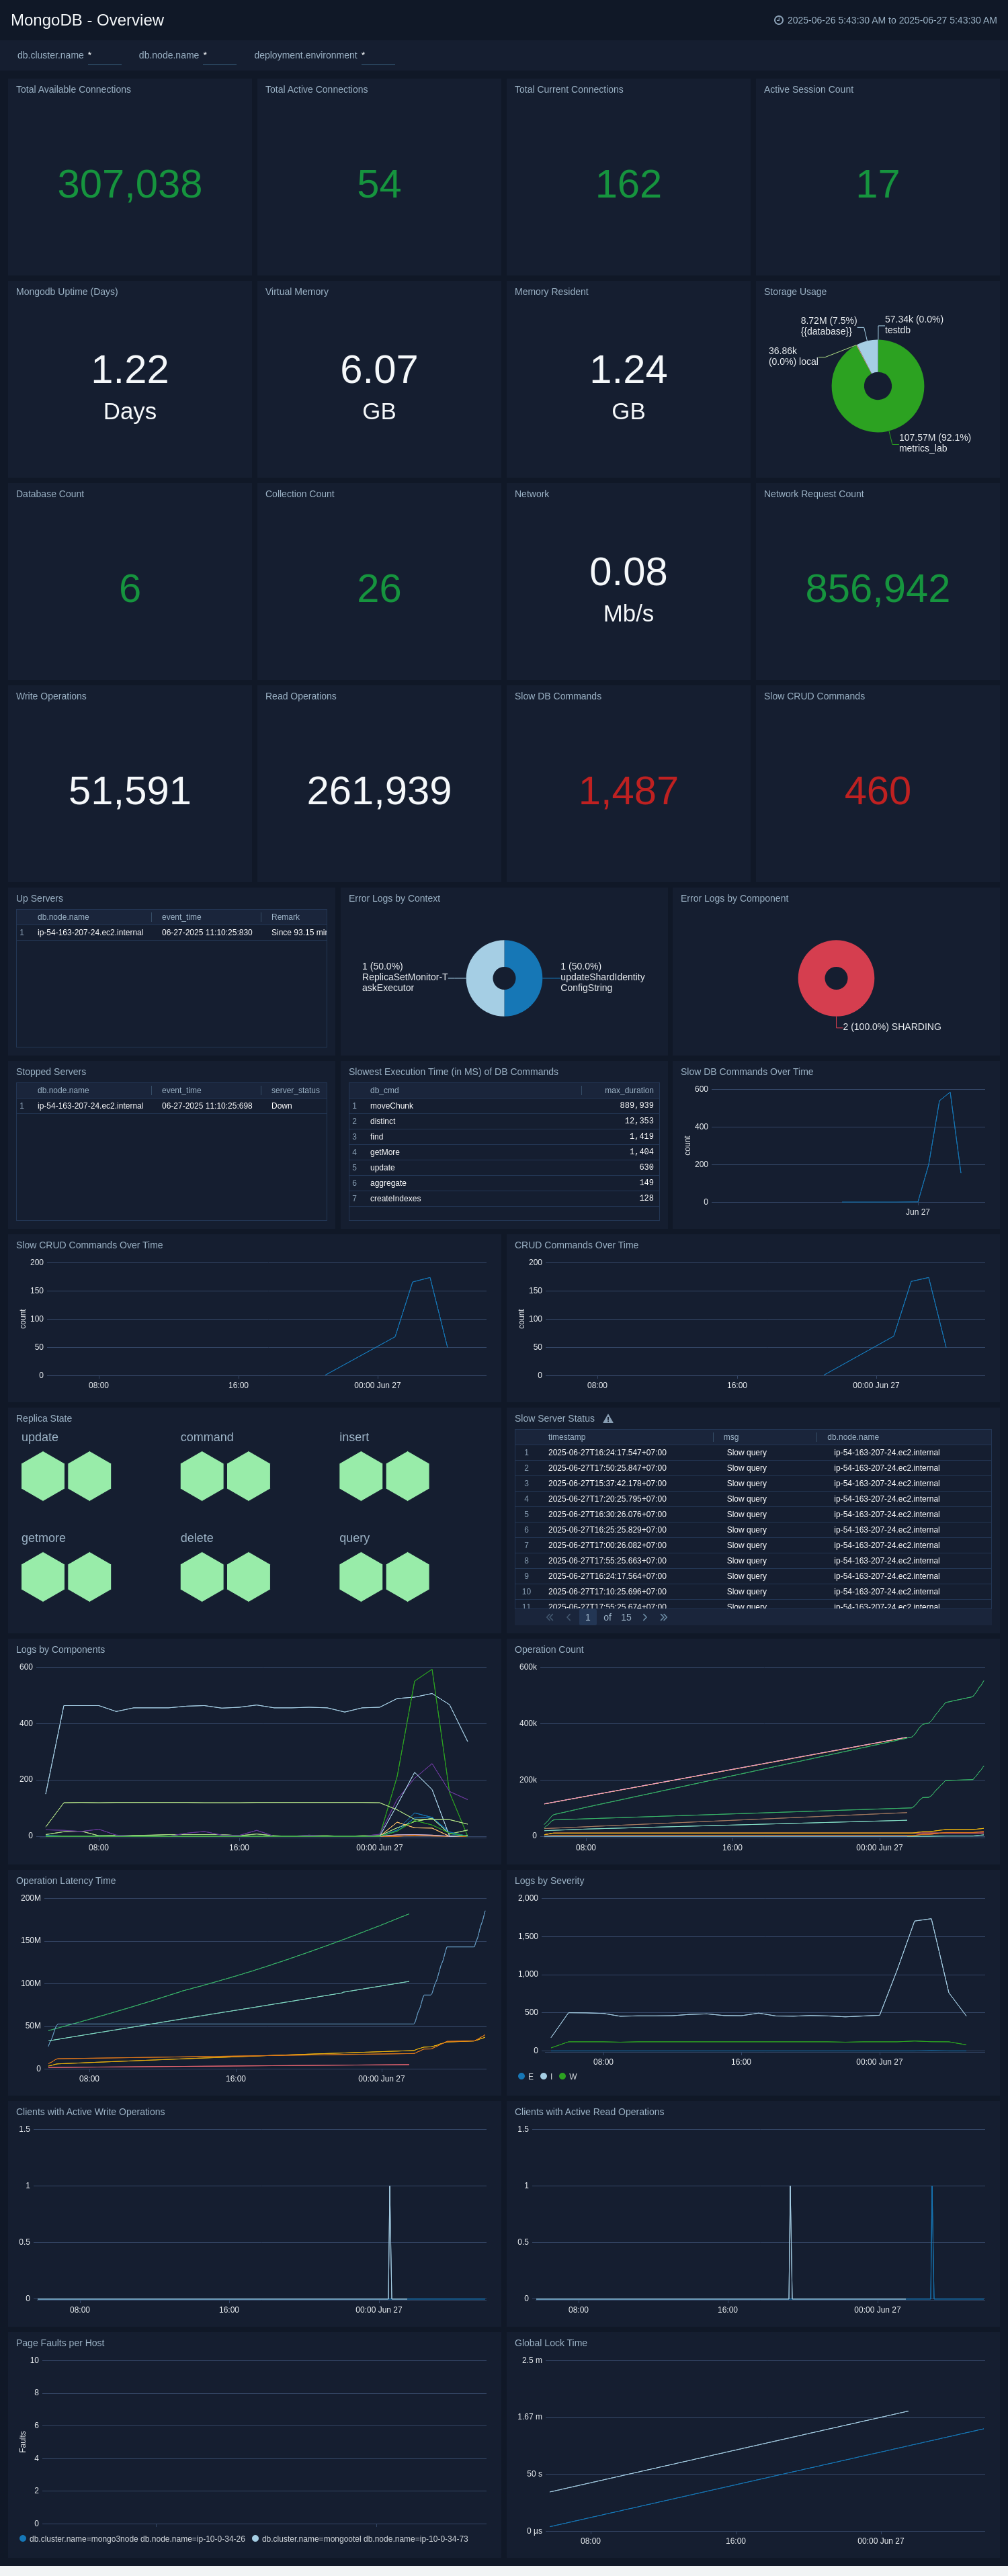
### Overview
The **MongoDB - Overview** dashboard provides an at-a-glance view of MongoDB health, performance, and problems causing errors.
Use this dashboard to:
- Identify slow CRUD and DB commands.
- Gain insights into errors logs by component and context.
- Know the number of up servers.
 ### Errors and Warnings
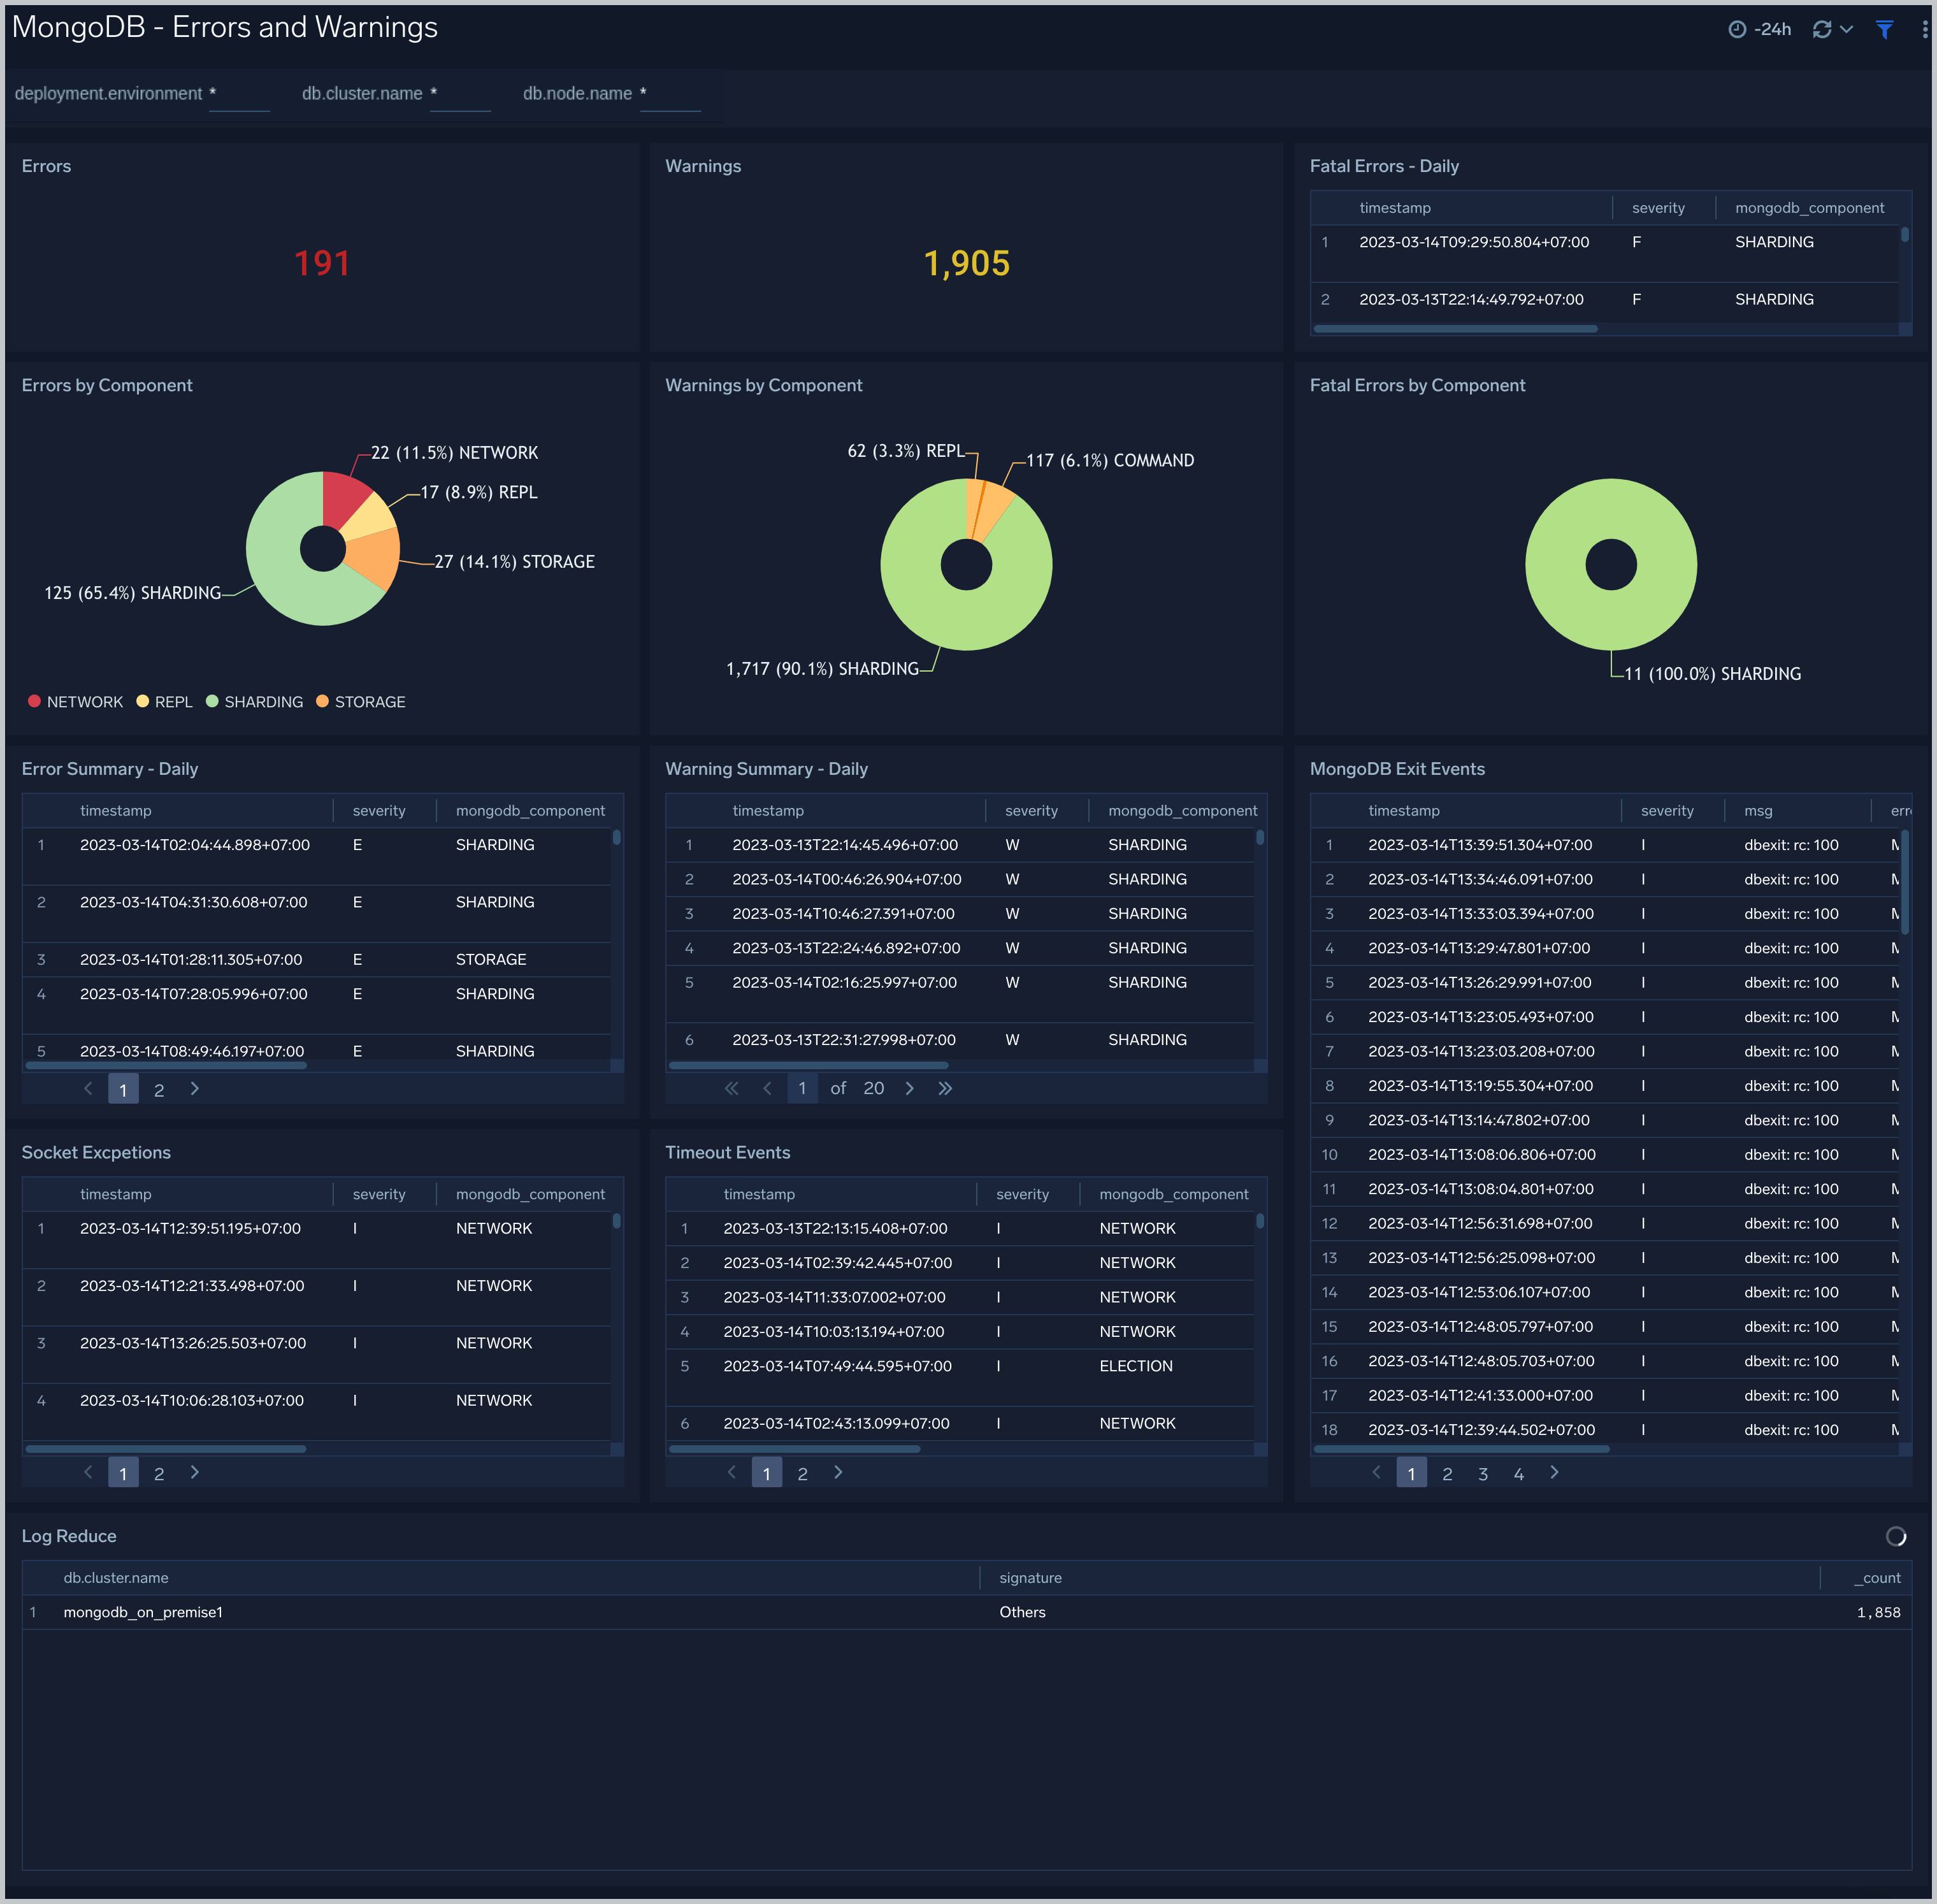
The **MongoDB - Errors and Warnings** dashboard shows errors and warnings by the MongoDB component. Use this dashboard to determine the components producing multiple errors or warnings.
### Errors and Warnings
The **MongoDB - Errors and Warnings** dashboard shows errors and warnings by the MongoDB component. Use this dashboard to determine the components producing multiple errors or warnings.
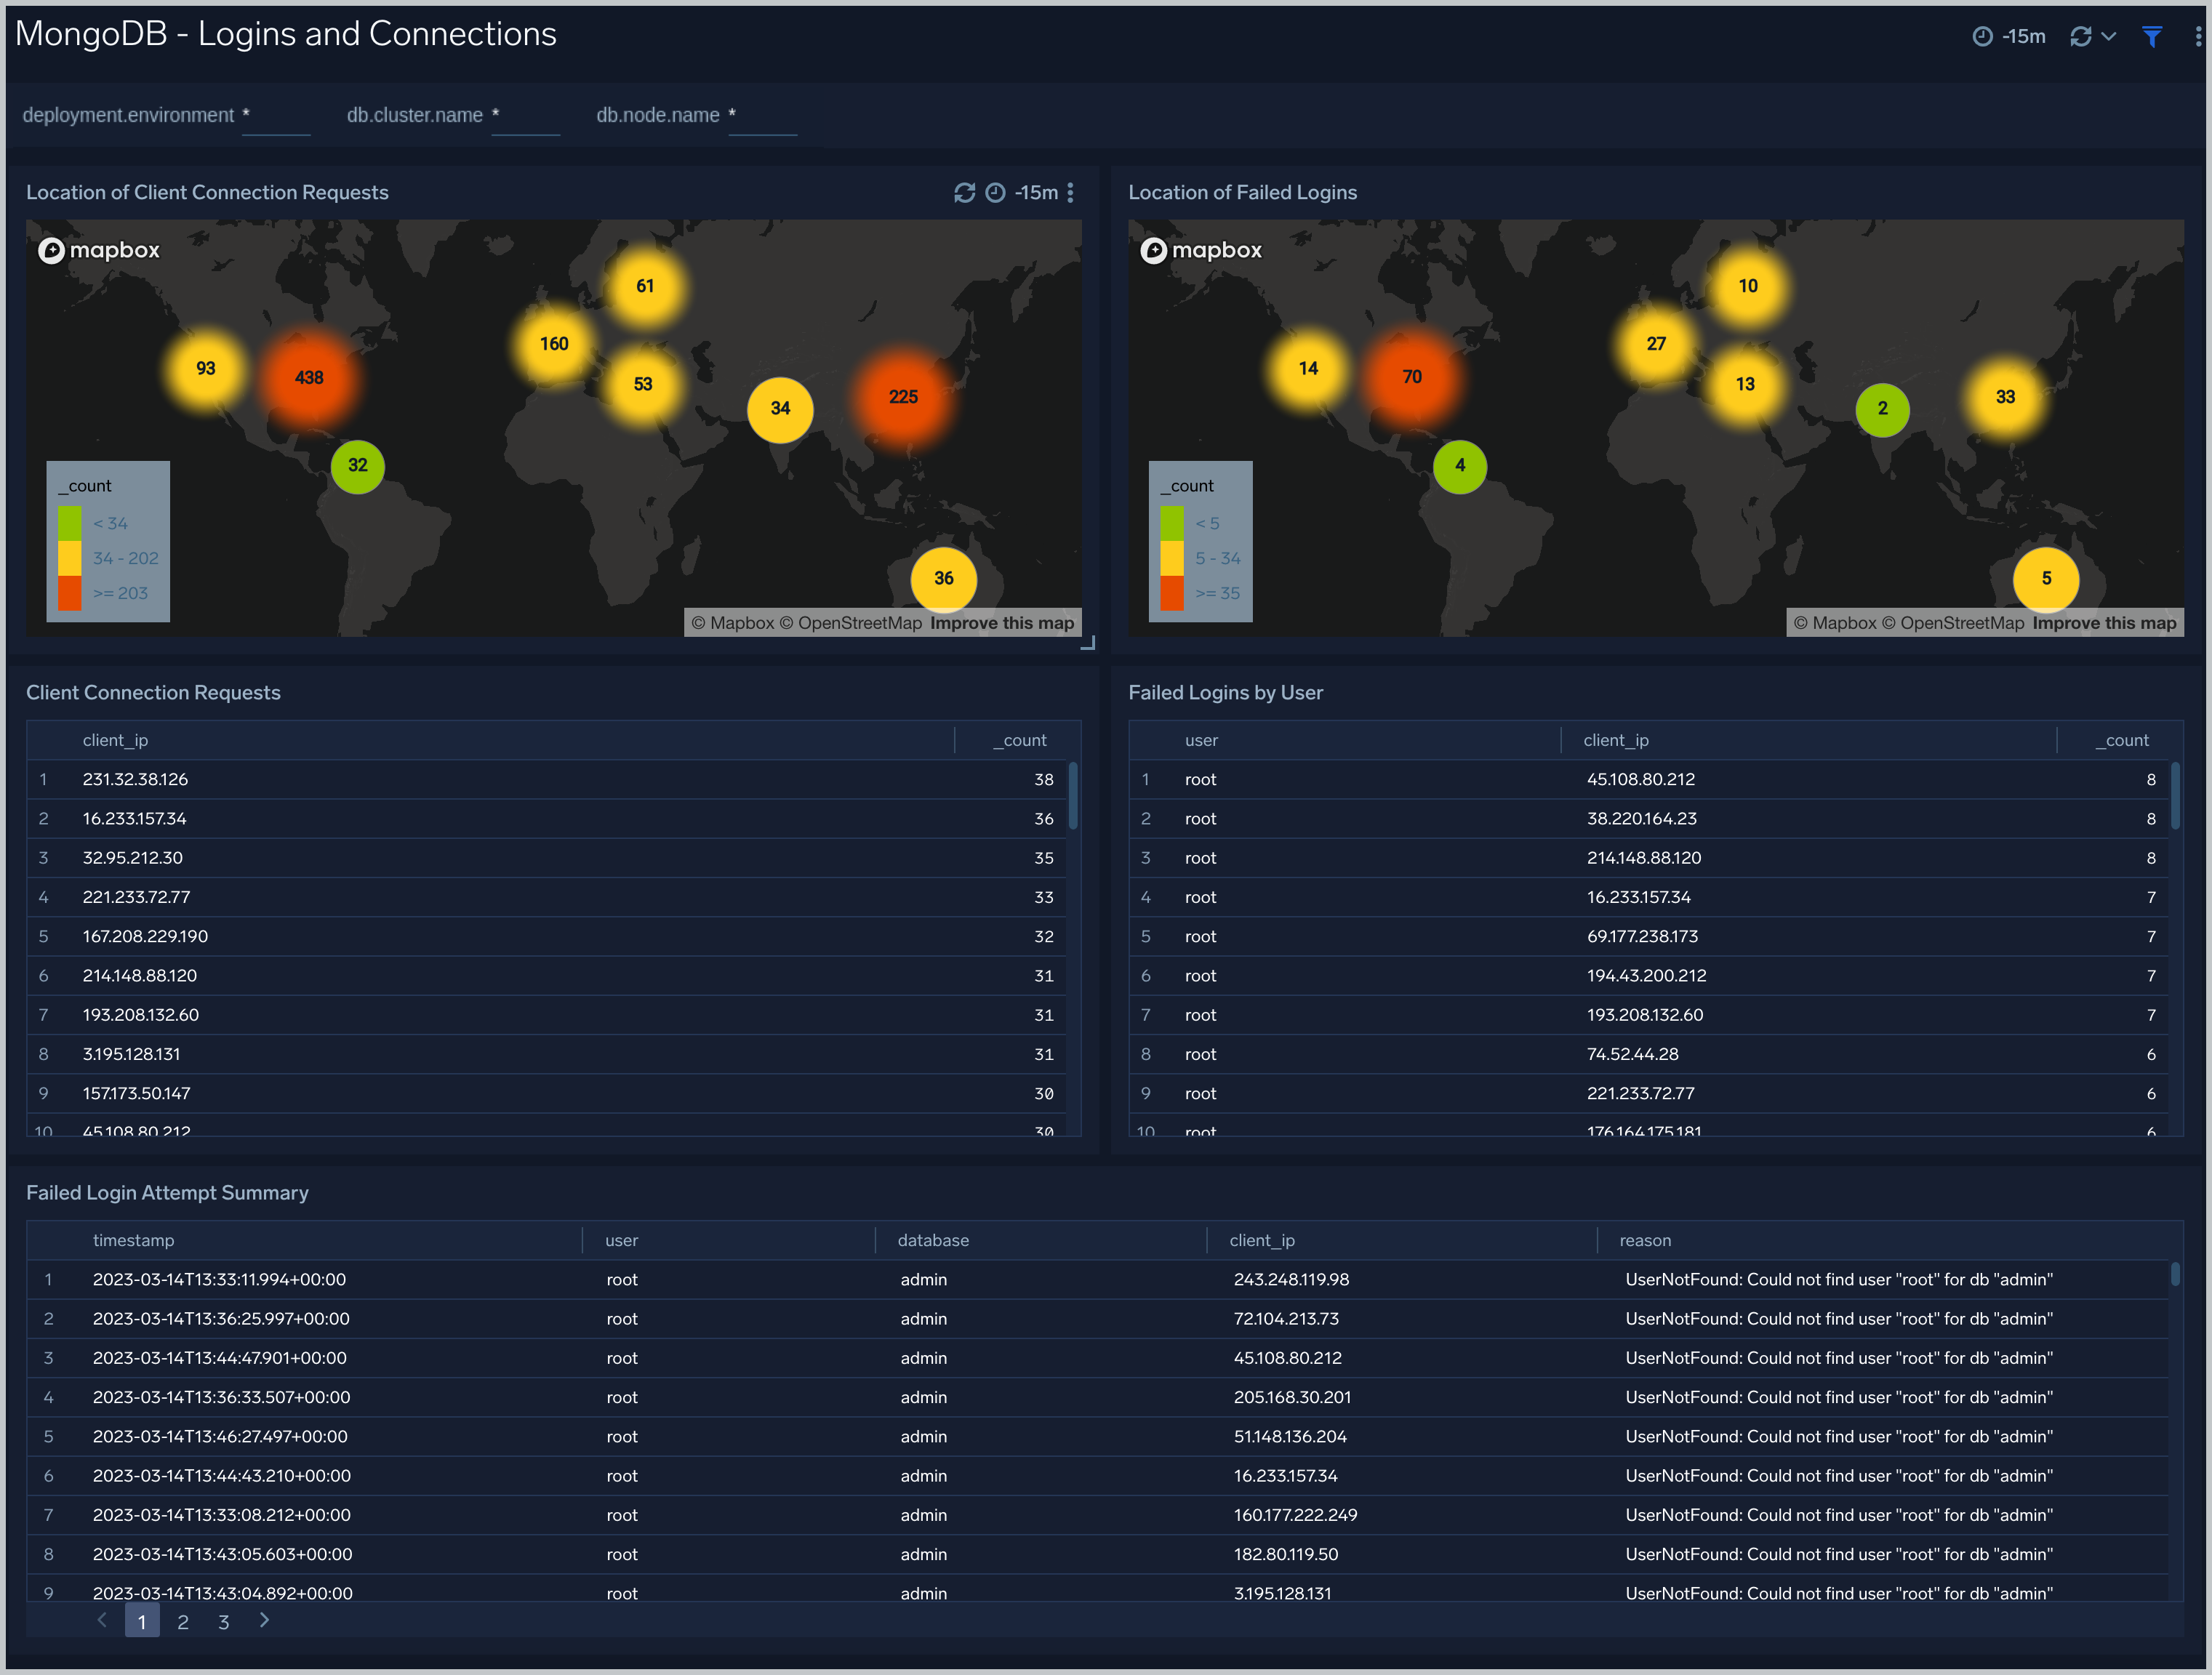
 ### Logins and Connections
The **MongoDB - Logins and Connections** dashboard shows geo location of client connection requests, failed connection logins by geo location, and count of failed login attempts.
Use this dashboard to:
- Determine potential hacking attempts.
- Determine location of attacks.
### Logins and Connections
The **MongoDB - Logins and Connections** dashboard shows geo location of client connection requests, failed connection logins by geo location, and count of failed login attempts.
Use this dashboard to:
- Determine potential hacking attempts.
- Determine location of attacks.
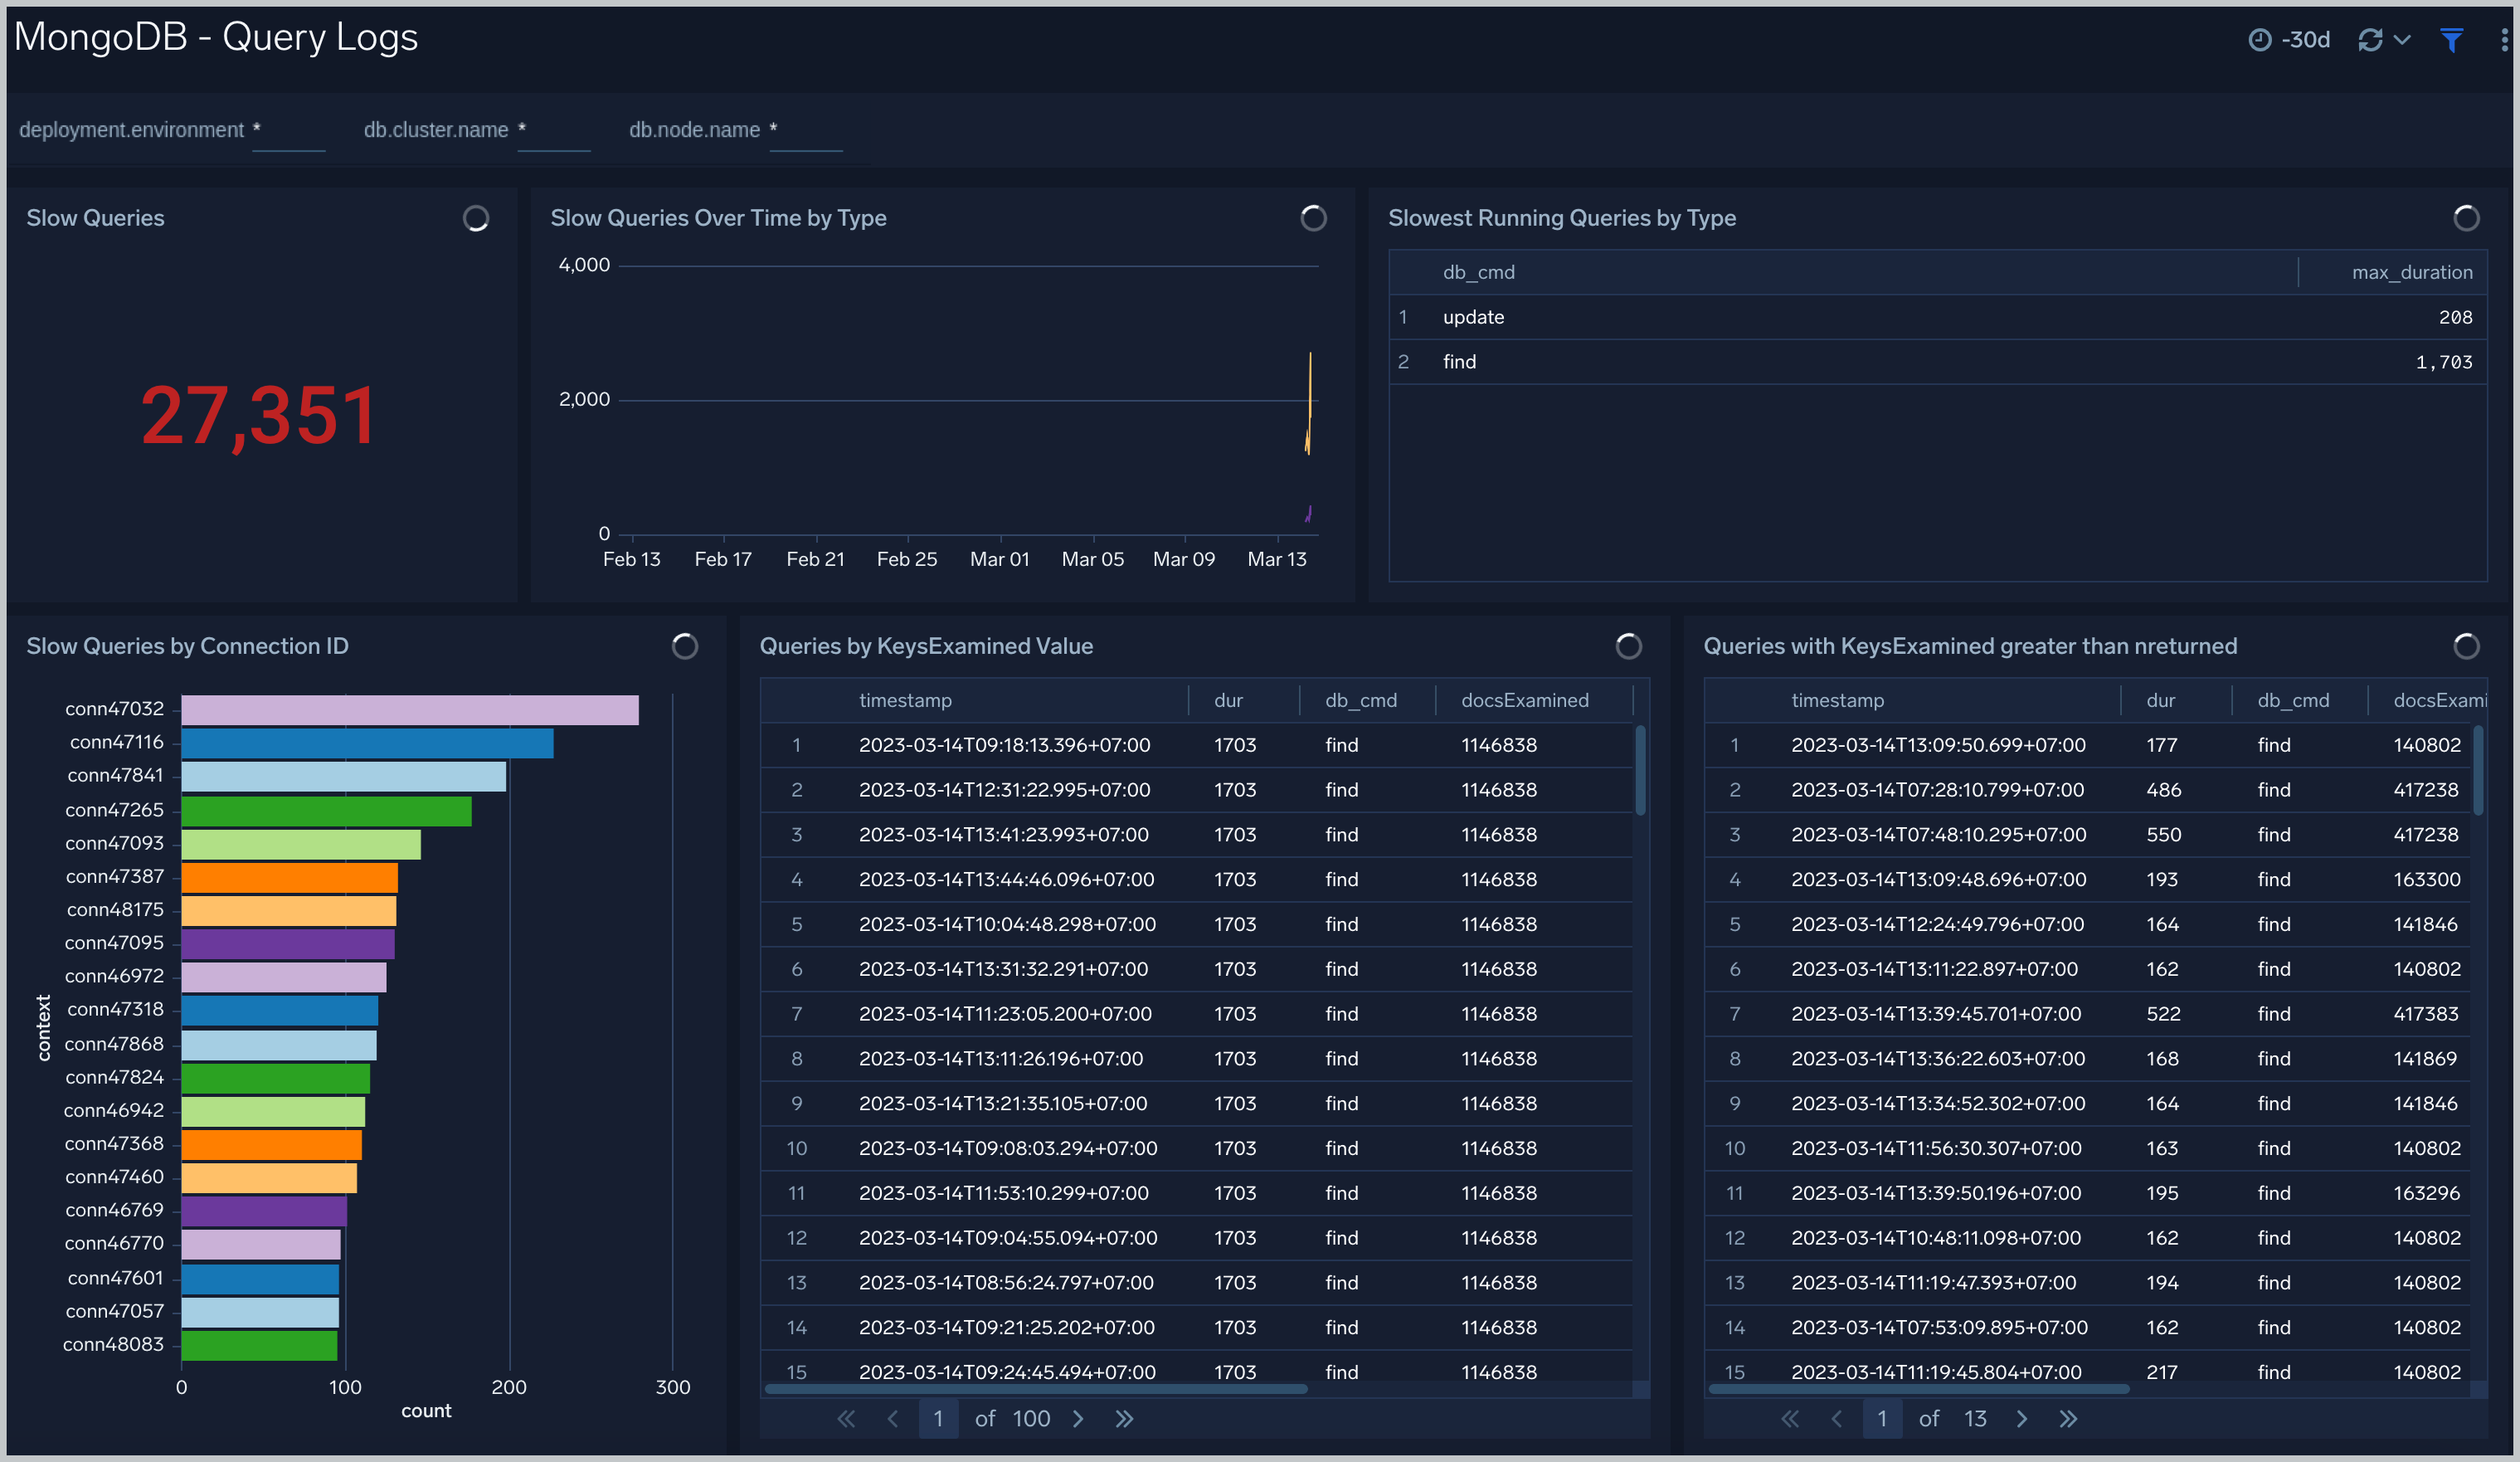
 ### Query Logs
The **MongoDB - Query Logs** dashboard shows read and write query trends.
Use this dashboard to:
- Monitor abnormal spikes in query volume.
- Identify read versus write ratio of your application queries. This helps you to adjust indexes to improve query performance.
### Query Logs
The **MongoDB - Query Logs** dashboard shows read and write query trends.
Use this dashboard to:
- Monitor abnormal spikes in query volume.
- Identify read versus write ratio of your application queries. This helps you to adjust indexes to improve query performance.
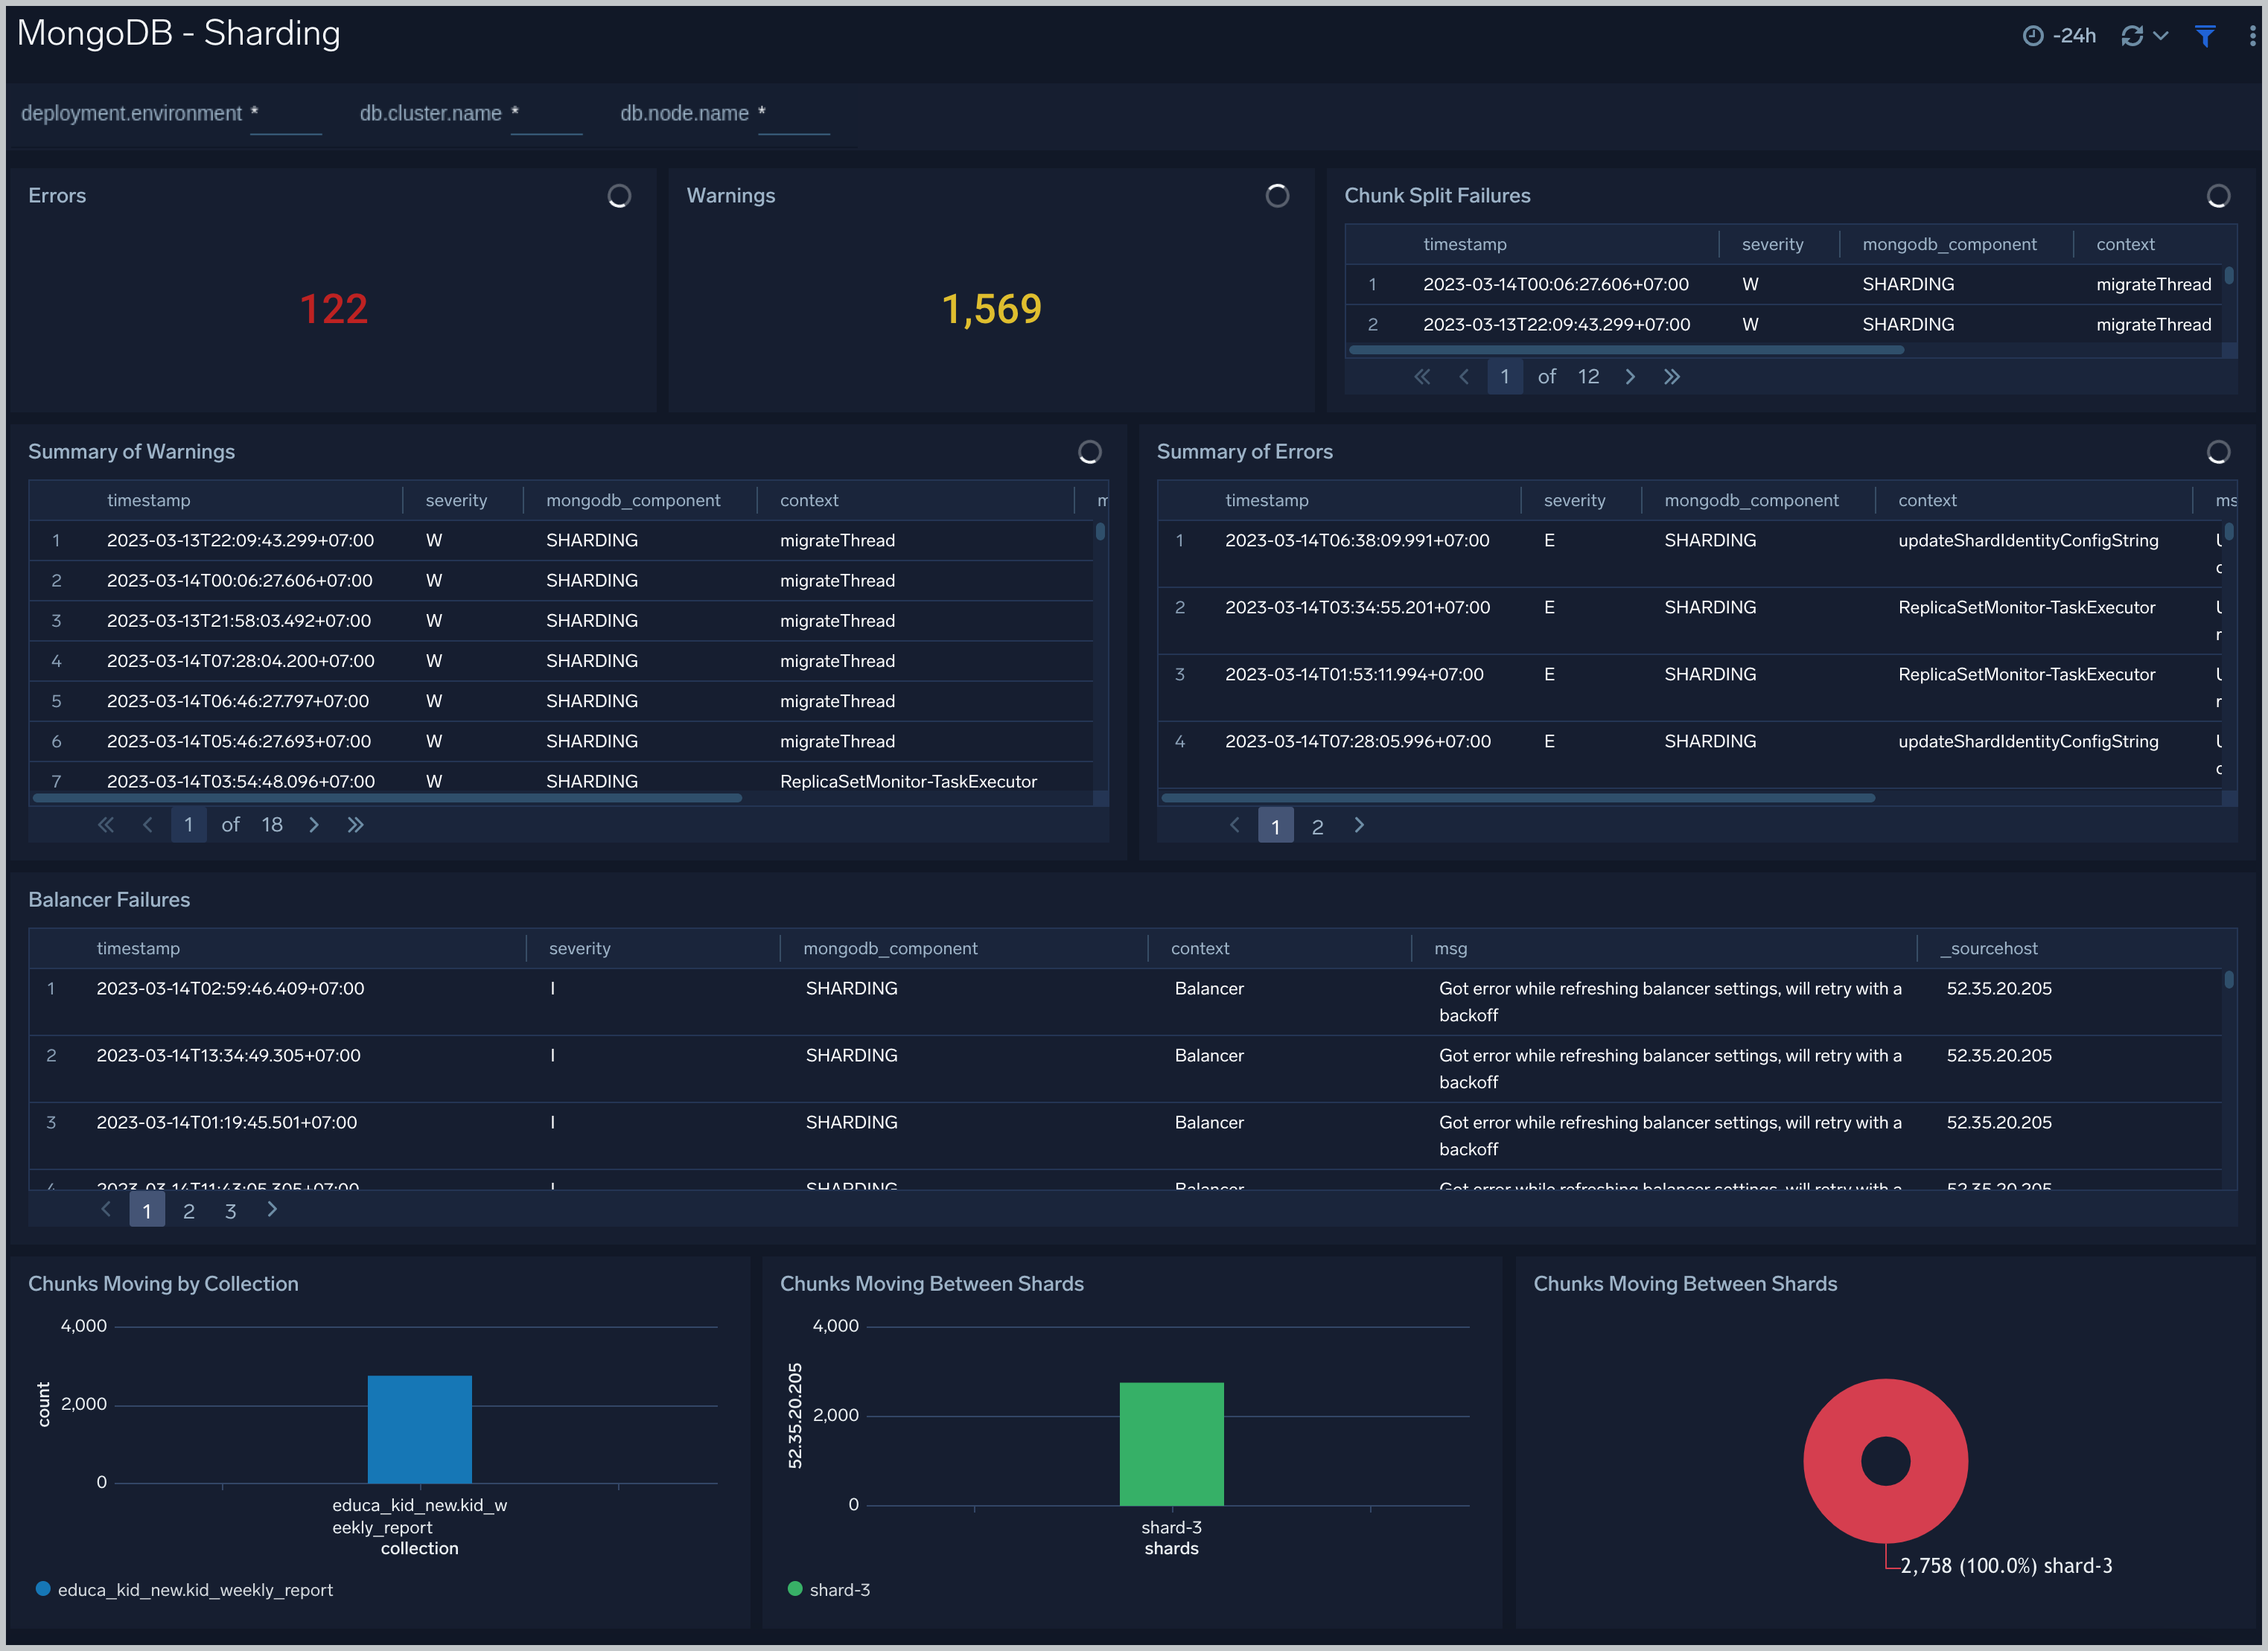
 ### Sharding
The **MongoDB - Sharding** dashboard shows sharding related errors, events, failures, and number of chunks moving between shards.
Use this dashboard to:
- Identify sharding errors and warnings.
- Gain insights into chunk operations.
### Sharding
The **MongoDB - Sharding** dashboard shows sharding related errors, events, failures, and number of chunks moving between shards.
Use this dashboard to:
- Identify sharding errors and warnings.
- Gain insights into chunk operations.
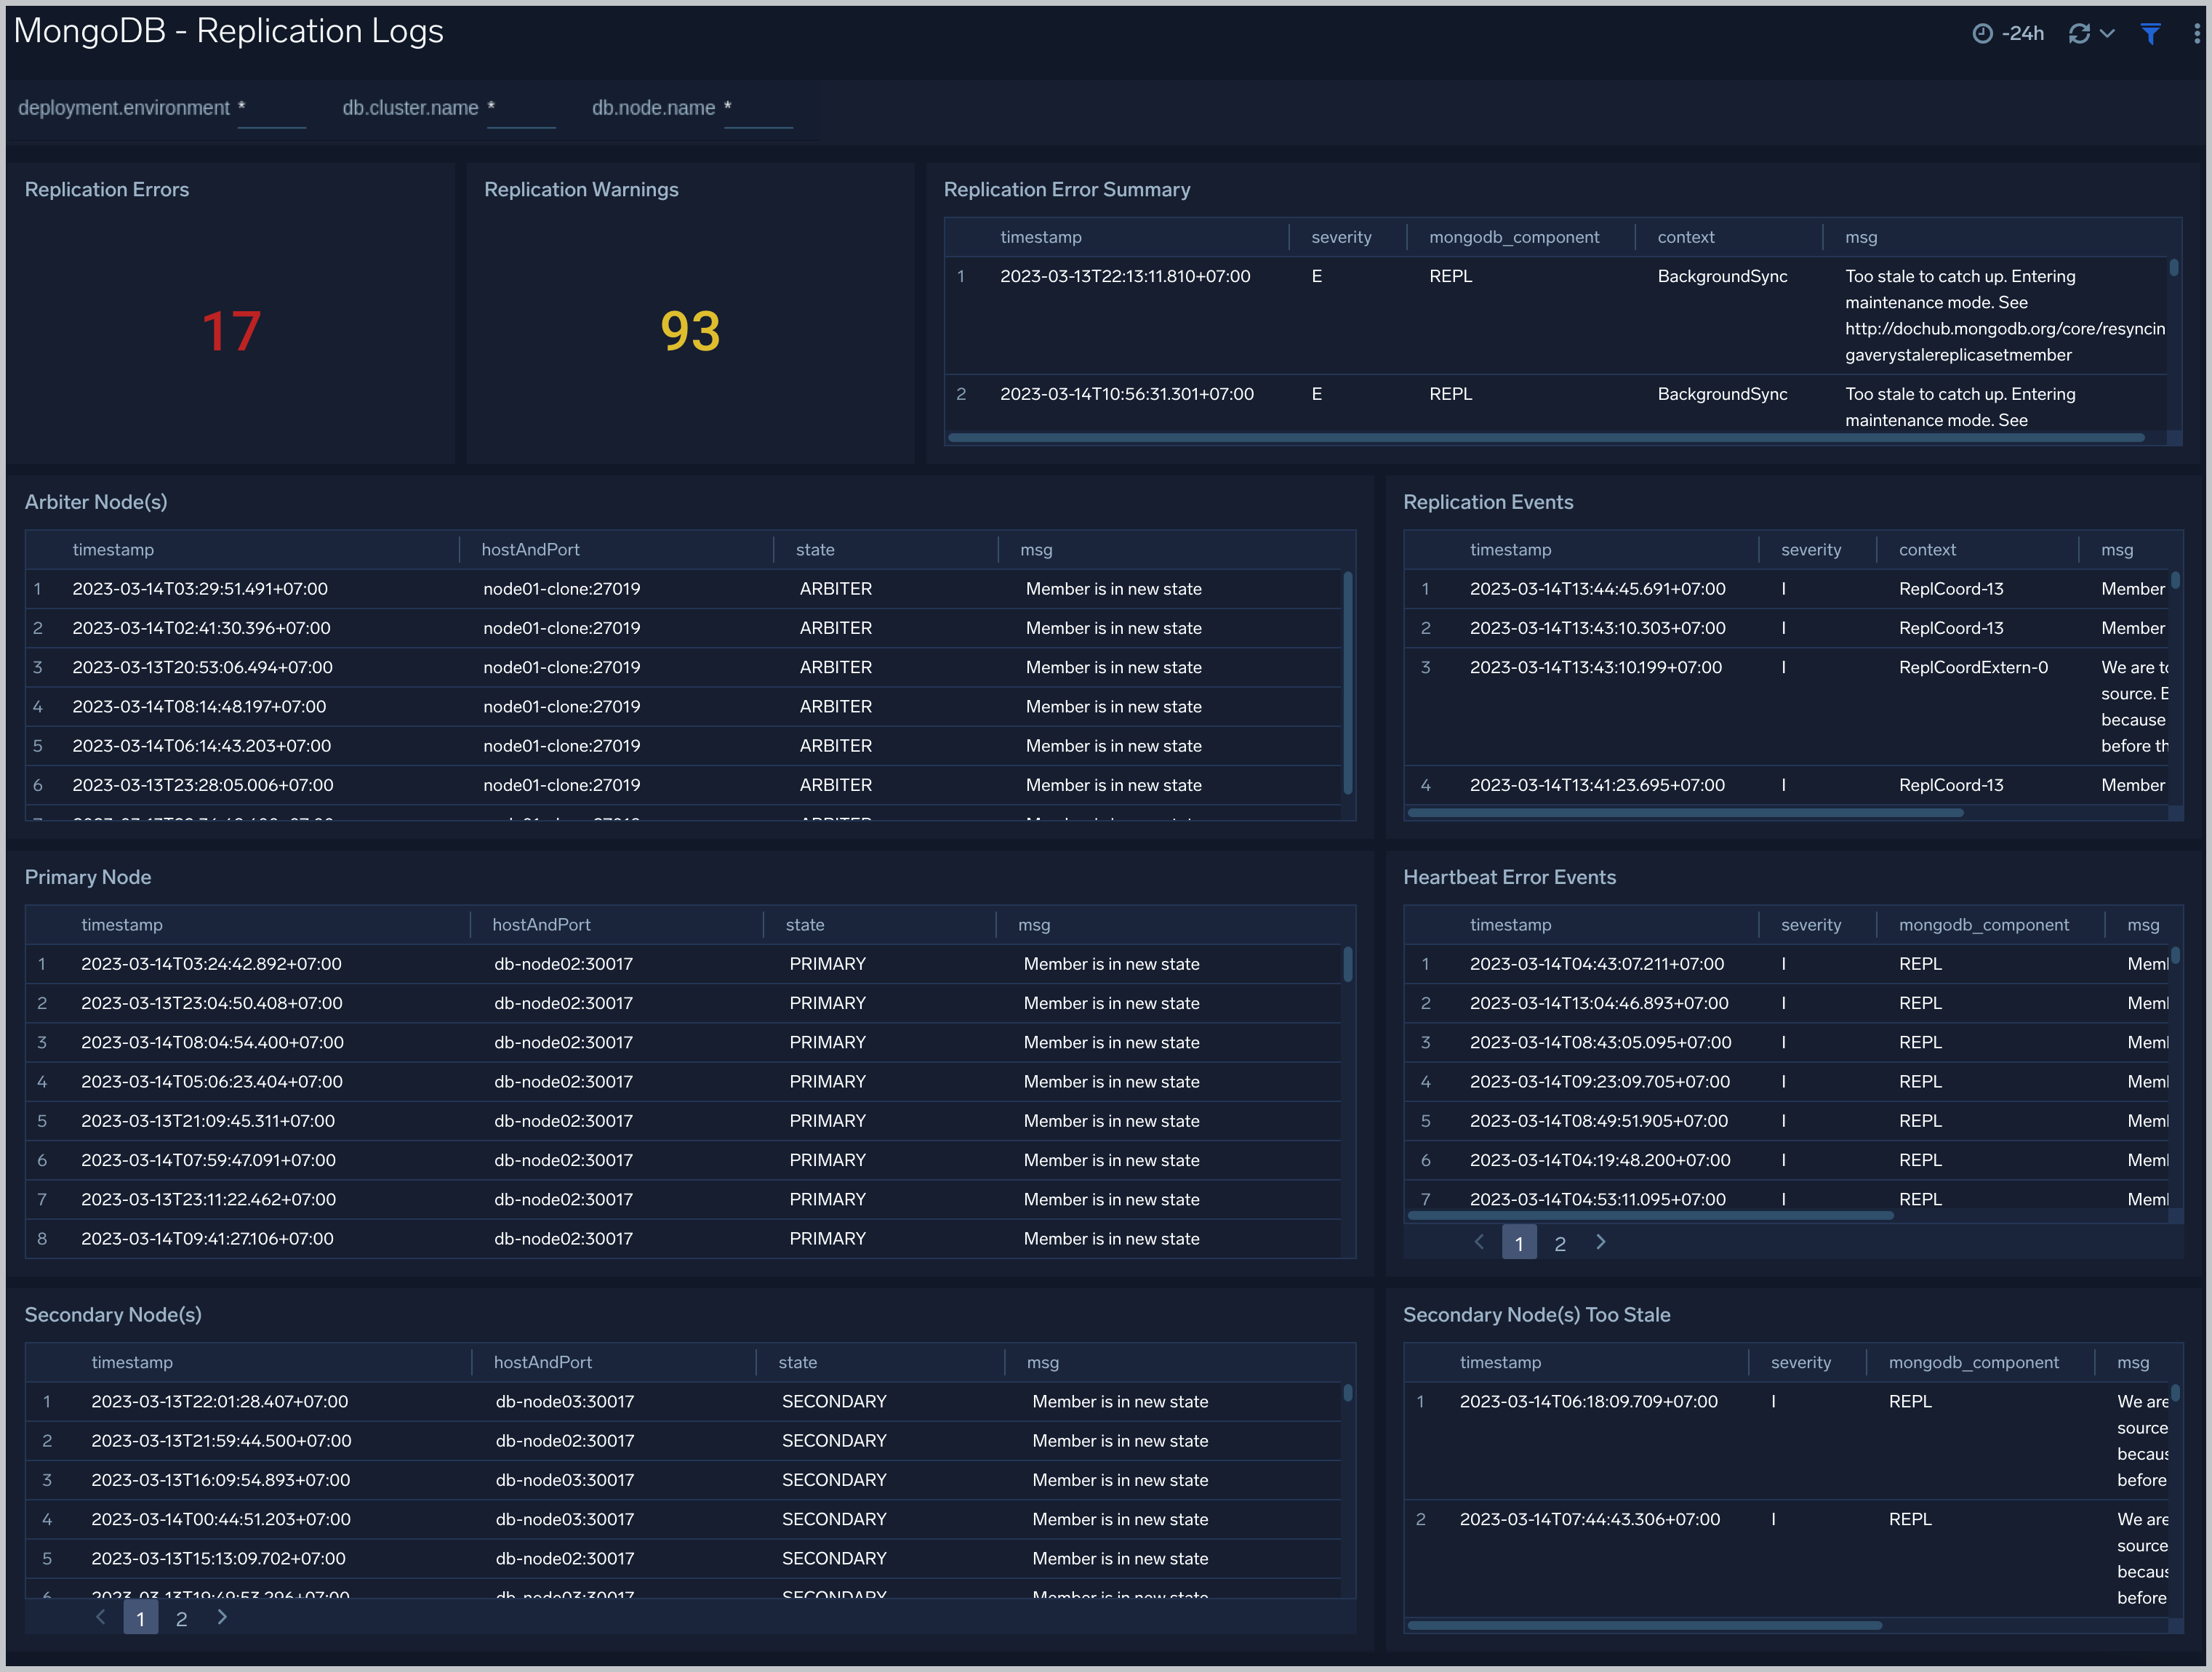
 ### Replication Logs
The **MongoDB - Replication Logs** dashboard shows replica deletes/updates/inserts trend and replica state.
Use this dashboard to:
- Identify replication errors and warnings.
- Gain insights into replication operations.
### Replication Logs
The **MongoDB - Replication Logs** dashboard shows replica deletes/updates/inserts trend and replica state.
Use this dashboard to:
- Identify replication errors and warnings.
- Gain insights into replication operations.
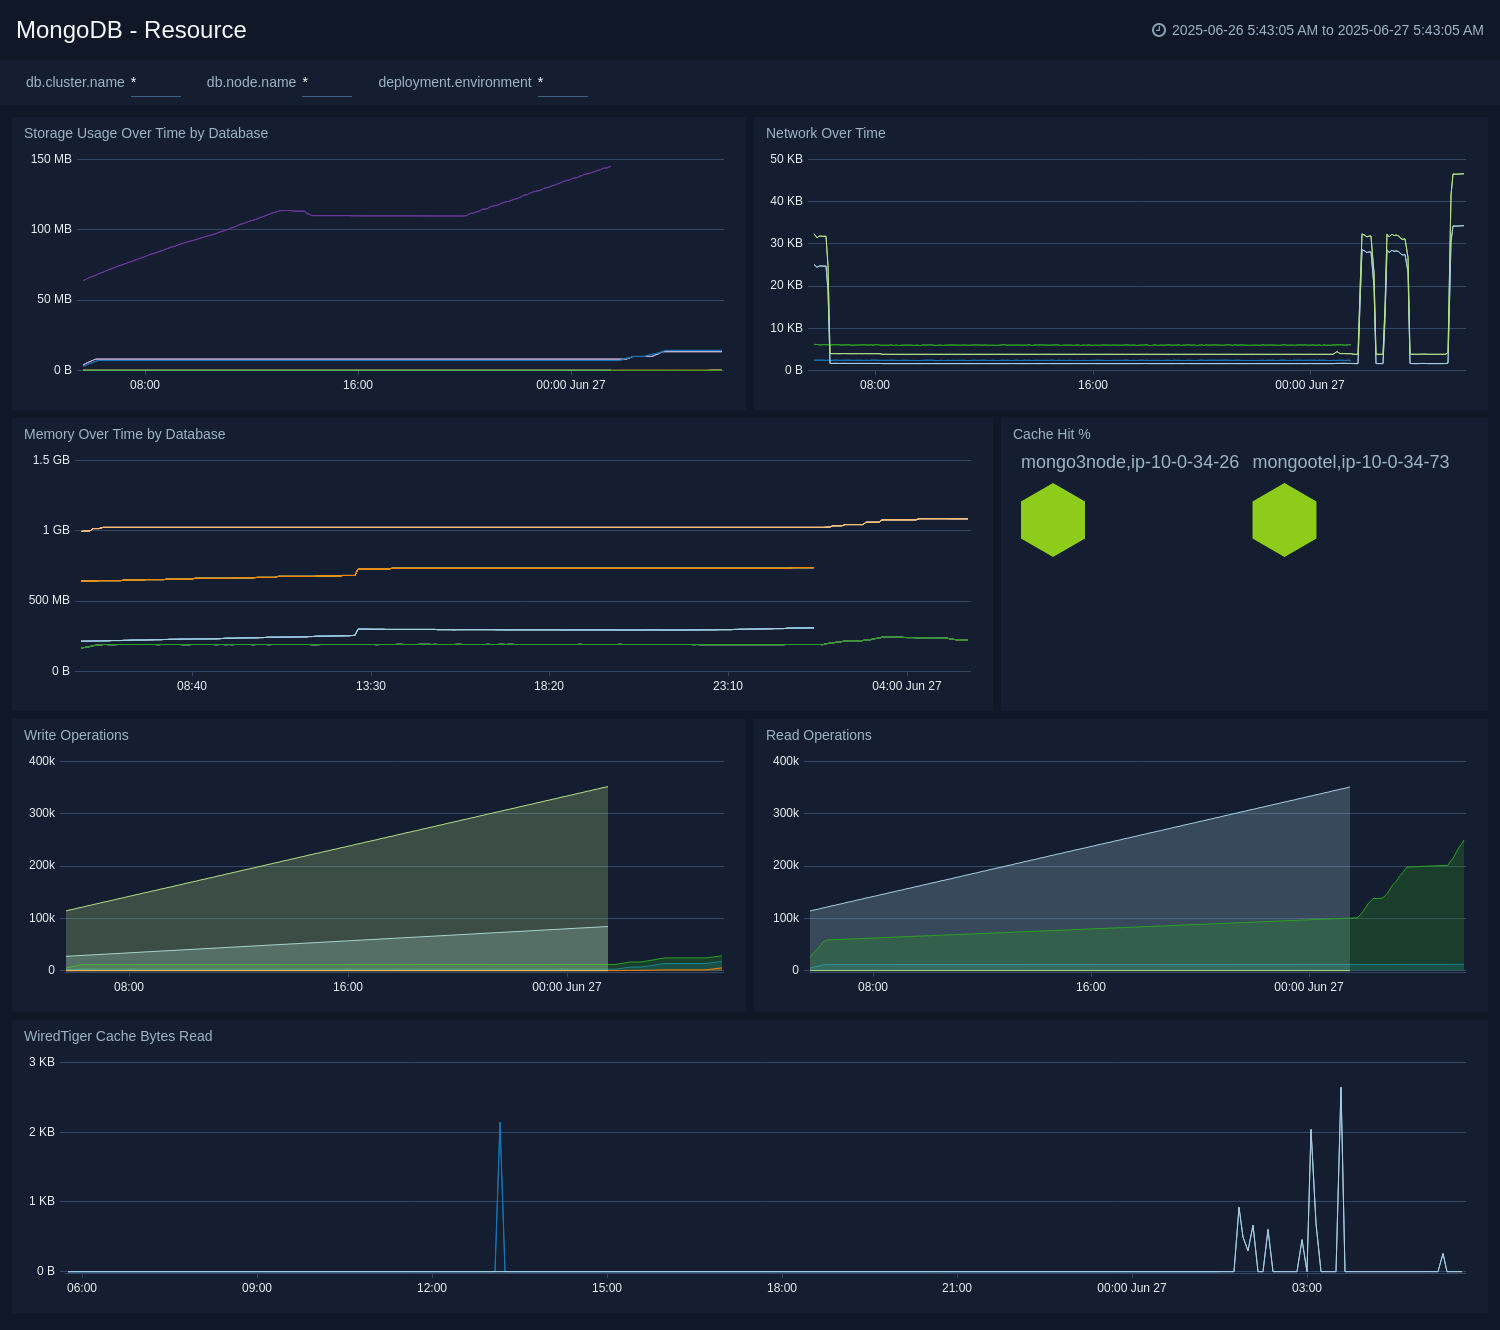
 ### Resource
The **MongoDB - Resource** dashboard shows resource utilization by the MongoDB component.
Use this dashboard to:
* Determine memory and disk usage.
* Identify potential resource constraints and issues.
### Resource
The **MongoDB - Resource** dashboard shows resource utilization by the MongoDB component.
Use this dashboard to:
* Determine memory and disk usage.
* Identify potential resource constraints and issues.
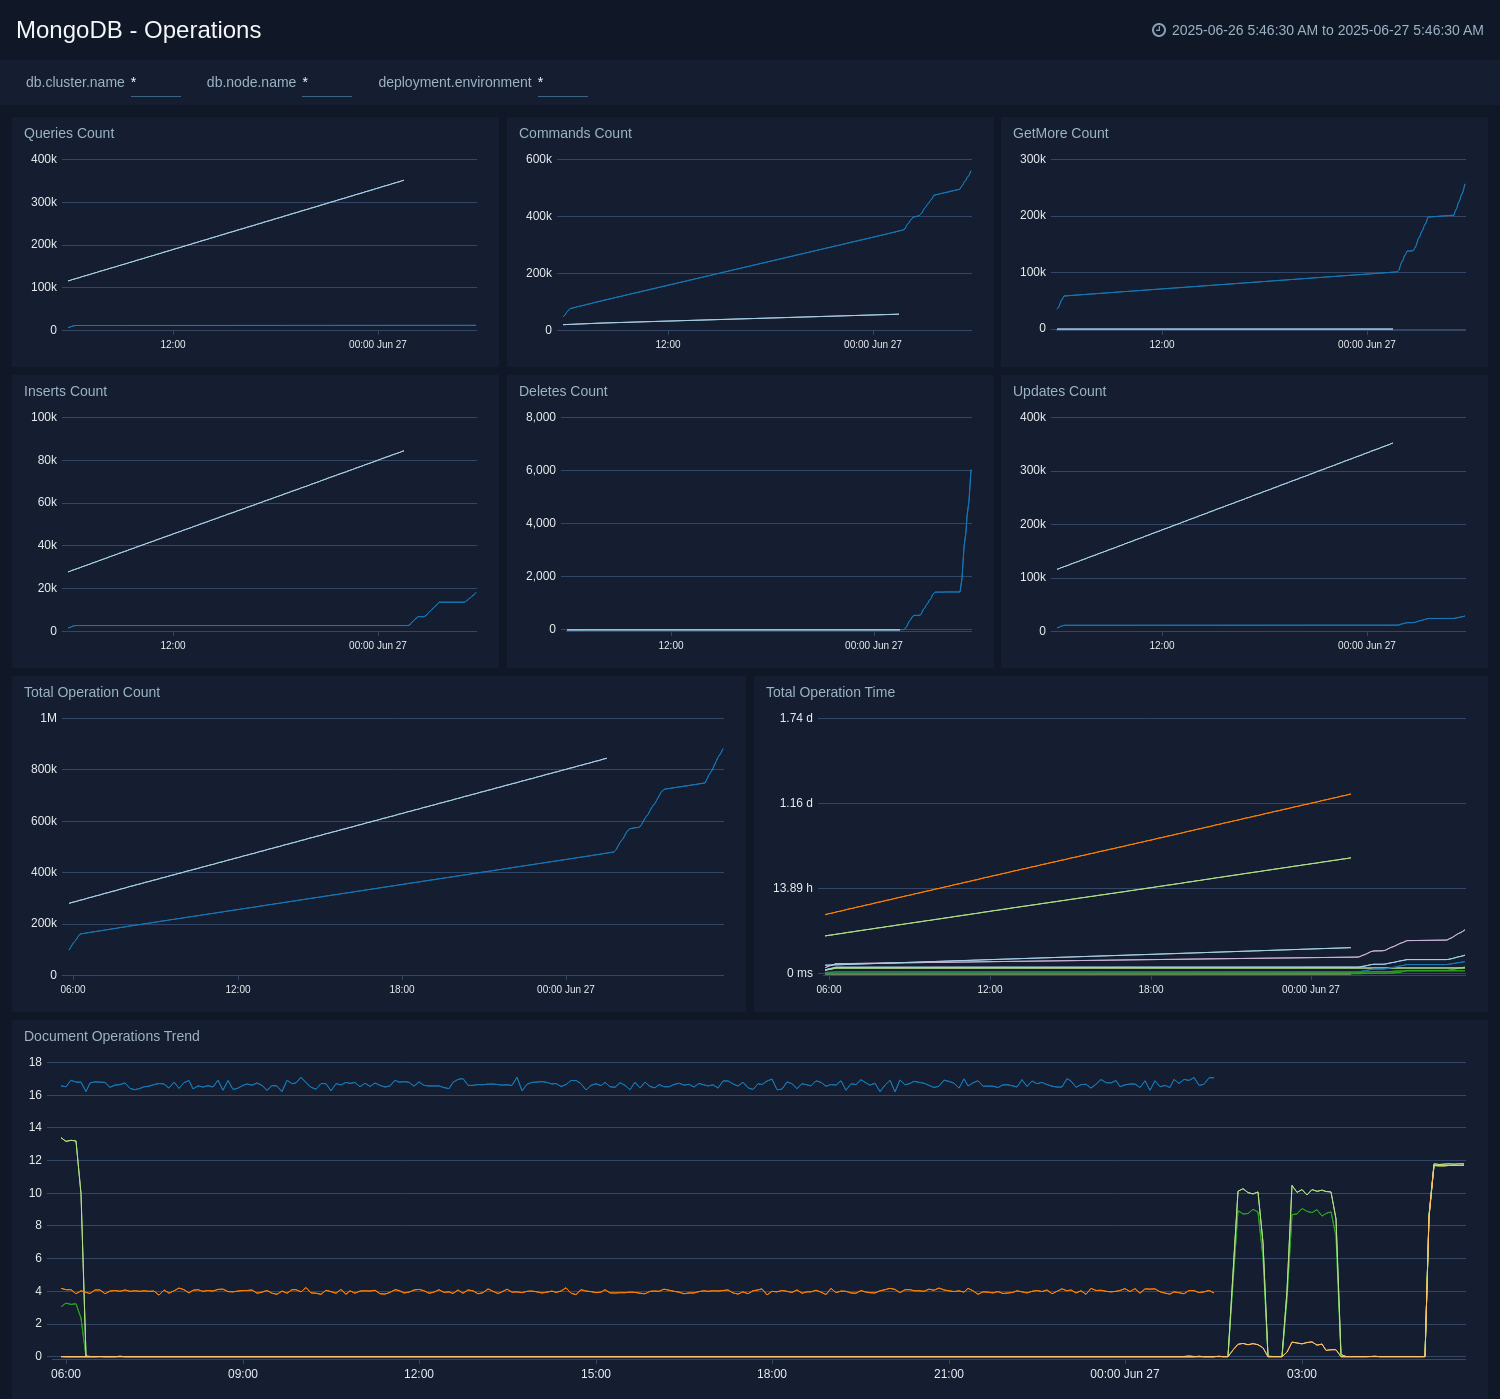
 ### Operations
The **MongoDB - Operations** dashboard shows MongoDB queries analytics using metrics.
Use this dashboard to:
* Know different kind of operation count like query, insert, and delete.
* Determine the operation time taken by different queries.
### Operations
The **MongoDB - Operations** dashboard shows MongoDB queries analytics using metrics.
Use this dashboard to:
* Know different kind of operation count like query, insert, and delete.
* Determine the operation time taken by different queries.
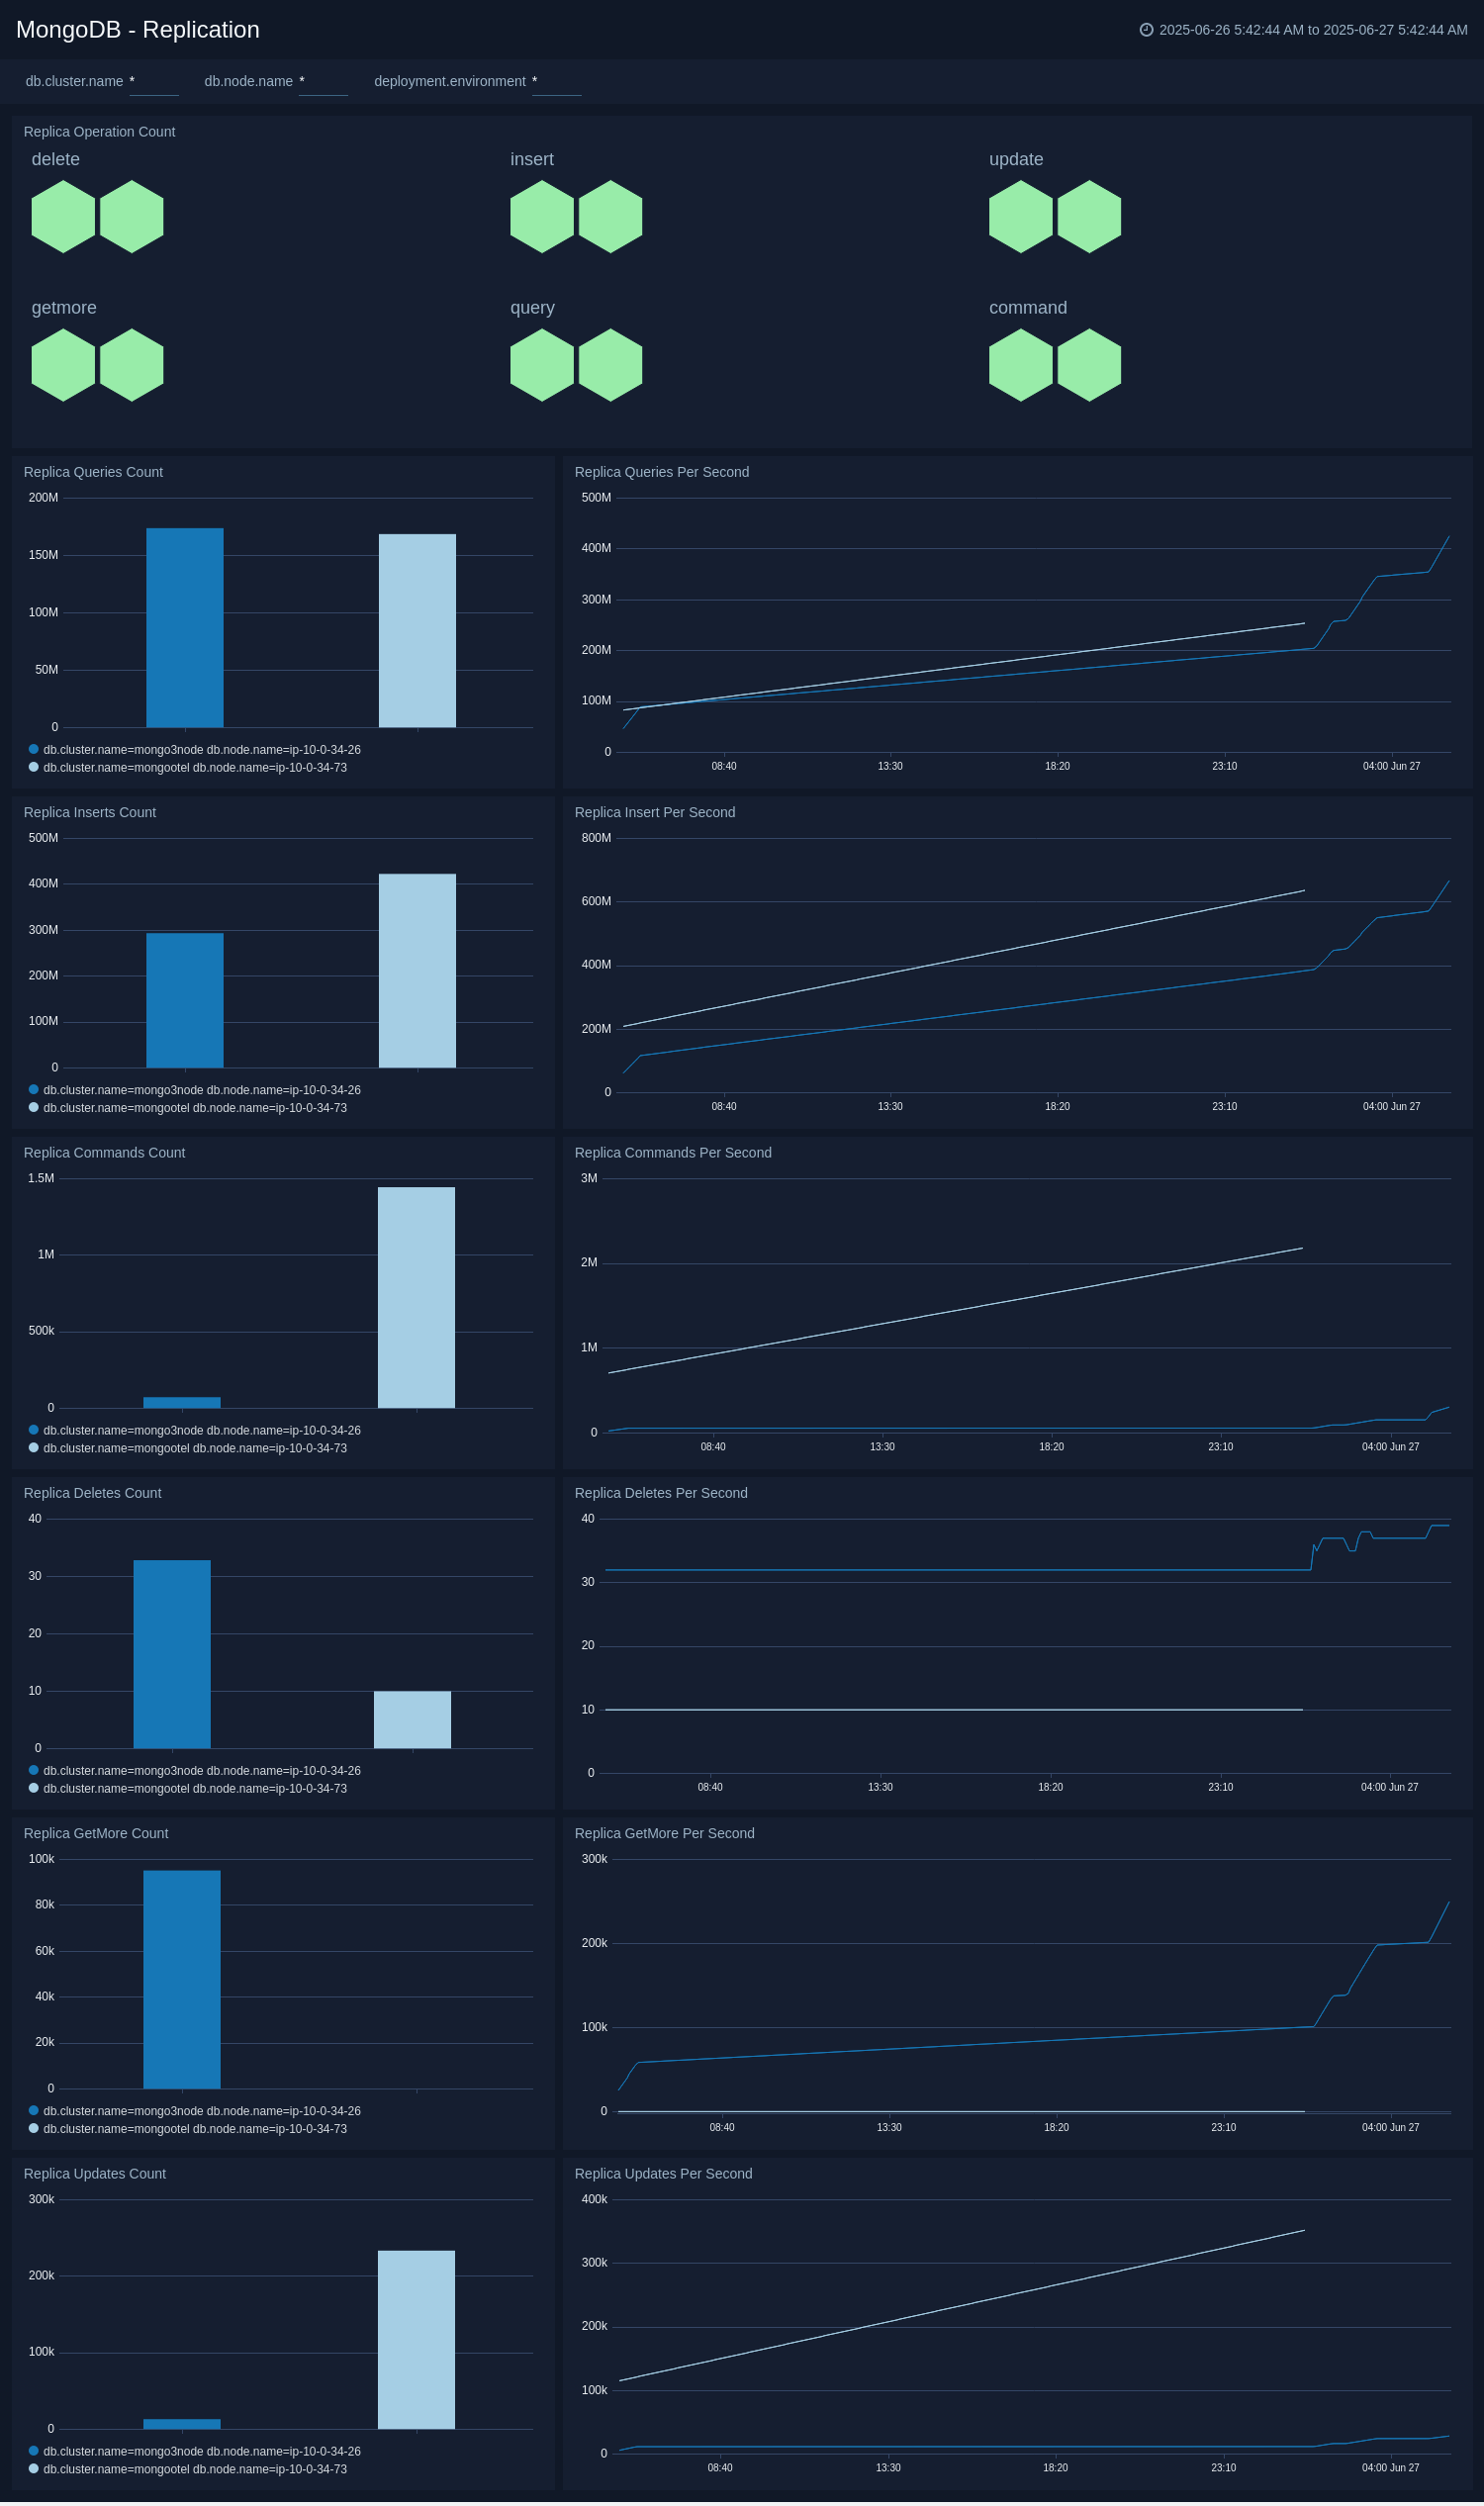
 ### Replication
The **MongoDB - Replication** dashboard displays the replication events, errors, warnings, and nodes information.
Use this dashboard to:
* Know different kind of operation count executed on replicas.
* Operation count like query, insert, and delete.
### Replication
The **MongoDB - Replication** dashboard displays the replication events, errors, warnings, and nodes information.
Use this dashboard to:
* Know different kind of operation count executed on replicas.
* Operation count like query, insert, and delete.
 ## Create monitors for MongoDB app
import CreateMonitors from '../../../reuse/apps/create-monitors.md';
### MongoDB alerts
| Name | Description | Alert Condition | Recover Condition |
|:--|:--|:--|:--|
| `MongoDB - Instance Down` | This alert is triggered when we detect that the MongoDB instance is down. | Missing Data | Data Found |
| `MongoDB - Replication Error` | This alert is triggered when we detect errors in MongoDB replication operations. | Count > 0 | Count < = 0 |
| `MongoDB - Replication Heartbeat Error` | This alert is triggered when we detect that the MongoDB Replication Heartbeat request has errors, which indicates replication is not working as expected. | Count > 0 | Count < = 0 |
| `MongoDB - Secondary Node Replication Failure` | This alert is triggered when we detect that a MongoDB secondary node is out of sync for replication. | Count > 0 | Count < = 0 |
| `MongoDB - Sharding Balancer Failure` | This alert is triggered when we detect that data balancing failed on a MongoDB Cluster with 1 mongos instance and 3 mongod instances. | Count > 0 | Count < = 0 |
| `MongoDB - Sharding Chunk Split Failure` | This alert is triggered when we detect that a MongoDB chunk not been split during sharding. | Count > 0 | Count < = 0 |
| `MongoDB - Sharding Error` | This alert is triggered when we detect errors in MongoDB sharding operations. | Count > 0 | Count < = 0 |
| `MongoDB - Sharding Warning` | This alert is triggered when we detect warnings in MongoDB sharding operations. | Count > 0 | Count < = 0 |
| `MongoDB - Slow Queries` | This alert is triggered when we detect that a MongoDB cluster is executing slow queries. | Count > 0 | Count < = 0 |
| `MongoDB - Too Many Connections` | This alert is triggered when we detect a given MongoDB server has too many connections (over 80% of capacity). | Count > = 80% | Count < 80% |
| `MongoDB - Too Many Cursors Open` | This alert is triggered when we detect that there are too many cursors (>10K) opened by MongoDB. | Count > = 10000 | Count < 10000 |
| `MongoDB - Too Many Cursors Timeouts` | This alert is triggered when we detect that there are too many cursors (100) timing out on a MongoDB server within a 5 minute time interval. | Count > = 100 | Count < 100 |
## Create monitors for MongoDB app
import CreateMonitors from '../../../reuse/apps/create-monitors.md';
### MongoDB alerts
| Name | Description | Alert Condition | Recover Condition |
|:--|:--|:--|:--|
| `MongoDB - Instance Down` | This alert is triggered when we detect that the MongoDB instance is down. | Missing Data | Data Found |
| `MongoDB - Replication Error` | This alert is triggered when we detect errors in MongoDB replication operations. | Count > 0 | Count < = 0 |
| `MongoDB - Replication Heartbeat Error` | This alert is triggered when we detect that the MongoDB Replication Heartbeat request has errors, which indicates replication is not working as expected. | Count > 0 | Count < = 0 |
| `MongoDB - Secondary Node Replication Failure` | This alert is triggered when we detect that a MongoDB secondary node is out of sync for replication. | Count > 0 | Count < = 0 |
| `MongoDB - Sharding Balancer Failure` | This alert is triggered when we detect that data balancing failed on a MongoDB Cluster with 1 mongos instance and 3 mongod instances. | Count > 0 | Count < = 0 |
| `MongoDB - Sharding Chunk Split Failure` | This alert is triggered when we detect that a MongoDB chunk not been split during sharding. | Count > 0 | Count < = 0 |
| `MongoDB - Sharding Error` | This alert is triggered when we detect errors in MongoDB sharding operations. | Count > 0 | Count < = 0 |
| `MongoDB - Sharding Warning` | This alert is triggered when we detect warnings in MongoDB sharding operations. | Count > 0 | Count < = 0 |
| `MongoDB - Slow Queries` | This alert is triggered when we detect that a MongoDB cluster is executing slow queries. | Count > 0 | Count < = 0 |
| `MongoDB - Too Many Connections` | This alert is triggered when we detect a given MongoDB server has too many connections (over 80% of capacity). | Count > = 80% | Count < 80% |
| `MongoDB - Too Many Cursors Open` | This alert is triggered when we detect that there are too many cursors (>10K) opened by MongoDB. | Count > = 10000 | Count < 10000 |
| `MongoDB - Too Many Cursors Timeouts` | This alert is triggered when we detect that there are too many cursors (100) timing out on a MongoDB server within a 5 minute time interval. | Count > = 100 | Count < 100 |