---
id: mysql-opentelemetry
title: MySQL - OpenTelemetry Collector
sidebar_label: MySQL - OTel Collector
description: Learn about the Sumo Logic OpenTelemetry app for MySQL.
slug: /help/docs/integrations/databases/opentelemetry/mysql-opentelemetry/
canonical: https://www.sumologic.com/help/docs/integrations/databases/opentelemetry/mysql-opentelemetry/
---
import useBaseUrl from '@docusaurus/useBaseUrl';
import Tabs from '@theme/Tabs';
import TabItem from '@theme/TabItem';
})
}) The Sumo Logic app for MySQL is a unified logs and metrics app that helps you monitor the availability, performance and resource utilization of MySQL database clusters. Preconfigured dashboards and searches provide insight into the health of your MySQL clusters, replication status, error logs, query performance, slow queries, Innodb operations, failed logins, and error logs.
This app supports MySQL version 8.0.
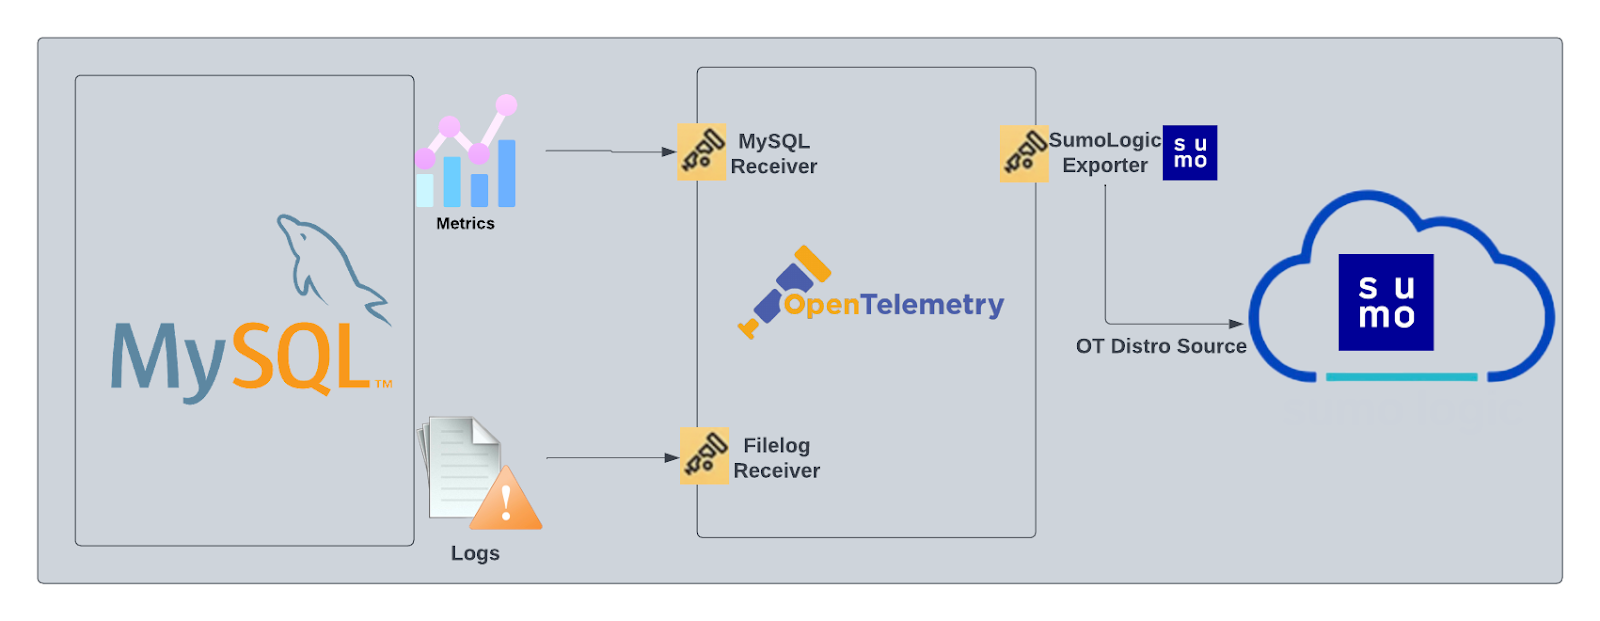
We use the OpenTelemetry collector for MySQL metric collection and for collecting MySQL logs.
The diagram below illustrates the components of the MySQL collection for each database server. OpenTelemetry collector runs on the same host as MySQL, and uses the [MySQL receiver](https://github.com/open-telemetry/opentelemetry-collector-contrib/tree/main/receiver/mysqlreceiver) to obtain MySQL metrics, and the [Sumo Logic OpenTelemetry Exporter](https://github.com/open-telemetry/opentelemetry-collector-contrib/tree/main/exporter/sumologicexporter) to send the metrics to Sumo Logic. MySQL logs are sent to Sumo Logic through a [filelog receiver](https://github.com/open-telemetry/opentelemetry-collector-contrib/tree/main/receiver/filelogreceiver).
The Sumo Logic app for MySQL is a unified logs and metrics app that helps you monitor the availability, performance and resource utilization of MySQL database clusters. Preconfigured dashboards and searches provide insight into the health of your MySQL clusters, replication status, error logs, query performance, slow queries, Innodb operations, failed logins, and error logs.
This app supports MySQL version 8.0.
We use the OpenTelemetry collector for MySQL metric collection and for collecting MySQL logs.
The diagram below illustrates the components of the MySQL collection for each database server. OpenTelemetry collector runs on the same host as MySQL, and uses the [MySQL receiver](https://github.com/open-telemetry/opentelemetry-collector-contrib/tree/main/receiver/mysqlreceiver) to obtain MySQL metrics, and the [Sumo Logic OpenTelemetry Exporter](https://github.com/open-telemetry/opentelemetry-collector-contrib/tree/main/exporter/sumologicexporter) to send the metrics to Sumo Logic. MySQL logs are sent to Sumo Logic through a [filelog receiver](https://github.com/open-telemetry/opentelemetry-collector-contrib/tree/main/receiver/filelogreceiver).
 :::info
This app includes [built-in monitors](#mysql-alerts). For details on creating custom monitors, refer to [Create monitors for MySQL app](#create-monitors-for-mysql-app).
:::
## Log and metrics types
The Sumo Logic app for MySQL assumes the default MySQL Error log file format for error logs, and the MySQL Slow Query file format for slow query logs. For a list of metrics that are collected and used by the app, see [MySQL Metrics](https://github.com/open-telemetry/opentelemetry-collector-contrib/blob/main/receiver/mysqlreceiver/documentation.md).
- The MySQL - Overview dashboard is based on logs from both the Error and Slow Query log formats, so as to correlate information between the two.
- Dashboards in the Metrics folder are based on MySQL metrics.
- Dashboards in the Logs folder are based on MySQL logs from both the Error and Slow Query log formats.
- Dashboards based on the Error format:
- MySQL - Error Logs
- MySQL - Failed Logins
- MySQL - Replication
- Dashboard based on Slow Query format:
- MySQL - Slow Queries
- MySQL General Health is based on logs from the MySQL Error log format.
- MySQL Replication is based on logs from the MySQL Error log format.
- MySQL Slow Queries is based on logs from the MySQL Slow Queries log format.
The MySQL app dashboards dependent on error logs are based on the message types ERROR, NOTE, Warning, and Info. For more details on the MySQL log file format, see [here](http://dev.mysql.com/doc/refman/5.5/en/server-logs.html).
## Fields creation in Sumo Logic for MySQL
Following are the [fields](/docs/manage/fields/) which will be created as part of MySQL app installation, if not already present.
- `db.cluster.name`. User configured. Enter a name to identify this MySQL cluster. This cluster name will be shown in the Sumo Logic dashboards.
- `db.system`. Has fixed value of **mysql**.
- `sumo.datasource`. Has fixed value of **mysql**.
- `db.node.name`. Has the value of host name of the machine which is being monitored.
## Prerequisites
### For metric collection
For metrics collection, you can find the prerequisites [here](https://github.com/open-telemetry/opentelemetry-collector-contrib/tree/main/receiver/mysqlreceiver#prerequisites).
### For log collection
Configure MySQL to log to a local file(s). MySQL logs written to a log file can be collected via the Local File Source of a Sumo Logic Installed Collector. To configure the MySQL log file(s), locate your local my.cnf configuration file in the database directory.
1. Open `my.cnf` in a text editor.
2. Set the following parameters in the `[mysqld]` section:
```sql
[mysqld]
log_error = /var/log/mysql/error.log
slow_query_log=1
slow_query_log_file = /var/log/mysql/mysql-slow.log
long_query_time=2
long_query_time=2
```
- **[Error Logs](https://dev.mysql.com/doc/refman/8.0/en/error-log.html)**. By default, error logs are enabled and are logged at file specified by the `log_error` key.
- **[Slow Query Logs](https://dev.mysql.com/doc/refman/8.0/en/slow-query-log.html)**. `slow_query_log=1` enables logging of slow queries to the file specified by `slow_query_log_file`. Setting `long_query_time=2` will cause queries that take more than two seconds to execute to be logged. The default value of `long_query_time` is 10 seconds.
- **[General Query Logs](https://dev.mysql.com/doc/refman/8.0/en/query-log.html)**. We do not recommend enabling `general_log` for performance reasons. These logs are not used by the Sumo Logic MySQL app.
3. Save the `my.cnf` file.
4. Restart the MySQL server: `sudo mysql.server restart`.
import LogsCollectionPrereqisites from '../../../reuse/apps/logs-collection-prereqisites.md';
For Windows system, log files which are collected should be accessible by SYSTEM group. Follow the set of below power shell command if SYSTEM group does not have the access.
```
$NewAcl = Get-Acl -Path ""
# Set properties
$identity = "NT AUTHORITY\SYSTEM"
$fileSystemRights = "ReadAndExecute"
$type = "Allow"
# Create new rule
$fileSystemAccessRuleArgumentList = $identity, $fileSystemRights, $type
$fileSystemAccessRule = New-Object -TypeName System.Security.AccessControl.FileSystemAccessRule -ArgumentList $fileSystemAccessRuleArgumentList
# Apply new rule
$NewAcl.SetAccessRule($fileSystemAccessRule)
Set-Acl -Path "" -AclObject $NewAcl
```
## Collection configuration and app installation
Follow these steps to set up and deploy the source template to collect data in Sumo Logic from a remotely managed OpenTelemetry collector.
### Step 1: Set up remotely managed OpenTelemetry collector
import OtelCollectorInstallation from '../../../reuse/apps/opentelemetry/otel-collector-installation.md';
:::note
If you want to configure your source locally, you can do so by downloading the YAML file. For details, see [Configure OpenTelemetry collectors locally](/docs/integrations/sumo-apps/opentelemetry-collector-insights/#configure-opentelemetry-collectors-locally).
:::
### Step 2: Configure the source template
import MysqlConfigureSourceTemplate from '../../../reuse/send-data/mysql-configure-source-template.md';
import TimestampParsing from '../../../reuse/apps/opentelemetry/timestamp-parsing.md';
import ProcessingRules from '../../../reuse/opentelemetry/processing-rules.md';
### Step 3: Push the source template to the desired remotely managed collectors
import DataConfiguration from '../../../reuse/apps/opentelemetry/data-configuration.md';
## Sample log messages
```json
{
log.file.name:"mysqld-error.log",
log:"2022-10-14T09:16:02.430542Z 63707 [Note] [MY-010926] [Server] Access denied for user 'root'@'ip-10-0-16-79' (using password: YES)"
}
```
## Sample metrics
```json
{"queryId":"A","_source":"sumo_hosted_collector_otel_mysql","operation":"deleted","metric":"mysql.row_operations","db.cluster.name":"sumoCluster_otel","_collectorId":"000000000C59BB2E","deployment.environment":"sumodev_otel","_sourceId":"0000000000000000","unit":"1","db.system":"mysql","_sourceHost":"sumoOtelMysql","_collector":"sumo_hosted_collector_otel_mysql","max":0,"min":0,"avg":0,"sum":0,"latest":0,"count":4}
```
## Sample queries
This sample query is from the **Top 10 Slow Queries by Average Execution Time** panel.
```sumo
db.system=mysql db.cluster.name={{db.cluster.name}} "User@Host" "Query_time"
| parse regex "(?# User@Host:[\S\s]+?SET timestamp=\d+;[\S\s]+?;)" multi
| parse regex field=query_block "# User@Host: \S+?\[(?\S*?)\] @ (?\S+)\s\[(?\S*?)\]" nodrop
| parse regex field=query_block "# User@Host: \S+?\[(?\S*?)\] @\s+\[(?\S*?)\]\s+Id:\s+(?\d{1,10})" nodrop | parse regex field=query_block "# User@Host: \S+?\[(?\S*?)\] @ (?\S+)\s\[(?\S*?)\]\s+Id:\s+(?\d{1,10})" | parse regex field=query_block "Schema: (?(?:\S*|\s)?)\s*Last_errno[\s\S]+?Query_time:\s+(?[\d.]*)\s+Lock_time:\s+(?[\d.]*)\s+Rows_sent:\s+(?[\d.]*)\s+Rows_examined:\s+(?[\d.]*)\s+Rows_affected:\s+(?[\d.]*)\s+Rows_read:\s+(?[\d.]*)\n" nodrop | parse regex field=query_block "Schema: (?(?:\S*|\s)?)\s*Last_errno[\s\S]+?\s+Killed:\s+\d+\n" nodrop | parse regex field=query_block "Query_time:\s+(?[\d.]*)\s+Lock_time:\s+(?[\d.]*)\s+Rows_sent:\s+(?[\d]*)\s+Rows_examined:\s+(?[\d]*)\s+Rows_affected:\s+(?[\d]*)\s+" nodrop | parse regex field=query_block "Query_time:\s+(?[\d.]*)\s+Lock_time:\s+(?[\d.]*)\s+Rows_sent:\s+(?[\d]*)\s+Rows_examined:\s+(?[\d]*)"
| parse regex field=query_block "# Bytes_sent:\s+(?\d*)\s+Tmp_tables:\s+(?\d*)\s+Tmp_disk_tables:\s+(?\d*)\s+Tmp_table_sizes:\s+(?\d*)\n" nodrop | parse regex field=query_block "# Bytes_sent:\s+(?\d*)\n" nodrop | parse regex field=query_block "SET timestamp=(?\d*);(?:\\n|\n)(?[\s\S]*);" nodrop
| fields -query_block
| avg(query_time) as avg_time, sum(query_time) as total_time, min(query_time) as min_time, max(query_time) as max_time, avg(rows_examined) as avg_rows_examined, avg(rows_sent) as avg_rows_sent, avg(Lock_Time) as avg_lock_time, count as frequency group by sql_cmd, db.cluster.name
| sort by avg_time | limit 10
```
This sample metrics query is from the **FSync Op Count** panel.
```sql title="Sample metrics query"
sumo.datasource=mysql deployment.environment=* db.cluster.name=* db.node.name=* metric=mysql.operations operation=fsyncs | sum
```
## Viewing MySQL dashboards
All dashboards have a set of filters that you can apply to the entire dashboard. Use these filters to drill down and examine the data to a granular level.
- You can change the time range for a dashboard or panel by selecting a predefined interval from a drop-down list, choosing a recently used time range, or specifying custom dates and times. [Learn more](/docs/dashboards/set-custom-time-ranges/).
- You can use template variables to drill down and examine the data on a granular level. For more information, see [Filtering Dashboards with Template Variables](/docs/dashboards/filter-template-variables/).
### Overview
The **MySQL - Overview** dashboard gives you an at-a-glance view of the state of your database clusters by monitoring key cluster information such as errors, failed logins, errors, queries executed, slow queries, lock waits, and uptime.
Use this dashboard to:
- Quickly identify the state of a given database cluster.
:::info
This app includes [built-in monitors](#mysql-alerts). For details on creating custom monitors, refer to [Create monitors for MySQL app](#create-monitors-for-mysql-app).
:::
## Log and metrics types
The Sumo Logic app for MySQL assumes the default MySQL Error log file format for error logs, and the MySQL Slow Query file format for slow query logs. For a list of metrics that are collected and used by the app, see [MySQL Metrics](https://github.com/open-telemetry/opentelemetry-collector-contrib/blob/main/receiver/mysqlreceiver/documentation.md).
- The MySQL - Overview dashboard is based on logs from both the Error and Slow Query log formats, so as to correlate information between the two.
- Dashboards in the Metrics folder are based on MySQL metrics.
- Dashboards in the Logs folder are based on MySQL logs from both the Error and Slow Query log formats.
- Dashboards based on the Error format:
- MySQL - Error Logs
- MySQL - Failed Logins
- MySQL - Replication
- Dashboard based on Slow Query format:
- MySQL - Slow Queries
- MySQL General Health is based on logs from the MySQL Error log format.
- MySQL Replication is based on logs from the MySQL Error log format.
- MySQL Slow Queries is based on logs from the MySQL Slow Queries log format.
The MySQL app dashboards dependent on error logs are based on the message types ERROR, NOTE, Warning, and Info. For more details on the MySQL log file format, see [here](http://dev.mysql.com/doc/refman/5.5/en/server-logs.html).
## Fields creation in Sumo Logic for MySQL
Following are the [fields](/docs/manage/fields/) which will be created as part of MySQL app installation, if not already present.
- `db.cluster.name`. User configured. Enter a name to identify this MySQL cluster. This cluster name will be shown in the Sumo Logic dashboards.
- `db.system`. Has fixed value of **mysql**.
- `sumo.datasource`. Has fixed value of **mysql**.
- `db.node.name`. Has the value of host name of the machine which is being monitored.
## Prerequisites
### For metric collection
For metrics collection, you can find the prerequisites [here](https://github.com/open-telemetry/opentelemetry-collector-contrib/tree/main/receiver/mysqlreceiver#prerequisites).
### For log collection
Configure MySQL to log to a local file(s). MySQL logs written to a log file can be collected via the Local File Source of a Sumo Logic Installed Collector. To configure the MySQL log file(s), locate your local my.cnf configuration file in the database directory.
1. Open `my.cnf` in a text editor.
2. Set the following parameters in the `[mysqld]` section:
```sql
[mysqld]
log_error = /var/log/mysql/error.log
slow_query_log=1
slow_query_log_file = /var/log/mysql/mysql-slow.log
long_query_time=2
long_query_time=2
```
- **[Error Logs](https://dev.mysql.com/doc/refman/8.0/en/error-log.html)**. By default, error logs are enabled and are logged at file specified by the `log_error` key.
- **[Slow Query Logs](https://dev.mysql.com/doc/refman/8.0/en/slow-query-log.html)**. `slow_query_log=1` enables logging of slow queries to the file specified by `slow_query_log_file`. Setting `long_query_time=2` will cause queries that take more than two seconds to execute to be logged. The default value of `long_query_time` is 10 seconds.
- **[General Query Logs](https://dev.mysql.com/doc/refman/8.0/en/query-log.html)**. We do not recommend enabling `general_log` for performance reasons. These logs are not used by the Sumo Logic MySQL app.
3. Save the `my.cnf` file.
4. Restart the MySQL server: `sudo mysql.server restart`.
import LogsCollectionPrereqisites from '../../../reuse/apps/logs-collection-prereqisites.md';
For Windows system, log files which are collected should be accessible by SYSTEM group. Follow the set of below power shell command if SYSTEM group does not have the access.
```
$NewAcl = Get-Acl -Path ""
# Set properties
$identity = "NT AUTHORITY\SYSTEM"
$fileSystemRights = "ReadAndExecute"
$type = "Allow"
# Create new rule
$fileSystemAccessRuleArgumentList = $identity, $fileSystemRights, $type
$fileSystemAccessRule = New-Object -TypeName System.Security.AccessControl.FileSystemAccessRule -ArgumentList $fileSystemAccessRuleArgumentList
# Apply new rule
$NewAcl.SetAccessRule($fileSystemAccessRule)
Set-Acl -Path "" -AclObject $NewAcl
```
## Collection configuration and app installation
Follow these steps to set up and deploy the source template to collect data in Sumo Logic from a remotely managed OpenTelemetry collector.
### Step 1: Set up remotely managed OpenTelemetry collector
import OtelCollectorInstallation from '../../../reuse/apps/opentelemetry/otel-collector-installation.md';
:::note
If you want to configure your source locally, you can do so by downloading the YAML file. For details, see [Configure OpenTelemetry collectors locally](/docs/integrations/sumo-apps/opentelemetry-collector-insights/#configure-opentelemetry-collectors-locally).
:::
### Step 2: Configure the source template
import MysqlConfigureSourceTemplate from '../../../reuse/send-data/mysql-configure-source-template.md';
import TimestampParsing from '../../../reuse/apps/opentelemetry/timestamp-parsing.md';
import ProcessingRules from '../../../reuse/opentelemetry/processing-rules.md';
### Step 3: Push the source template to the desired remotely managed collectors
import DataConfiguration from '../../../reuse/apps/opentelemetry/data-configuration.md';
## Sample log messages
```json
{
log.file.name:"mysqld-error.log",
log:"2022-10-14T09:16:02.430542Z 63707 [Note] [MY-010926] [Server] Access denied for user 'root'@'ip-10-0-16-79' (using password: YES)"
}
```
## Sample metrics
```json
{"queryId":"A","_source":"sumo_hosted_collector_otel_mysql","operation":"deleted","metric":"mysql.row_operations","db.cluster.name":"sumoCluster_otel","_collectorId":"000000000C59BB2E","deployment.environment":"sumodev_otel","_sourceId":"0000000000000000","unit":"1","db.system":"mysql","_sourceHost":"sumoOtelMysql","_collector":"sumo_hosted_collector_otel_mysql","max":0,"min":0,"avg":0,"sum":0,"latest":0,"count":4}
```
## Sample queries
This sample query is from the **Top 10 Slow Queries by Average Execution Time** panel.
```sumo
db.system=mysql db.cluster.name={{db.cluster.name}} "User@Host" "Query_time"
| parse regex "(?# User@Host:[\S\s]+?SET timestamp=\d+;[\S\s]+?;)" multi
| parse regex field=query_block "# User@Host: \S+?\[(?\S*?)\] @ (?\S+)\s\[(?\S*?)\]" nodrop
| parse regex field=query_block "# User@Host: \S+?\[(?\S*?)\] @\s+\[(?\S*?)\]\s+Id:\s+(?\d{1,10})" nodrop | parse regex field=query_block "# User@Host: \S+?\[(?\S*?)\] @ (?\S+)\s\[(?\S*?)\]\s+Id:\s+(?\d{1,10})" | parse regex field=query_block "Schema: (?(?:\S*|\s)?)\s*Last_errno[\s\S]+?Query_time:\s+(?[\d.]*)\s+Lock_time:\s+(?[\d.]*)\s+Rows_sent:\s+(?[\d.]*)\s+Rows_examined:\s+(?[\d.]*)\s+Rows_affected:\s+(?[\d.]*)\s+Rows_read:\s+(?[\d.]*)\n" nodrop | parse regex field=query_block "Schema: (?(?:\S*|\s)?)\s*Last_errno[\s\S]+?\s+Killed:\s+\d+\n" nodrop | parse regex field=query_block "Query_time:\s+(?[\d.]*)\s+Lock_time:\s+(?[\d.]*)\s+Rows_sent:\s+(?[\d]*)\s+Rows_examined:\s+(?[\d]*)\s+Rows_affected:\s+(?[\d]*)\s+" nodrop | parse regex field=query_block "Query_time:\s+(?[\d.]*)\s+Lock_time:\s+(?[\d.]*)\s+Rows_sent:\s+(?[\d]*)\s+Rows_examined:\s+(?[\d]*)"
| parse regex field=query_block "# Bytes_sent:\s+(?\d*)\s+Tmp_tables:\s+(?\d*)\s+Tmp_disk_tables:\s+(?\d*)\s+Tmp_table_sizes:\s+(?\d*)\n" nodrop | parse regex field=query_block "# Bytes_sent:\s+(?\d*)\n" nodrop | parse regex field=query_block "SET timestamp=(?\d*);(?:\\n|\n)(?[\s\S]*);" nodrop
| fields -query_block
| avg(query_time) as avg_time, sum(query_time) as total_time, min(query_time) as min_time, max(query_time) as max_time, avg(rows_examined) as avg_rows_examined, avg(rows_sent) as avg_rows_sent, avg(Lock_Time) as avg_lock_time, count as frequency group by sql_cmd, db.cluster.name
| sort by avg_time | limit 10
```
This sample metrics query is from the **FSync Op Count** panel.
```sql title="Sample metrics query"
sumo.datasource=mysql deployment.environment=* db.cluster.name=* db.node.name=* metric=mysql.operations operation=fsyncs | sum
```
## Viewing MySQL dashboards
All dashboards have a set of filters that you can apply to the entire dashboard. Use these filters to drill down and examine the data to a granular level.
- You can change the time range for a dashboard or panel by selecting a predefined interval from a drop-down list, choosing a recently used time range, or specifying custom dates and times. [Learn more](/docs/dashboards/set-custom-time-ranges/).
- You can use template variables to drill down and examine the data on a granular level. For more information, see [Filtering Dashboards with Template Variables](/docs/dashboards/filter-template-variables/).
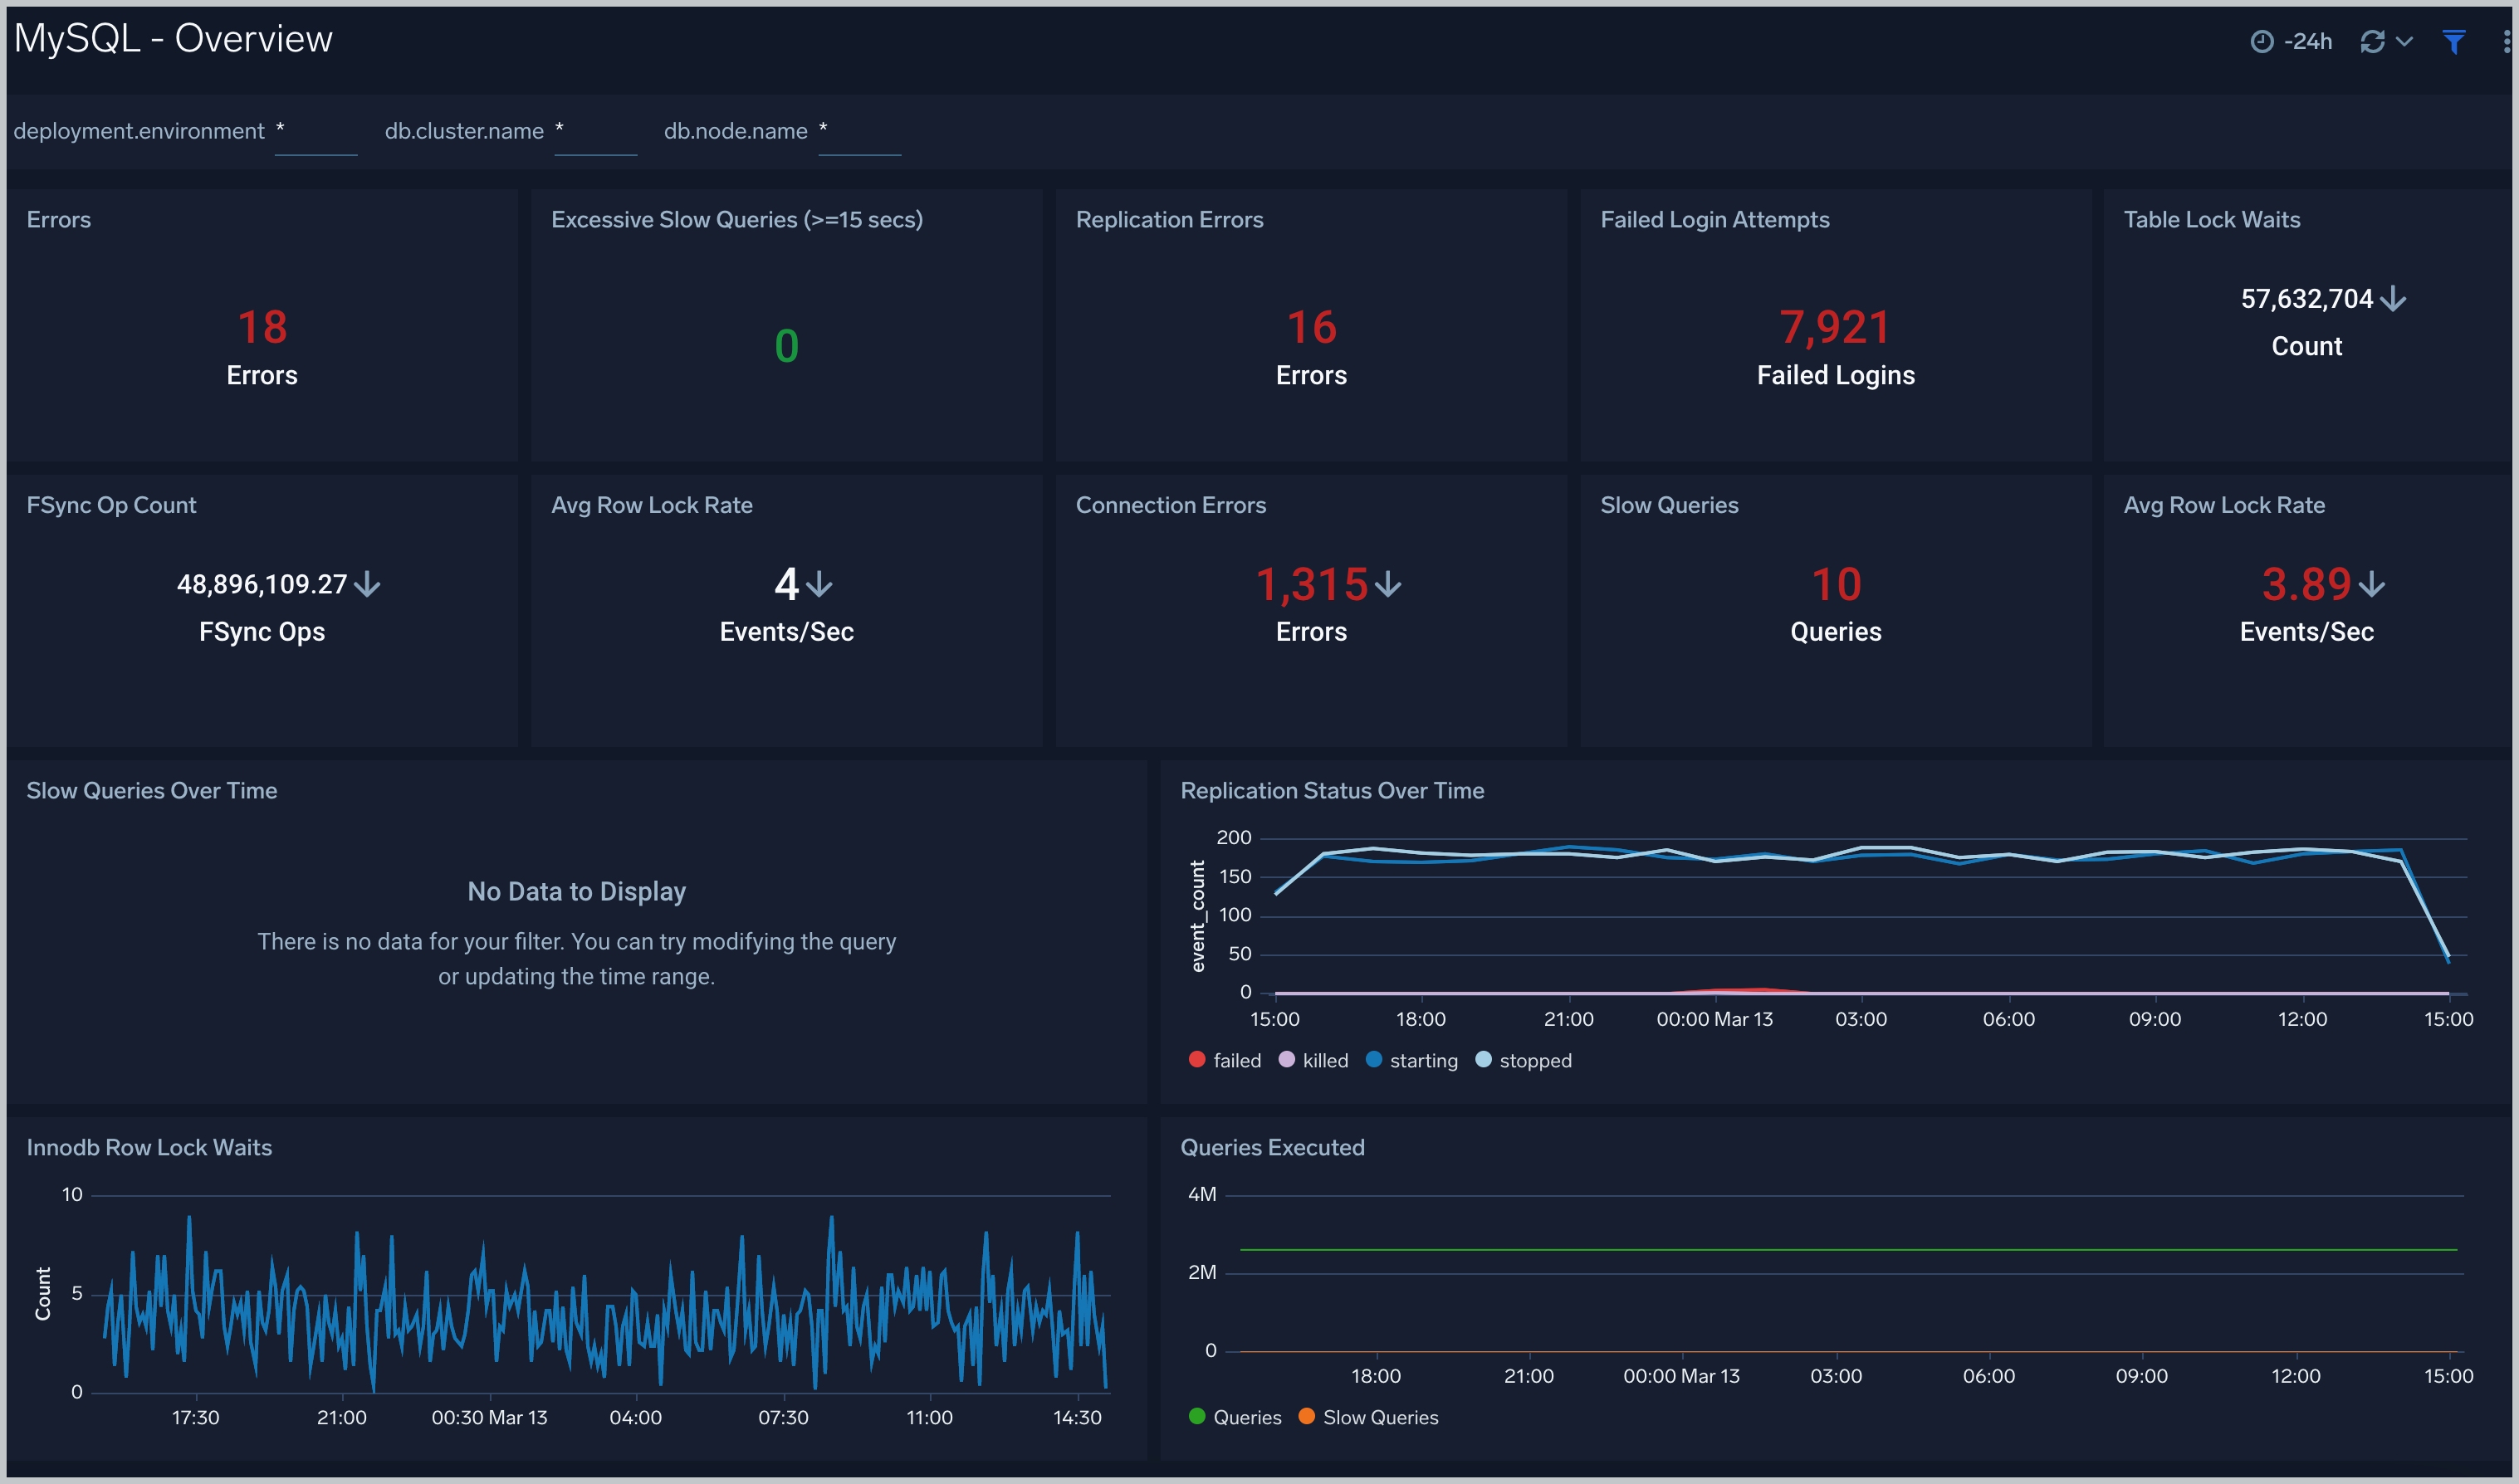
### Overview
The **MySQL - Overview** dashboard gives you an at-a-glance view of the state of your database clusters by monitoring key cluster information such as errors, failed logins, errors, queries executed, slow queries, lock waits, and uptime.
Use this dashboard to:
- Quickly identify the state of a given database cluster.
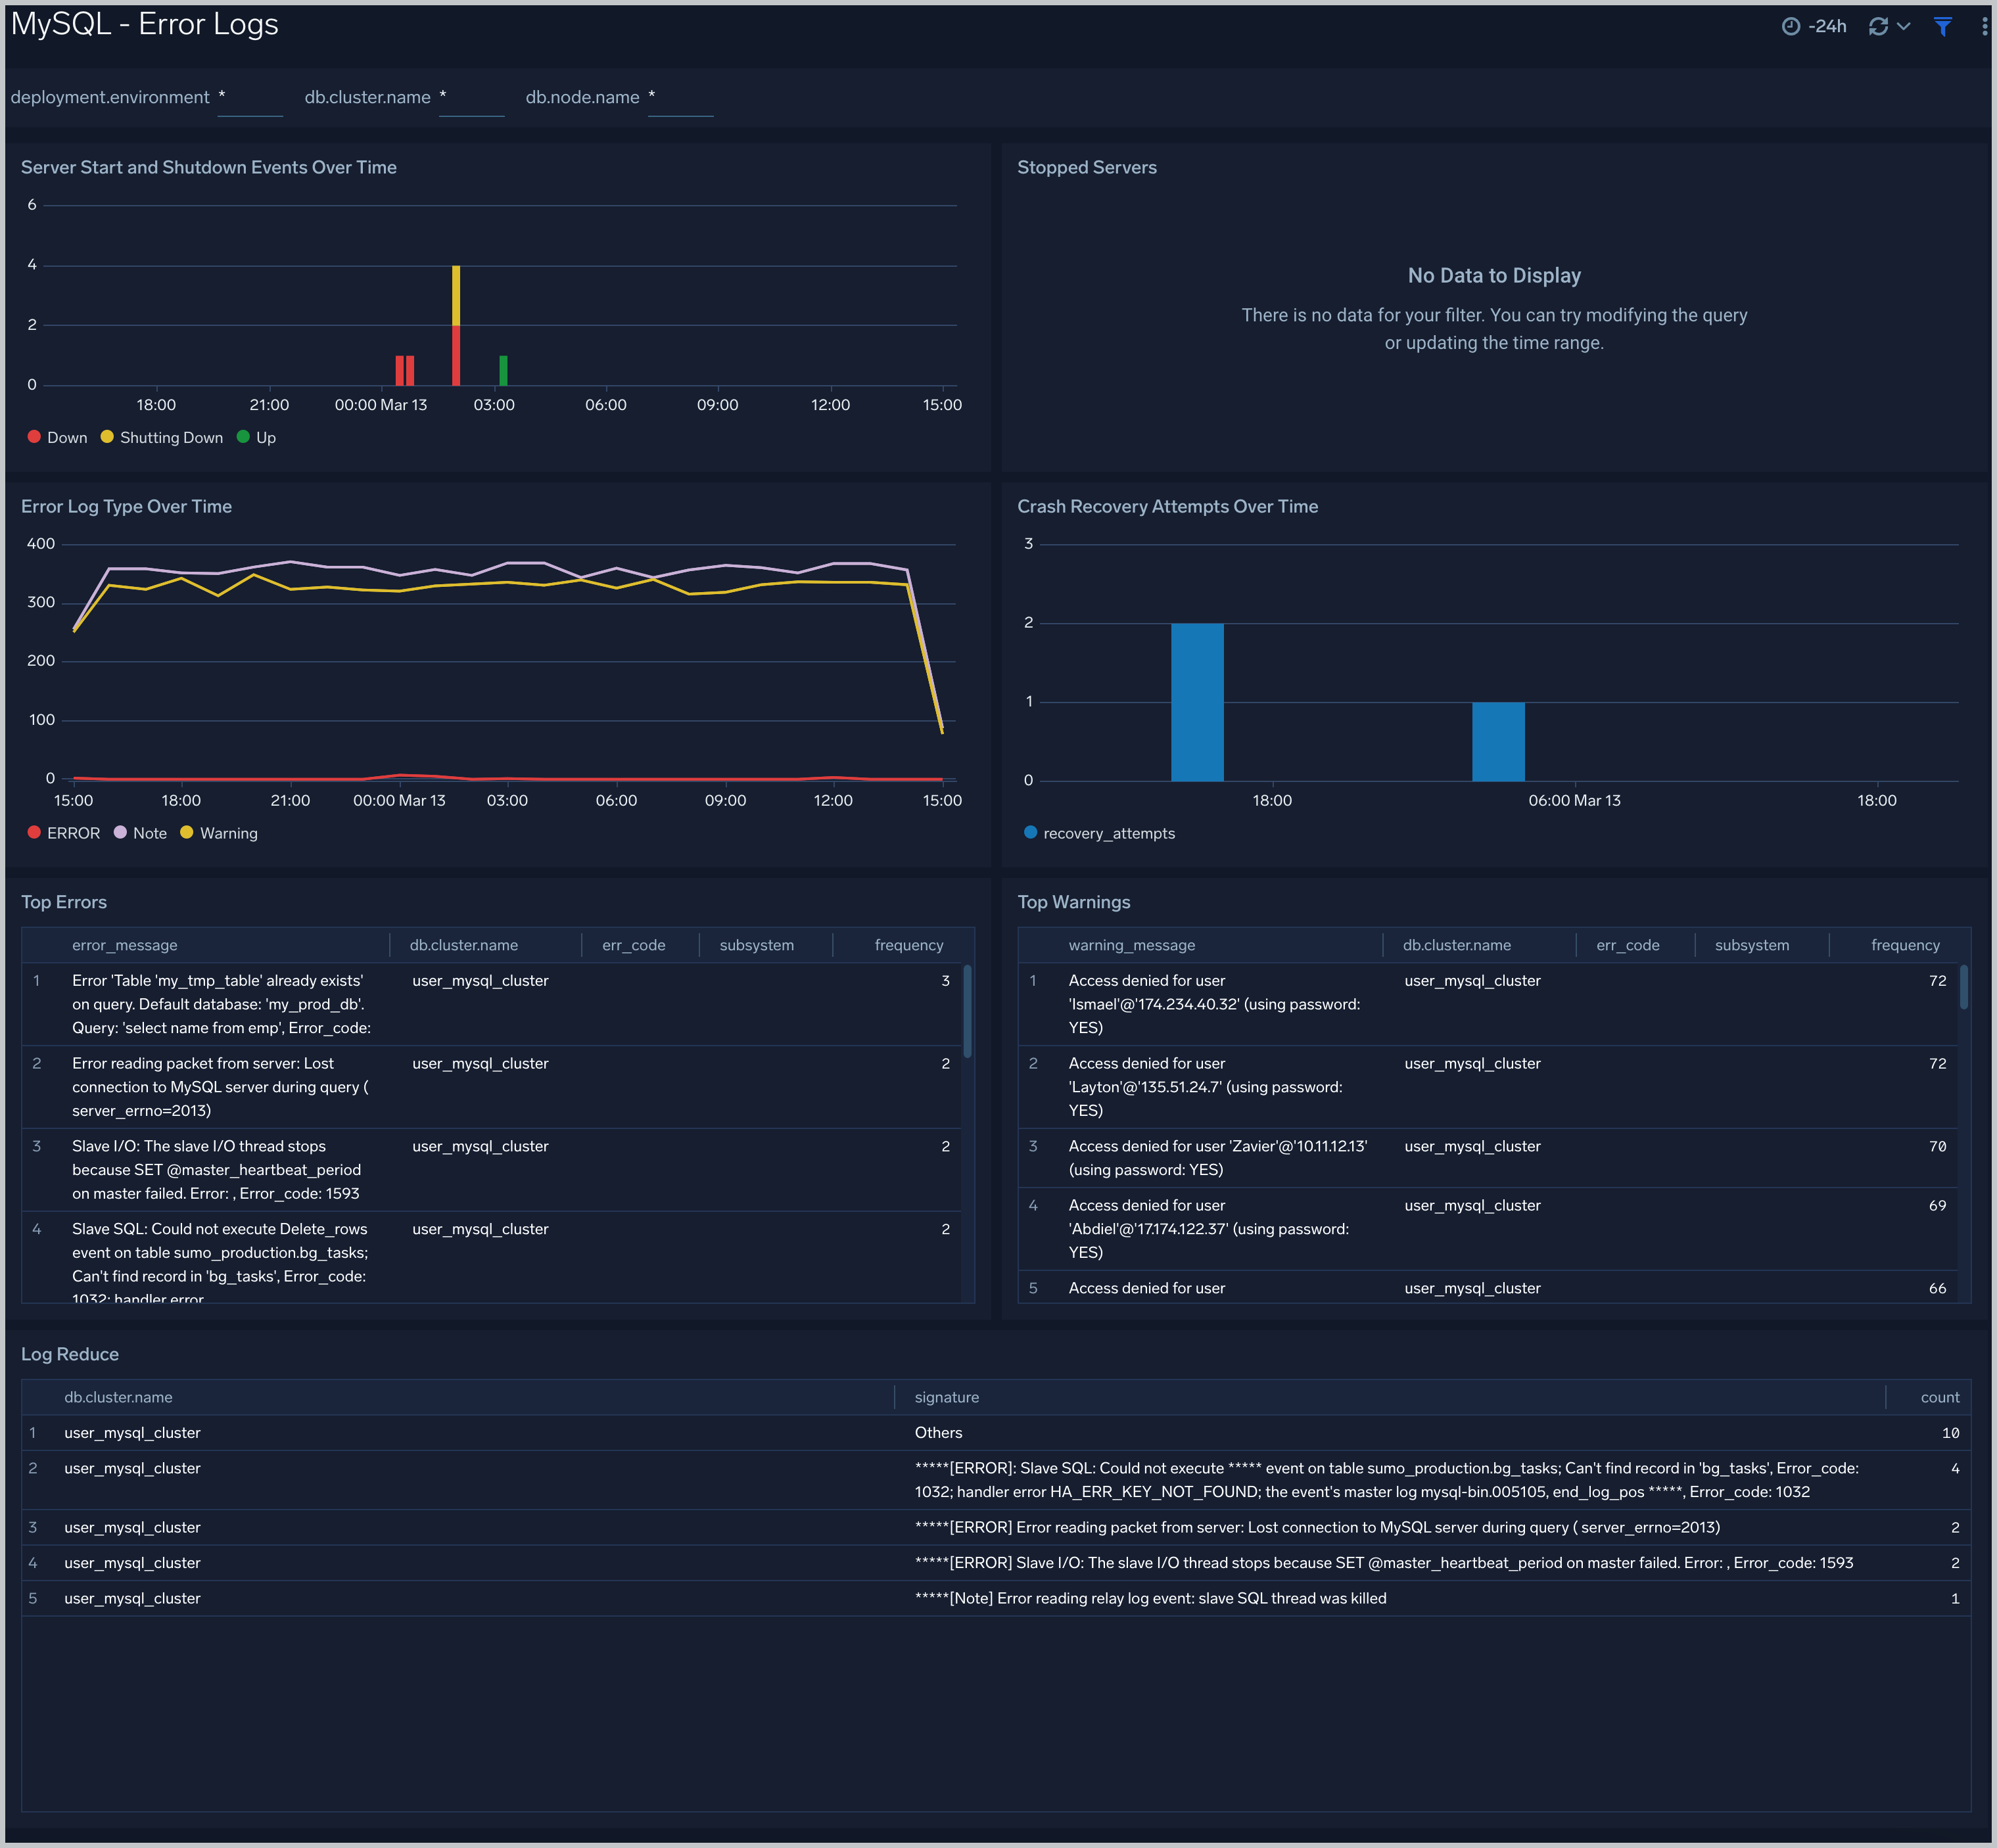
 ### Error Logs
The **MySQL - Error Logs** dashboard provides insight into database error logs by specifically monitoring database shutdown/start events, errors over time, errors, warnings, and crash recovery attempts.
Use this dashboard to:
- Quickly identify errors and patterns in logs for troubleshooting.
- Monitor trends in error logs and identify outliers.
- Ensure that server start, server stop and crash recovery events are in line with expectations.
- Dashboard filters allow you to narrow a search for database cluster.
### Error Logs
The **MySQL - Error Logs** dashboard provides insight into database error logs by specifically monitoring database shutdown/start events, errors over time, errors, warnings, and crash recovery attempts.
Use this dashboard to:
- Quickly identify errors and patterns in logs for troubleshooting.
- Monitor trends in error logs and identify outliers.
- Ensure that server start, server stop and crash recovery events are in line with expectations.
- Dashboard filters allow you to narrow a search for database cluster.
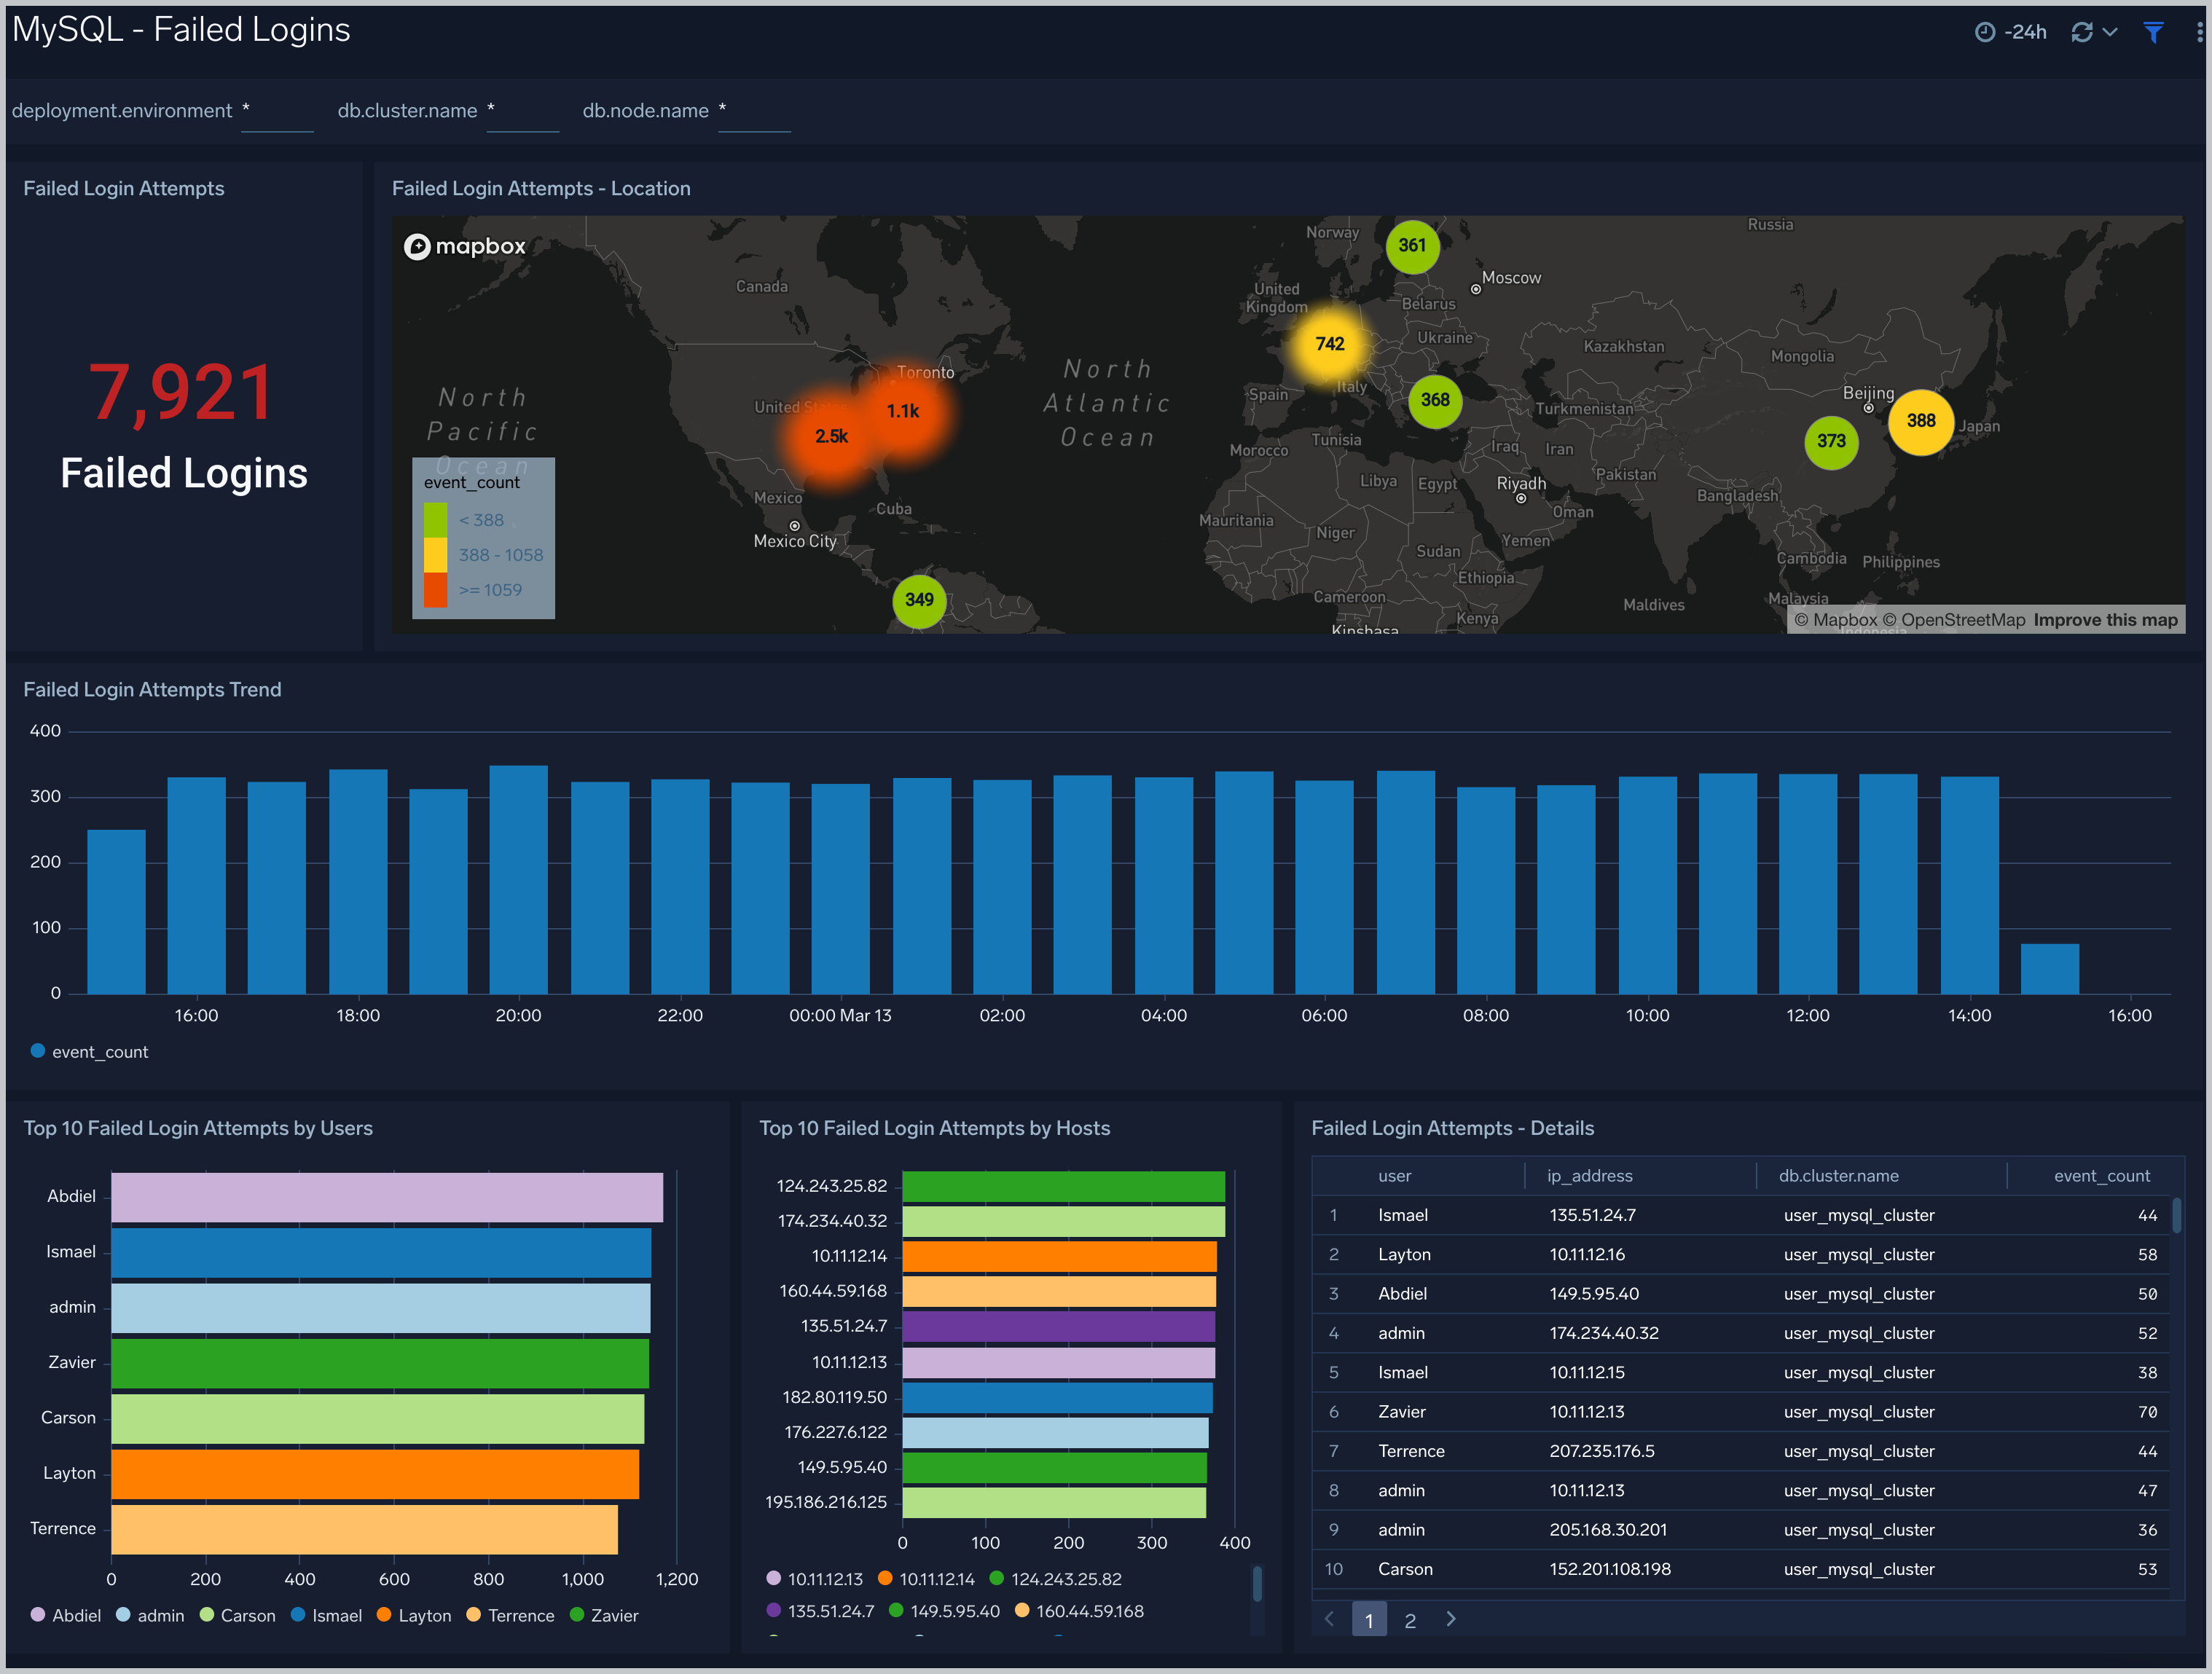
 ### Failed Logins
The **MySQL - Failed Logins** dashboard provides insights into all failed login attempts by location, users and hosts.
Use this dashboard to:
- Monitor all failed login attempts and identify any unusual or suspicious activity.
### Failed Logins
The **MySQL - Failed Logins** dashboard provides insights into all failed login attempts by location, users and hosts.
Use this dashboard to:
- Monitor all failed login attempts and identify any unusual or suspicious activity.
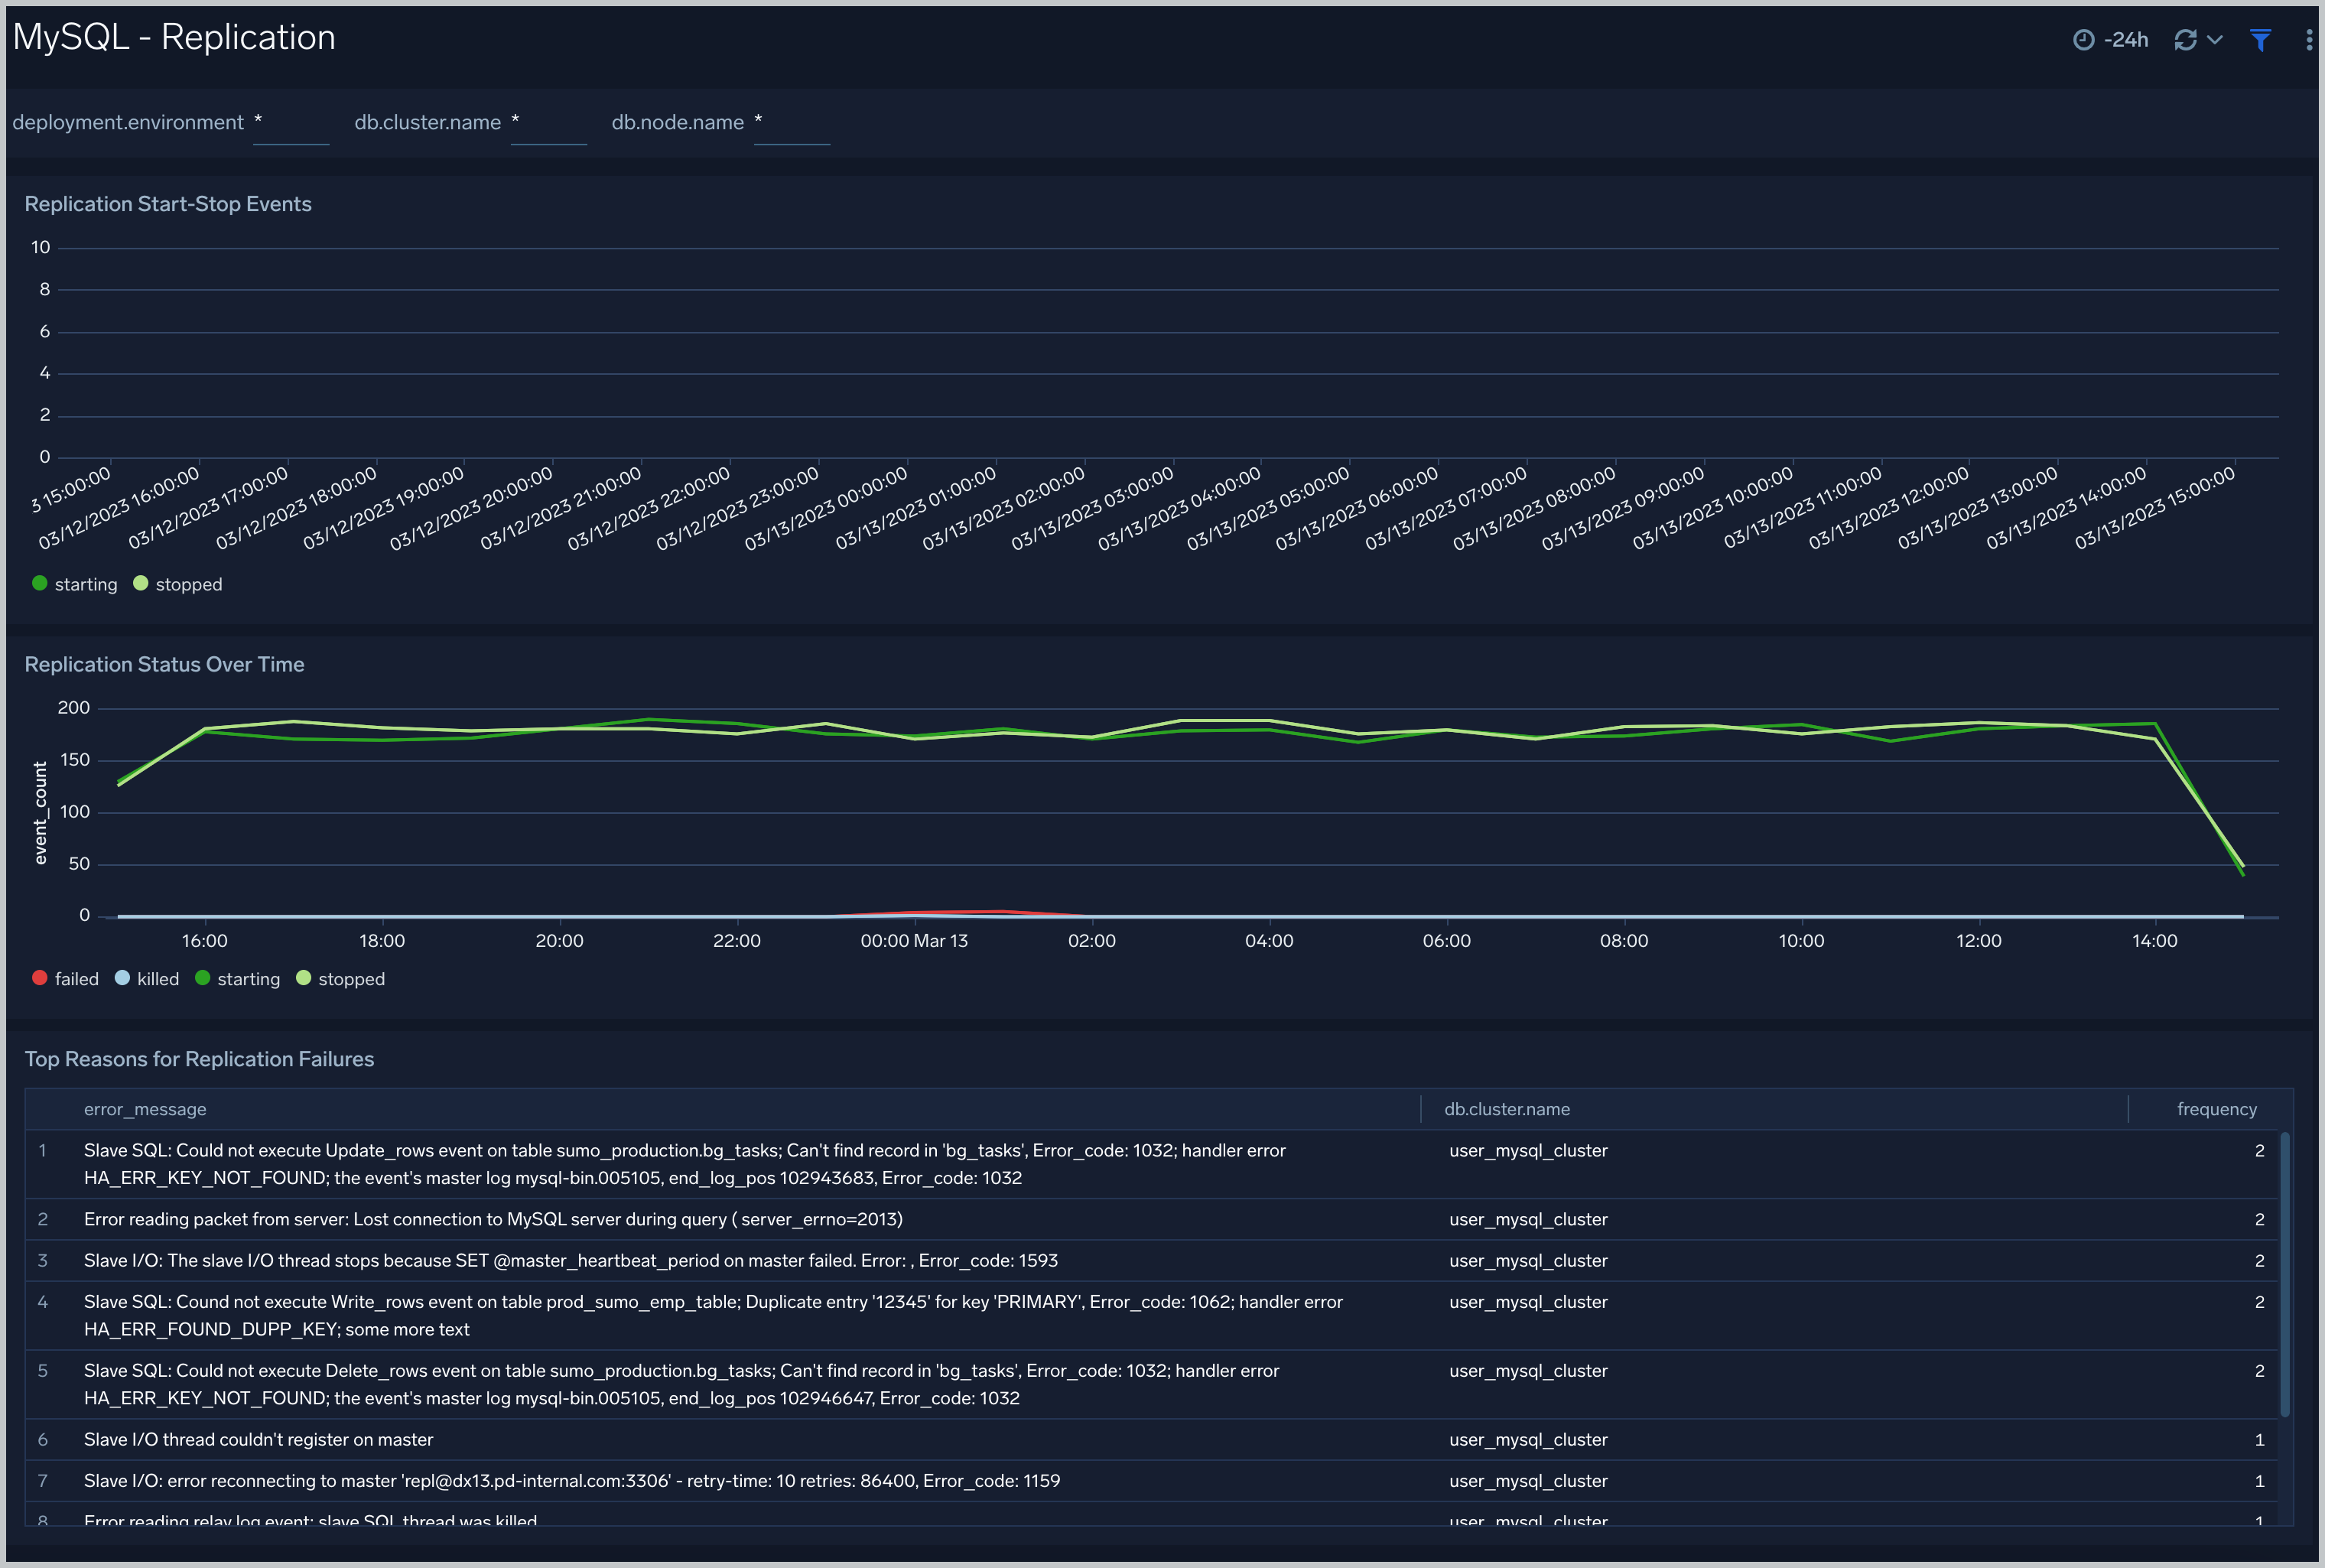
 ### Replication
The **MySQL - Replication** dashboard provides insights into the state of database replication.
Use this dashboard to:
- Quickly determine reasons for replication failures.
- Monitor replication status trends.
### Replication
The **MySQL - Replication** dashboard provides insights into the state of database replication.
Use this dashboard to:
- Quickly determine reasons for replication failures.
- Monitor replication status trends.
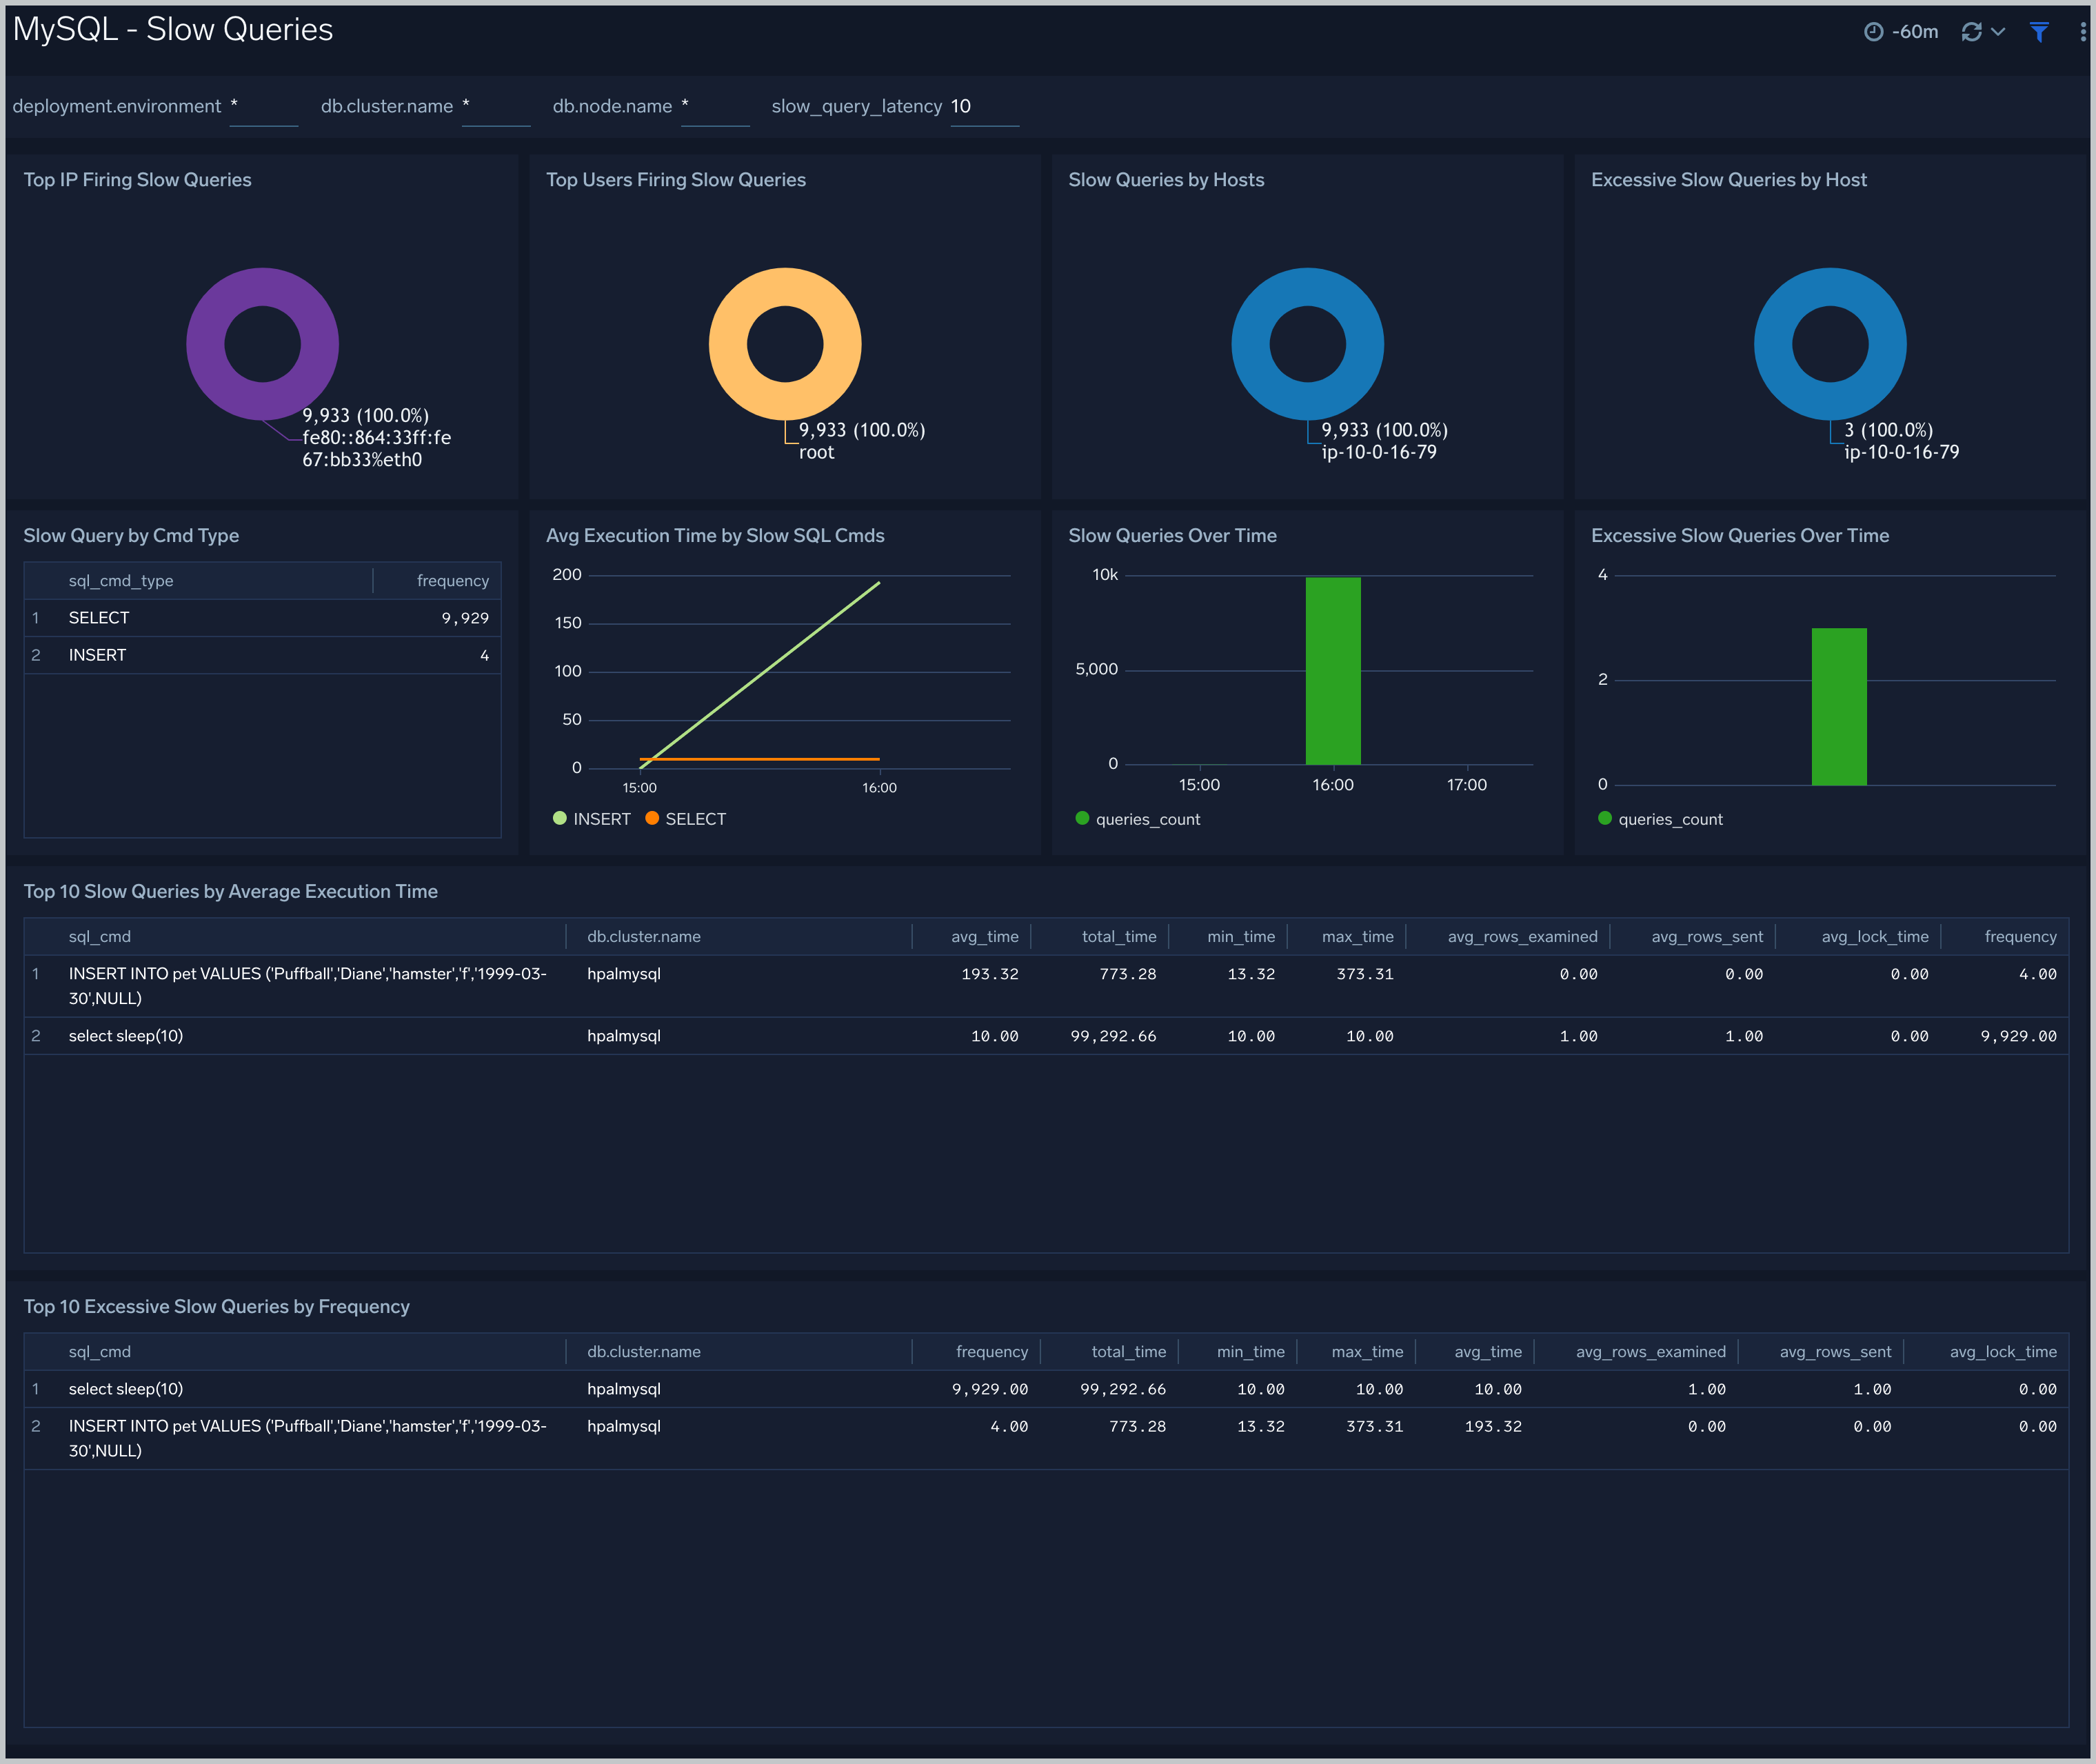
 ### Slow Queries
The **MySQL - Slow Queries** dashboard provides insights into all slow queries executed on the database.
Note: Slow queries are queries that take 10 seconds or more to execute (default value is 10 seconds as per mysql configuration which can be altered) and excessive slow queries are those that take 15 seconds or more to execute.
Use this dashboard to:
- Identify all slow queries
- Quickly determine which queries have been identified as slow or excessive slow queries.
- Monitor users and hosts running slow queries.
- Determine which SQL commands are slower than others.
- Examine slow query trends to determine if there are periodic performance bottlenecks in your database clusters.
### Slow Queries
The **MySQL - Slow Queries** dashboard provides insights into all slow queries executed on the database.
Note: Slow queries are queries that take 10 seconds or more to execute (default value is 10 seconds as per mysql configuration which can be altered) and excessive slow queries are those that take 15 seconds or more to execute.
Use this dashboard to:
- Identify all slow queries
- Quickly determine which queries have been identified as slow or excessive slow queries.
- Monitor users and hosts running slow queries.
- Determine which SQL commands are slower than others.
- Examine slow query trends to determine if there are periodic performance bottlenecks in your database clusters.
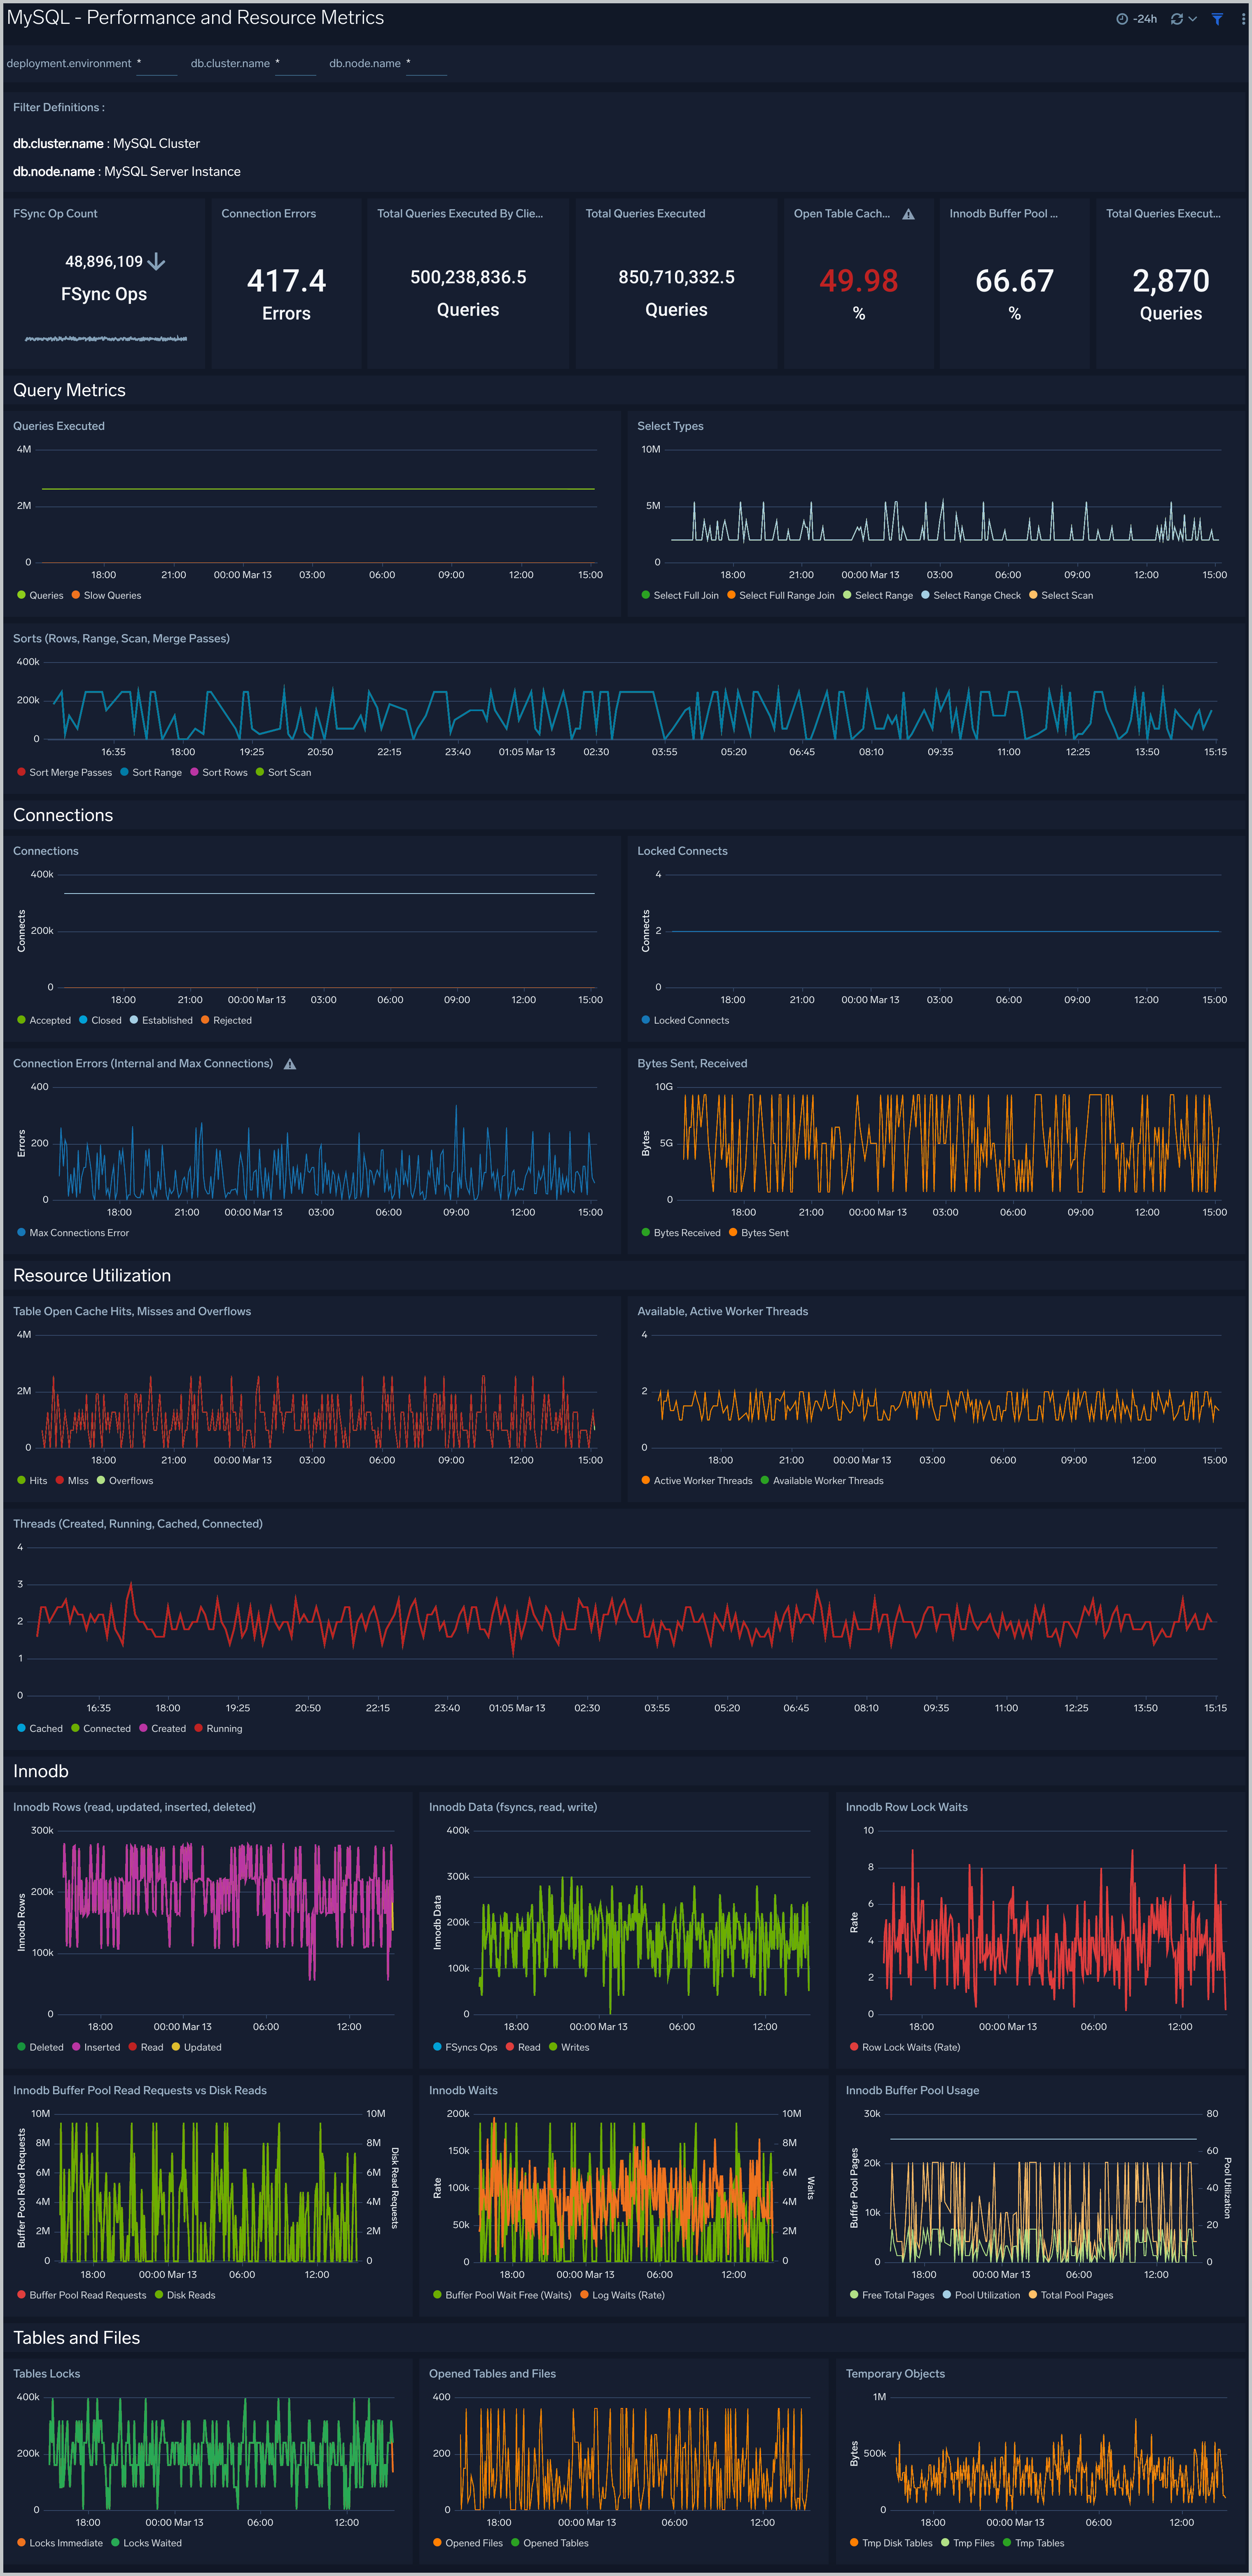
 ### Performance and Resource Metrics
The **MySQL - Performance and Resource Metrics** dashboard allows you to monitor the performance and resource usage of your database clusters.
Use this dashboard to:
- Understand the behavior and performance of your database clusters.
- Monitor key operational metrics around threads running, innodb waits, and locks.
- Monitor query execution trends to ensure they match up with expectations.
- Dashboard filters allow you to narrow a search for a specific database cluster.
### Performance and Resource Metrics
The **MySQL - Performance and Resource Metrics** dashboard allows you to monitor the performance and resource usage of your database clusters.
Use this dashboard to:
- Understand the behavior and performance of your database clusters.
- Monitor key operational metrics around threads running, innodb waits, and locks.
- Monitor query execution trends to ensure they match up with expectations.
- Dashboard filters allow you to narrow a search for a specific database cluster.
 ## Create monitors for MySQL app
import CreateMonitors from '../../../reuse/apps/create-monitors.md';
### MySQL alerts
| Alert Name | Alert Description and conditions | Alert Condition | Recover Condition |
|:--|:--|:--|:--|
| `MySQL - Excessive Slow Query Detected Alert` | This alert gets triggered when we detect the average time to execute a query is more than 15 seconds over a 24 hour time-period. | Count > = 100 | Count < 100 |
| `MySQL - Follower replication lag detected Alert` | This alert gets triggered when we detect that the average replication lag is greater than or equal to 900 seconds within a 5 minute time interval. | Count > = 900 | Count < 900 |
| `MySQL - High average query run time Alert` | This alert gets triggered when the average run time of SQL queries for a given schema is greater than or equal to one second within a time interval of 5 minutes. | Count > = 10 | Count < 10 |
| `MySQL - High Innodb buffer pool utilization Alert` | This alert gets triggered when we detect that the InnoDB buffer pool utilization is high (>=90%) within a 5 minute time interval. | Count > = 90 | Count < 90 |
| `MySQL - Instance down Alert` | This alert gets triggered when we detect that a MySQL instance is down within last 5 minutes interval. | Count > = 1 | Count < 1 |
| `MySQL - Large number of statement errors Alert` | This alert gets triggered when we detect that there are 5 or more statement errors within a 5 minute time interval. | Count > = 5 | Count < 5 |
| `MySQL - Large number of statement warnings Alert` | This alert gets triggered when we detect that there are 20 or more statement warnings within a 5 minute time interval. | Count > = 20 | Count < 20 |
| `MySQL - No index used in the SQL statements Alert` | This alert gets triggered when we detect that there are 5 or more statements not using an index in the SQL query within a 5 minute time interval. | Count > = 5 | Count < 5 |
## Create monitors for MySQL app
import CreateMonitors from '../../../reuse/apps/create-monitors.md';
### MySQL alerts
| Alert Name | Alert Description and conditions | Alert Condition | Recover Condition |
|:--|:--|:--|:--|
| `MySQL - Excessive Slow Query Detected Alert` | This alert gets triggered when we detect the average time to execute a query is more than 15 seconds over a 24 hour time-period. | Count > = 100 | Count < 100 |
| `MySQL - Follower replication lag detected Alert` | This alert gets triggered when we detect that the average replication lag is greater than or equal to 900 seconds within a 5 minute time interval. | Count > = 900 | Count < 900 |
| `MySQL - High average query run time Alert` | This alert gets triggered when the average run time of SQL queries for a given schema is greater than or equal to one second within a time interval of 5 minutes. | Count > = 10 | Count < 10 |
| `MySQL - High Innodb buffer pool utilization Alert` | This alert gets triggered when we detect that the InnoDB buffer pool utilization is high (>=90%) within a 5 minute time interval. | Count > = 90 | Count < 90 |
| `MySQL - Instance down Alert` | This alert gets triggered when we detect that a MySQL instance is down within last 5 minutes interval. | Count > = 1 | Count < 1 |
| `MySQL - Large number of statement errors Alert` | This alert gets triggered when we detect that there are 5 or more statement errors within a 5 minute time interval. | Count > = 5 | Count < 5 |
| `MySQL - Large number of statement warnings Alert` | This alert gets triggered when we detect that there are 20 or more statement warnings within a 5 minute time interval. | Count > = 20 | Count < 20 |
| `MySQL - No index used in the SQL statements Alert` | This alert gets triggered when we detect that there are 5 or more statements not using an index in the SQL query within a 5 minute time interval. | Count > = 5 | Count < 5 |