---
id: postgresql-opentelemetry
title: PostgreSQL - OpenTelemetry Collector
sidebar_label: PostgreSQL - OTel Collector
description: Learn about the Sumo Logic OpenTelemetry app for PostgreSQL.
slug: /help/docs/integrations/databases/opentelemetry/postgresql-opentelemetry/
canonical: https://www.sumologic.com/help/docs/integrations/databases/opentelemetry/postgresql-opentelemetry/
---
import useBaseUrl from '@docusaurus/useBaseUrl';
import Tabs from '@theme/Tabs';
import TabItem from '@theme/TabItem';
})
}) [PostgreSQL](https://www.postgresql.org/) is an open source object-relational database that extends the robustness SQL language to safely store and scale extensive data workloads.
The Sumo Logic app for PostgreSQL includes predefined searches and dashboards that allow you to monitor logs and metrics for the database. The logs enable you to monitor database activity, user activity, incoming connections, query execution time, and errors. The metrics allow you to monitor database resource utilization and throughput performance.
This app supports PostgreSQL version 13+.
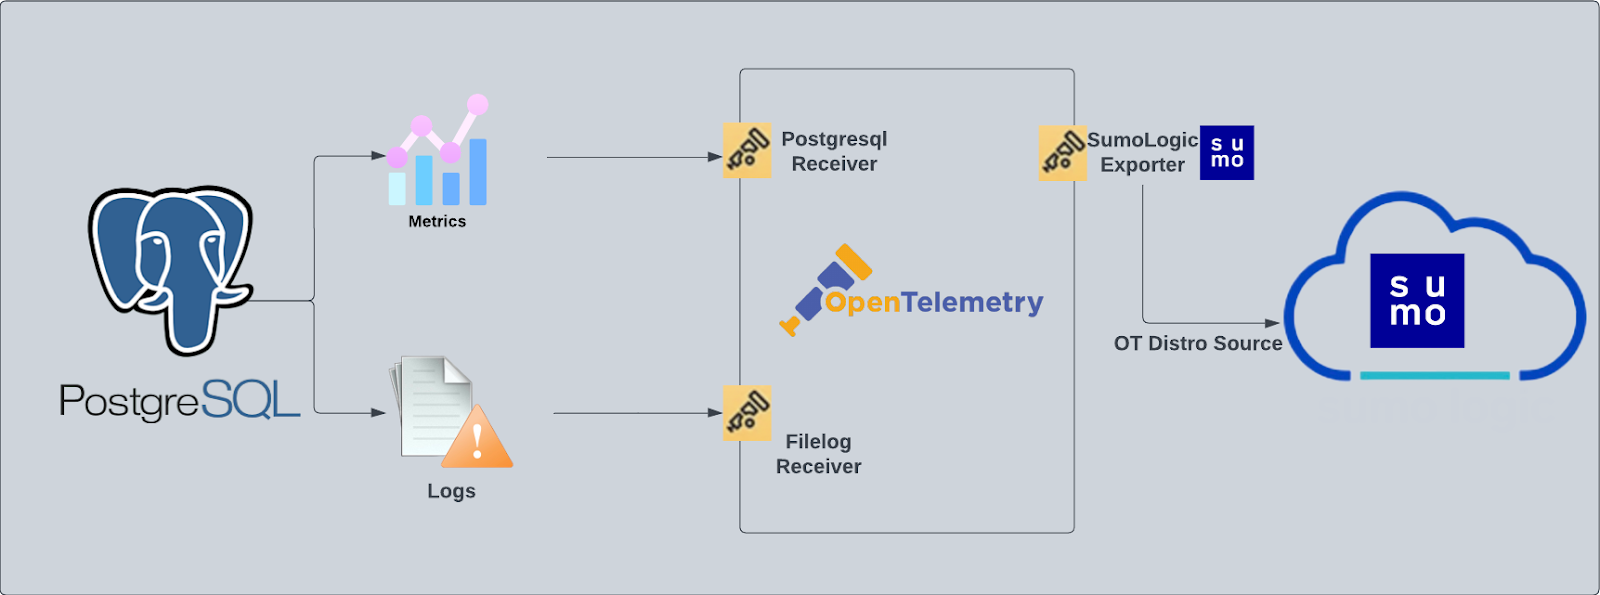
We use the OpenTelemetry collector for PostgreSQL metric collection and for collecting PostgreSQL logs.
The diagram below illustrates the components of the PostgreSQL collection for each database server. OpenTelemetry collector runs on the same host as PostgreSQL, and uses the [PostgreSQL receiver](https://github.com/open-telemetry/opentelemetry-collector-contrib/tree/main/receiver/postgresqlreceiver) to obtain PostgreSQL metrics, and the [Sumo Logic OpenTelemetry Exporter](https://github.com/open-telemetry/opentelemetry-collector-contrib/tree/main/exporter/sumologicexporter) to send the metrics to Sumo Logic. PostgreSQL logs are sent to Sumo Logic through a [filelog receiver](https://github.com/open-telemetry/opentelemetry-collector-contrib/tree/main/receiver/filelogreceiver).
[PostgreSQL](https://www.postgresql.org/) is an open source object-relational database that extends the robustness SQL language to safely store and scale extensive data workloads.
The Sumo Logic app for PostgreSQL includes predefined searches and dashboards that allow you to monitor logs and metrics for the database. The logs enable you to monitor database activity, user activity, incoming connections, query execution time, and errors. The metrics allow you to monitor database resource utilization and throughput performance.
This app supports PostgreSQL version 13+.
We use the OpenTelemetry collector for PostgreSQL metric collection and for collecting PostgreSQL logs.
The diagram below illustrates the components of the PostgreSQL collection for each database server. OpenTelemetry collector runs on the same host as PostgreSQL, and uses the [PostgreSQL receiver](https://github.com/open-telemetry/opentelemetry-collector-contrib/tree/main/receiver/postgresqlreceiver) to obtain PostgreSQL metrics, and the [Sumo Logic OpenTelemetry Exporter](https://github.com/open-telemetry/opentelemetry-collector-contrib/tree/main/exporter/sumologicexporter) to send the metrics to Sumo Logic. PostgreSQL logs are sent to Sumo Logic through a [filelog receiver](https://github.com/open-telemetry/opentelemetry-collector-contrib/tree/main/receiver/filelogreceiver).
 :::info
This app includes [built-in monitors](#postgresql-alerts). For details on creating custom monitors, refer to [Create monitors for PostgreSQL app](#create-monitors-for-postgresql-app).
:::
## Fields creation in Sumo Logic for PostgreSQL
Following are the tags that will be created as part of PostgreSQL app installation, if not already present:
- **db.cluster.name**. User configured. Enter a name to identify this PostgreSQL cluster. This cluster name will be shown in the Sumo Logic dashboards.
- **db.system**. Has a fixed value of **postgresql**.
- **sumo.datasource**. Has a fixed value of **postgresql**.
- **db.node.name**. Has a value of the host name of the machine which is being monitored.
## Prerequisites
### For metrics collection
- This collection queries the PostgreSQL [statistics collector](https://www.postgresql.org/docs/9.6/monitoring-stats.html).
- This receiver supports PostgreSQL version 13+.
- The monitoring user must be granted **SELECT** on the `pg_stat_database`.
### For logs collection
Configure logging in PostgreSQL:
1. Locate your local PostgreSQL postgresql.conf configuration file in the database data_directory. For more information, see the [PostgreSQL File Locations documentation](https://www.postgresql.org/docs/9.1/static/runtime-config-file-locations.html). By default it's located in `/var/lib/pgsql//data/postgresql.conf`. You can run SHOW config_file command inside your server's psql shell to get the location. After determining the location of conf file, modify the PostgreSQL postgresql.conf configuration file logging parameters
2. Connect to the database server (using SSH) in a terminal window.
3. Open `postgresql.conf` configuration file.
4. Under the ERROR REPORTING AND LOGGING section of the file, use the following config parameters. For more information on the following parameters, [click here](https://www.postgresql.org/docs/12/static/runtime-config-logging.html).
```sql
log_destination = 'stderr'
logging_collector = on
log_filename = 'postgresql-%Y-%m-%d_%H%M%S.log'
log_truncate_on_rotation = off
log_rotation_age = 1d
log_min_duration_statement = 250
log_connections = on
log_duration = on
log_hostname = on
log_timezone = 'UTC'
log_min_messages = 'WARNING'
log_line_prefix = '%m [%p] %q%u@%d '
```
5. Save the `postgresql.conf` file and restart the postgresql server:
```sh
sudo service postgresql restart
```
import LogsCollectionPrereqisites from '../../../reuse/apps/logs-collection-prereqisites.md';
For Windows systems, log files which are collected should be accessible by the SYSTEM group. Use the following set of PowerShell commands if the SYSTEM group does not have access.
```
$NewAcl = Get-Acl -Path ""
# Set properties
$identity = "NT AUTHORITY\SYSTEM"
$fileSystemRights = "ReadAndExecute"
$type = "Allow"
# Create new rule
$fileSystemAccessRuleArgumentList = $identity, $fileSystemRights, $type
$fileSystemAccessRule = New-Object -TypeName System.Security.AccessControl.FileSystemAccessRule -ArgumentList $fileSystemAccessRuleArgumentList
# Apply new rule
$NewAcl.SetAccessRule($fileSystemAccessRule)
Set-Acl -Path "" -AclObject $NewAcl
```
## Collection configuration and app installation
Follow these steps to set up and deploy the source template to collect data in Sumo Logic from a remotely managed OpenTelemetry collector.
### Step 1: Set up remotely managed OpenTelemetry collector
import OtelCollectorInstallation from '../../../reuse/apps/opentelemetry/otel-collector-installation.md';
:::note
If you want to configure your source locally, you can do so by downloading the YAML file. For details, see [Configure OpenTelemetry collectors locally](/docs/integrations/sumo-apps/opentelemetry-collector-insights/#configure-opentelemetry-collectors-locally).
:::
### Step 2: Configure the source template
import PostgresqlConfigureSourceTemplate from '../../../reuse/send-data/postgresql-configure-source-template.md';
import TimestampParsing from '../../../reuse/apps/opentelemetry/timestamp-parsing.md';
import ProcessingRules from '../../../reuse/opentelemetry/processing-rules.md';
### Step 3: Push the source template to the desired remotely managed collectors
import DataConfiguration from '../../../reuse/apps/opentelemetry/data-configuration.md';
## Sample metrics
```sql
{"queryId":"A","_source":"postgresql-metric-otel","source":"idx_read","db.table":"company","_sourceName":"Http Input","host":"ip-172-31-91-203.ec2.internal","os.type":"linux","sumo.datasource":"postgresql","db.system":"postgresql","postgresql.database.name":"postgres","_sourceCategory":"Labs/postgresql-otel/metric","deployment.environment":"postgresqlEnvanema","_contentType":"Carbon2","metric":"postgresql.blocks_read","_collectorId":"000000000CD05E30","db.schema":"public","_sourceId":"000000004453F6D9","unit":"1","db.cluster.name":"postgresqlOtelClusteranema","postgresql.table.name":"public.company","_collector":"Labs - postgresql-otel","max":5,"min":0,"avg":1.92,"sum":115,"latest":0,"count":60}
```
## Sample queries
This sample query is from the **PostgreSQL - Overview** dashboard, **Fatal Errors** panel.
```sumo
sumo.datasource=postgresql db.cluster.name=*
| json auto maxdepth 1 nodrop
| if (isEmpty(log), _raw, log) as _raw
| parse "* * * [*] *@* *: *" as date,time,time_zone,thread_id,user,db,severity,msg
| where severity IN ("ERROR", "FATAL")
| count by date, time, severity, db, user, msg
```
This sample query is from the **PostgreSQL - Database Metrics** dashboard, **Number of Active Databases** panel.
```sql
sumo.datasource=postgresql deployment.environment=* db.cluster.name=* metric=postgresql.backends postgresql.database.name=* db.node.name=* | count by postgresql.database.name | count
```
## Viewing PostgreSQL dashboards
All dashboards have a set of filters that you can apply to the entire dashboard. Use these filters to drill down and examine the data to a granular level.
- You can change the time range for a dashboard or panel by selecting a predefined interval from a drop-down list, choosing a recently used time range, or specifying custom dates and times. [Learn more](/docs/dashboards/set-custom-time-ranges/).
- You can use template variables to drill down and examine the data on a granular level. For more information, see [Filtering Dashboards with Template Variables](/docs/dashboards/filter-template-variables/).
### Overview
The **PostgreSQL - Overview** dashboard gives you an at-a-glance view of the state of your database clusters by monitoring errors, failed logins, slow queries and trends over time.
Use this dashboard to:
- Determine the number of active databases and clusters.
- Drill-down into database errors, failed logins and slow queries.
- Determine if your database or queries need to be tuned based on comparing the number of slow queries.
- Active deadlock value and tuple operations trends.
:::info
This app includes [built-in monitors](#postgresql-alerts). For details on creating custom monitors, refer to [Create monitors for PostgreSQL app](#create-monitors-for-postgresql-app).
:::
## Fields creation in Sumo Logic for PostgreSQL
Following are the tags that will be created as part of PostgreSQL app installation, if not already present:
- **db.cluster.name**. User configured. Enter a name to identify this PostgreSQL cluster. This cluster name will be shown in the Sumo Logic dashboards.
- **db.system**. Has a fixed value of **postgresql**.
- **sumo.datasource**. Has a fixed value of **postgresql**.
- **db.node.name**. Has a value of the host name of the machine which is being monitored.
## Prerequisites
### For metrics collection
- This collection queries the PostgreSQL [statistics collector](https://www.postgresql.org/docs/9.6/monitoring-stats.html).
- This receiver supports PostgreSQL version 13+.
- The monitoring user must be granted **SELECT** on the `pg_stat_database`.
### For logs collection
Configure logging in PostgreSQL:
1. Locate your local PostgreSQL postgresql.conf configuration file in the database data_directory. For more information, see the [PostgreSQL File Locations documentation](https://www.postgresql.org/docs/9.1/static/runtime-config-file-locations.html). By default it's located in `/var/lib/pgsql//data/postgresql.conf`. You can run SHOW config_file command inside your server's psql shell to get the location. After determining the location of conf file, modify the PostgreSQL postgresql.conf configuration file logging parameters
2. Connect to the database server (using SSH) in a terminal window.
3. Open `postgresql.conf` configuration file.
4. Under the ERROR REPORTING AND LOGGING section of the file, use the following config parameters. For more information on the following parameters, [click here](https://www.postgresql.org/docs/12/static/runtime-config-logging.html).
```sql
log_destination = 'stderr'
logging_collector = on
log_filename = 'postgresql-%Y-%m-%d_%H%M%S.log'
log_truncate_on_rotation = off
log_rotation_age = 1d
log_min_duration_statement = 250
log_connections = on
log_duration = on
log_hostname = on
log_timezone = 'UTC'
log_min_messages = 'WARNING'
log_line_prefix = '%m [%p] %q%u@%d '
```
5. Save the `postgresql.conf` file and restart the postgresql server:
```sh
sudo service postgresql restart
```
import LogsCollectionPrereqisites from '../../../reuse/apps/logs-collection-prereqisites.md';
For Windows systems, log files which are collected should be accessible by the SYSTEM group. Use the following set of PowerShell commands if the SYSTEM group does not have access.
```
$NewAcl = Get-Acl -Path ""
# Set properties
$identity = "NT AUTHORITY\SYSTEM"
$fileSystemRights = "ReadAndExecute"
$type = "Allow"
# Create new rule
$fileSystemAccessRuleArgumentList = $identity, $fileSystemRights, $type
$fileSystemAccessRule = New-Object -TypeName System.Security.AccessControl.FileSystemAccessRule -ArgumentList $fileSystemAccessRuleArgumentList
# Apply new rule
$NewAcl.SetAccessRule($fileSystemAccessRule)
Set-Acl -Path "" -AclObject $NewAcl
```
## Collection configuration and app installation
Follow these steps to set up and deploy the source template to collect data in Sumo Logic from a remotely managed OpenTelemetry collector.
### Step 1: Set up remotely managed OpenTelemetry collector
import OtelCollectorInstallation from '../../../reuse/apps/opentelemetry/otel-collector-installation.md';
:::note
If you want to configure your source locally, you can do so by downloading the YAML file. For details, see [Configure OpenTelemetry collectors locally](/docs/integrations/sumo-apps/opentelemetry-collector-insights/#configure-opentelemetry-collectors-locally).
:::
### Step 2: Configure the source template
import PostgresqlConfigureSourceTemplate from '../../../reuse/send-data/postgresql-configure-source-template.md';
import TimestampParsing from '../../../reuse/apps/opentelemetry/timestamp-parsing.md';
import ProcessingRules from '../../../reuse/opentelemetry/processing-rules.md';
### Step 3: Push the source template to the desired remotely managed collectors
import DataConfiguration from '../../../reuse/apps/opentelemetry/data-configuration.md';
## Sample metrics
```sql
{"queryId":"A","_source":"postgresql-metric-otel","source":"idx_read","db.table":"company","_sourceName":"Http Input","host":"ip-172-31-91-203.ec2.internal","os.type":"linux","sumo.datasource":"postgresql","db.system":"postgresql","postgresql.database.name":"postgres","_sourceCategory":"Labs/postgresql-otel/metric","deployment.environment":"postgresqlEnvanema","_contentType":"Carbon2","metric":"postgresql.blocks_read","_collectorId":"000000000CD05E30","db.schema":"public","_sourceId":"000000004453F6D9","unit":"1","db.cluster.name":"postgresqlOtelClusteranema","postgresql.table.name":"public.company","_collector":"Labs - postgresql-otel","max":5,"min":0,"avg":1.92,"sum":115,"latest":0,"count":60}
```
## Sample queries
This sample query is from the **PostgreSQL - Overview** dashboard, **Fatal Errors** panel.
```sumo
sumo.datasource=postgresql db.cluster.name=*
| json auto maxdepth 1 nodrop
| if (isEmpty(log), _raw, log) as _raw
| parse "* * * [*] *@* *: *" as date,time,time_zone,thread_id,user,db,severity,msg
| where severity IN ("ERROR", "FATAL")
| count by date, time, severity, db, user, msg
```
This sample query is from the **PostgreSQL - Database Metrics** dashboard, **Number of Active Databases** panel.
```sql
sumo.datasource=postgresql deployment.environment=* db.cluster.name=* metric=postgresql.backends postgresql.database.name=* db.node.name=* | count by postgresql.database.name | count
```
## Viewing PostgreSQL dashboards
All dashboards have a set of filters that you can apply to the entire dashboard. Use these filters to drill down and examine the data to a granular level.
- You can change the time range for a dashboard or panel by selecting a predefined interval from a drop-down list, choosing a recently used time range, or specifying custom dates and times. [Learn more](/docs/dashboards/set-custom-time-ranges/).
- You can use template variables to drill down and examine the data on a granular level. For more information, see [Filtering Dashboards with Template Variables](/docs/dashboards/filter-template-variables/).
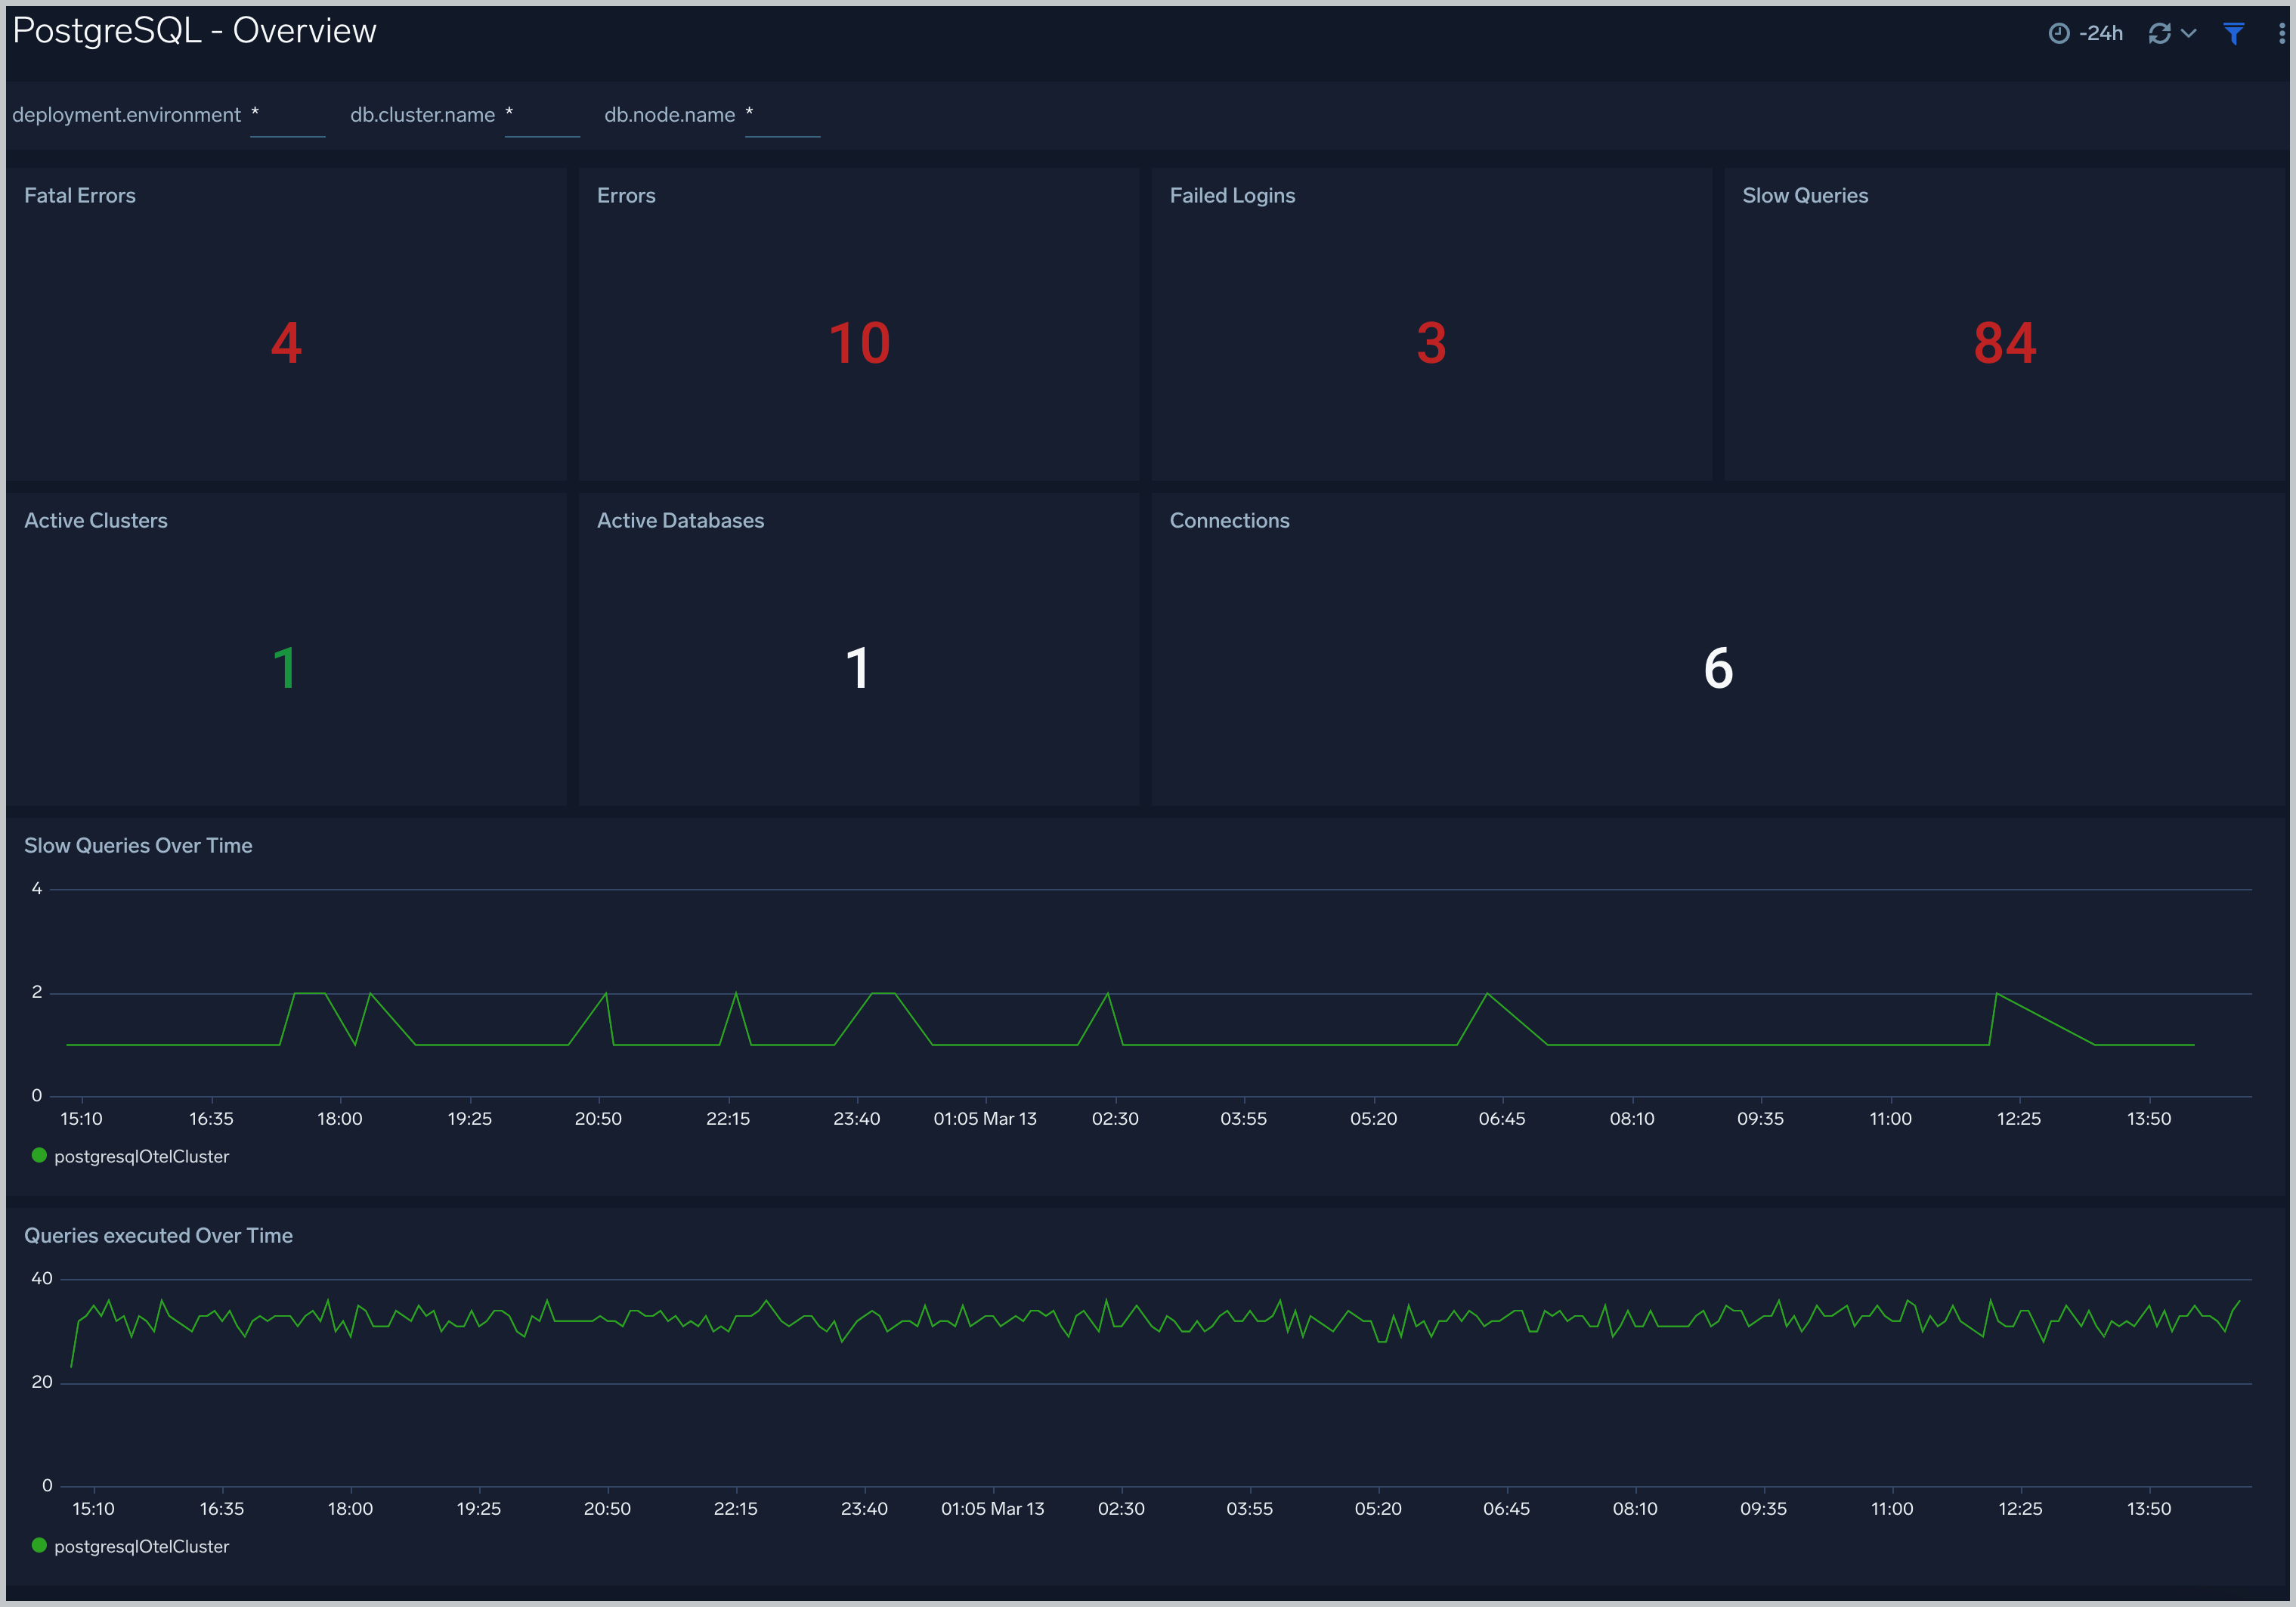
### Overview
The **PostgreSQL - Overview** dashboard gives you an at-a-glance view of the state of your database clusters by monitoring errors, failed logins, slow queries and trends over time.
Use this dashboard to:
- Determine the number of active databases and clusters.
- Drill-down into database errors, failed logins and slow queries.
- Determine if your database or queries need to be tuned based on comparing the number of slow queries.
- Active deadlock value and tuple operations trends.
 ### Query Execution
The **PostgreSQL - Query Execution** dashboard gives you insights into the number and time taken to execute queries:
Use this dashboard to:
- Monitor query performance and identify slow queries.
- Examine query execution trends.
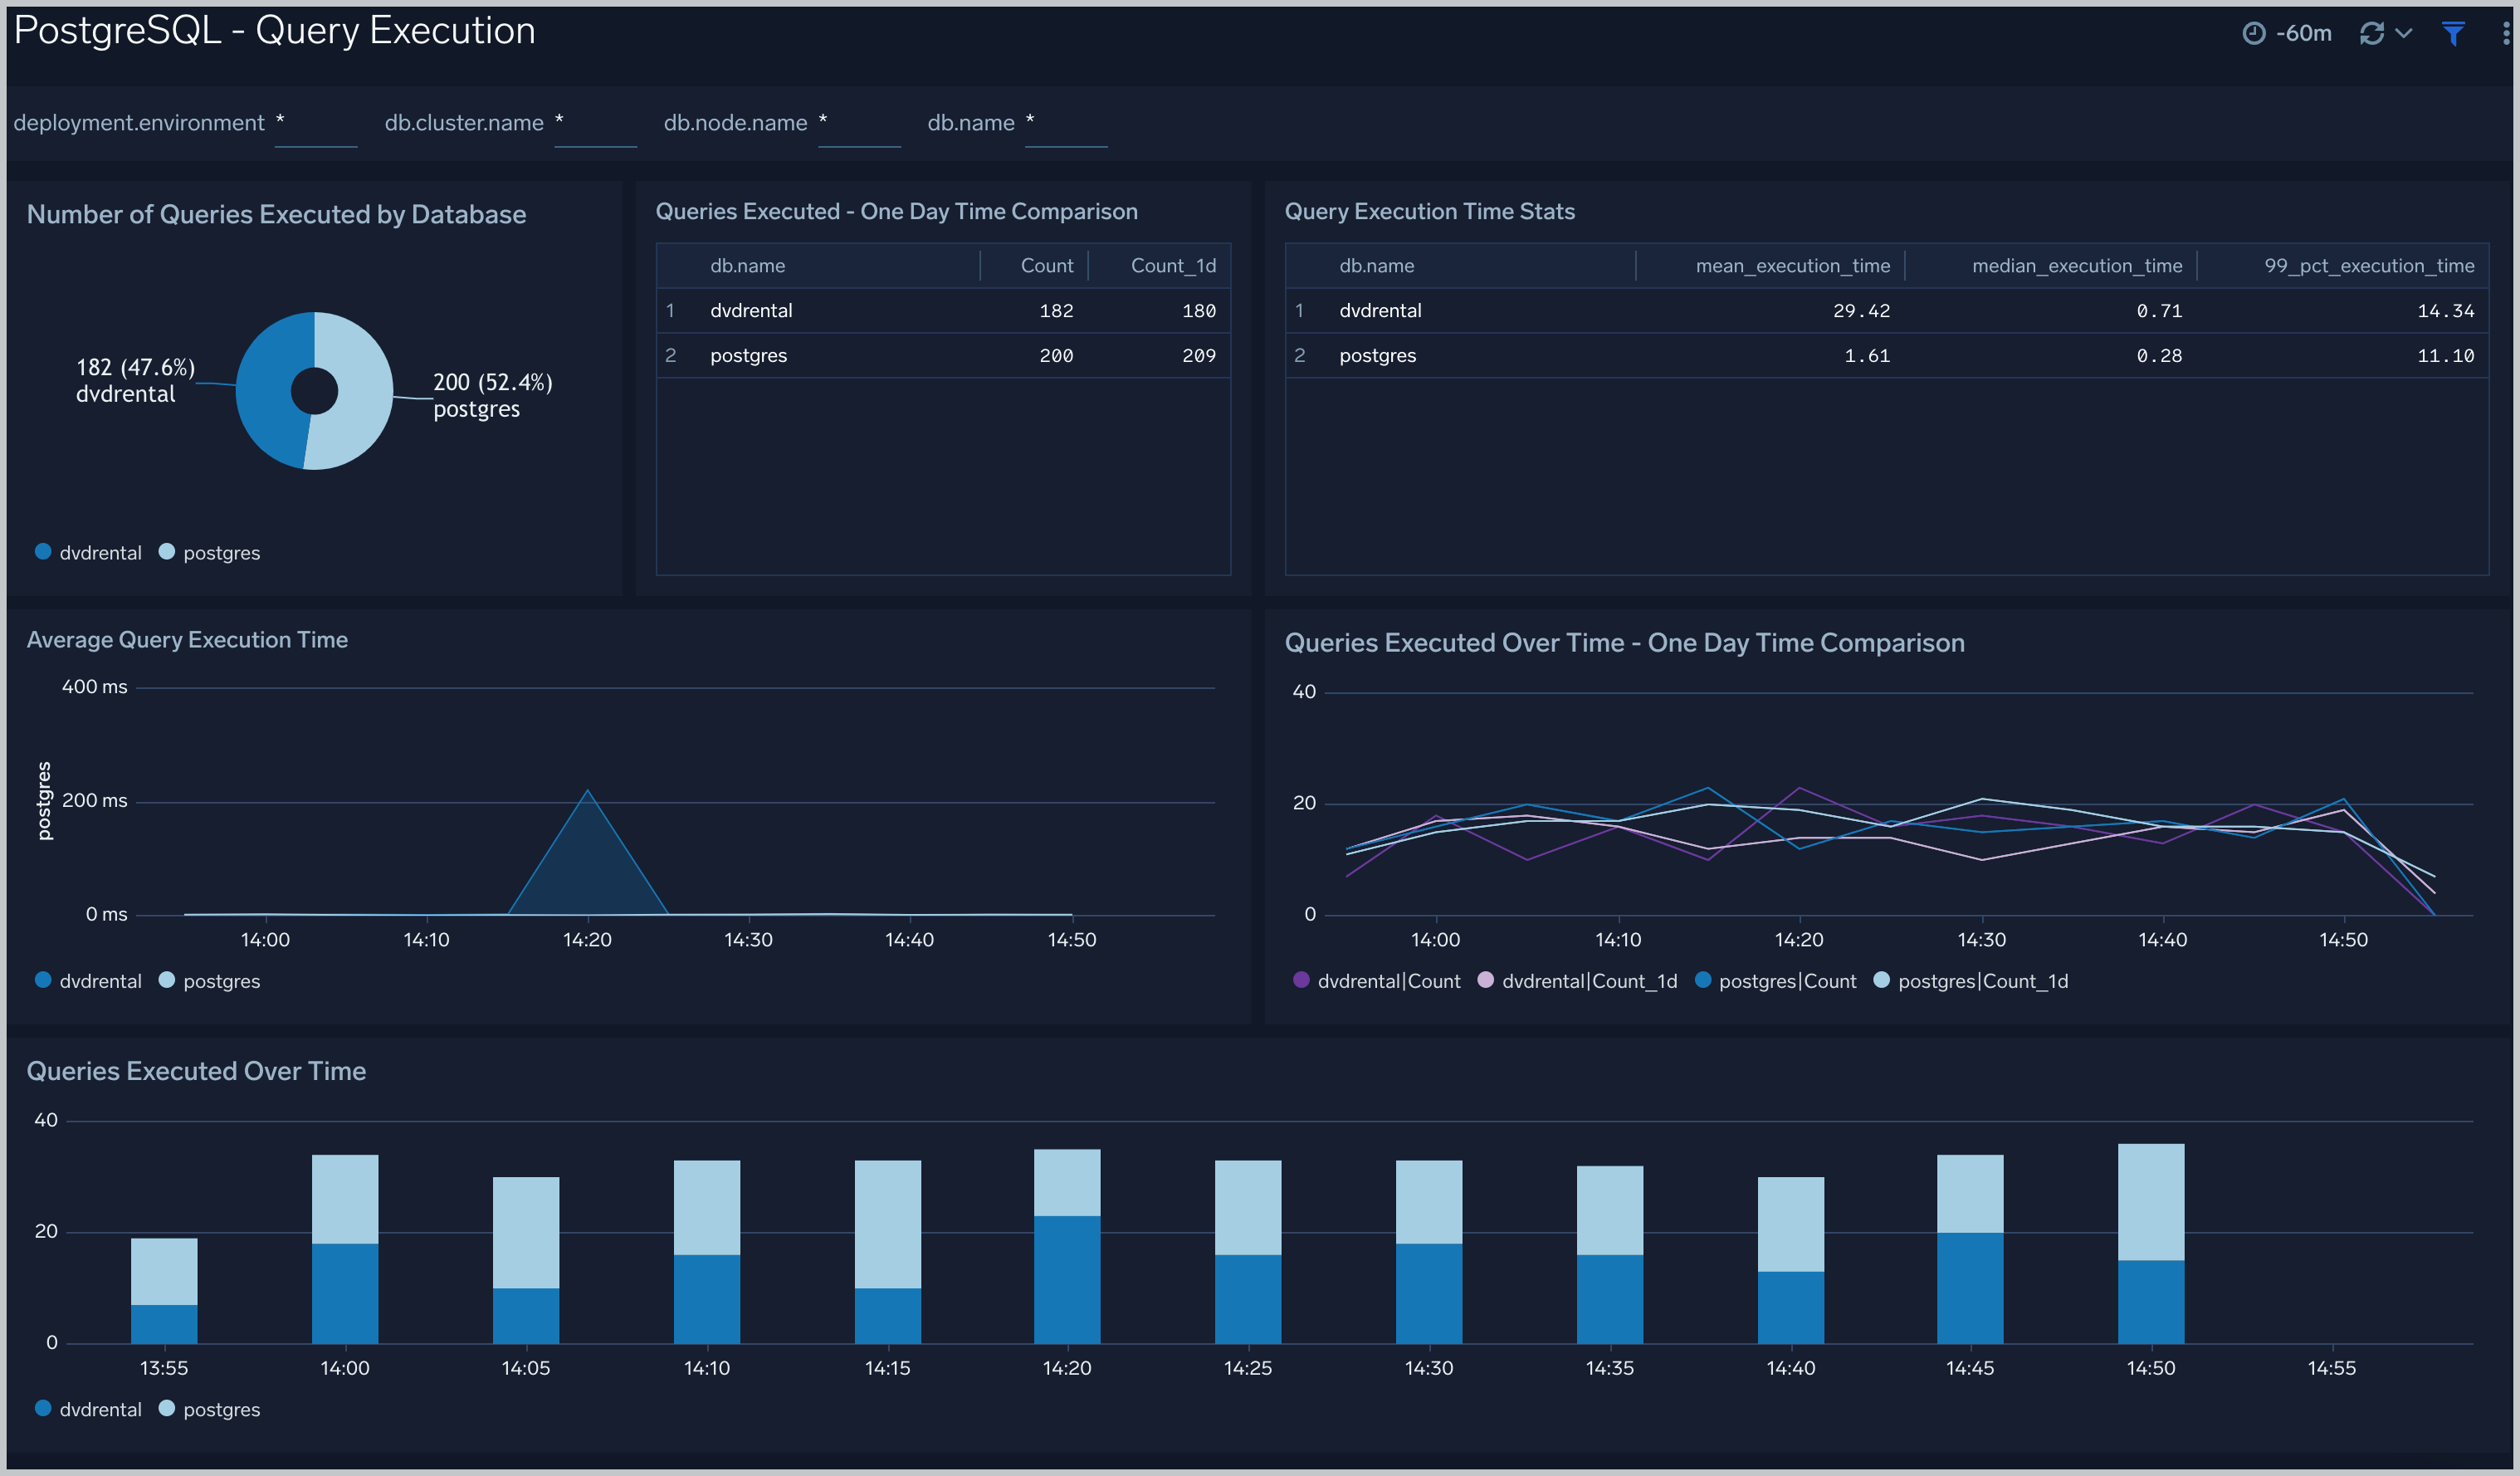
### Query Execution
The **PostgreSQL - Query Execution** dashboard gives you insights into the number and time taken to execute queries:
Use this dashboard to:
- Monitor query performance and identify slow queries.
- Examine query execution trends.
 ### Database Metrics
The **PostgreSQL - Database Metrics** dashboard allows you to monitor the database performance, which includes disk usage, commits, rollbacks, and scans.
Use this dashboard to:
- Understand the behavior and performance of your database clusters.
- Monitor the database size and disk usage.
- Identify top 5 and least 5 frequently scanned indexes.
- Monitor the row return and fetched ratio, block hits by database.
- Identify the number of Locks and Deadlocks.
- Identify the rows Update/Deleted/Inserted count trend.
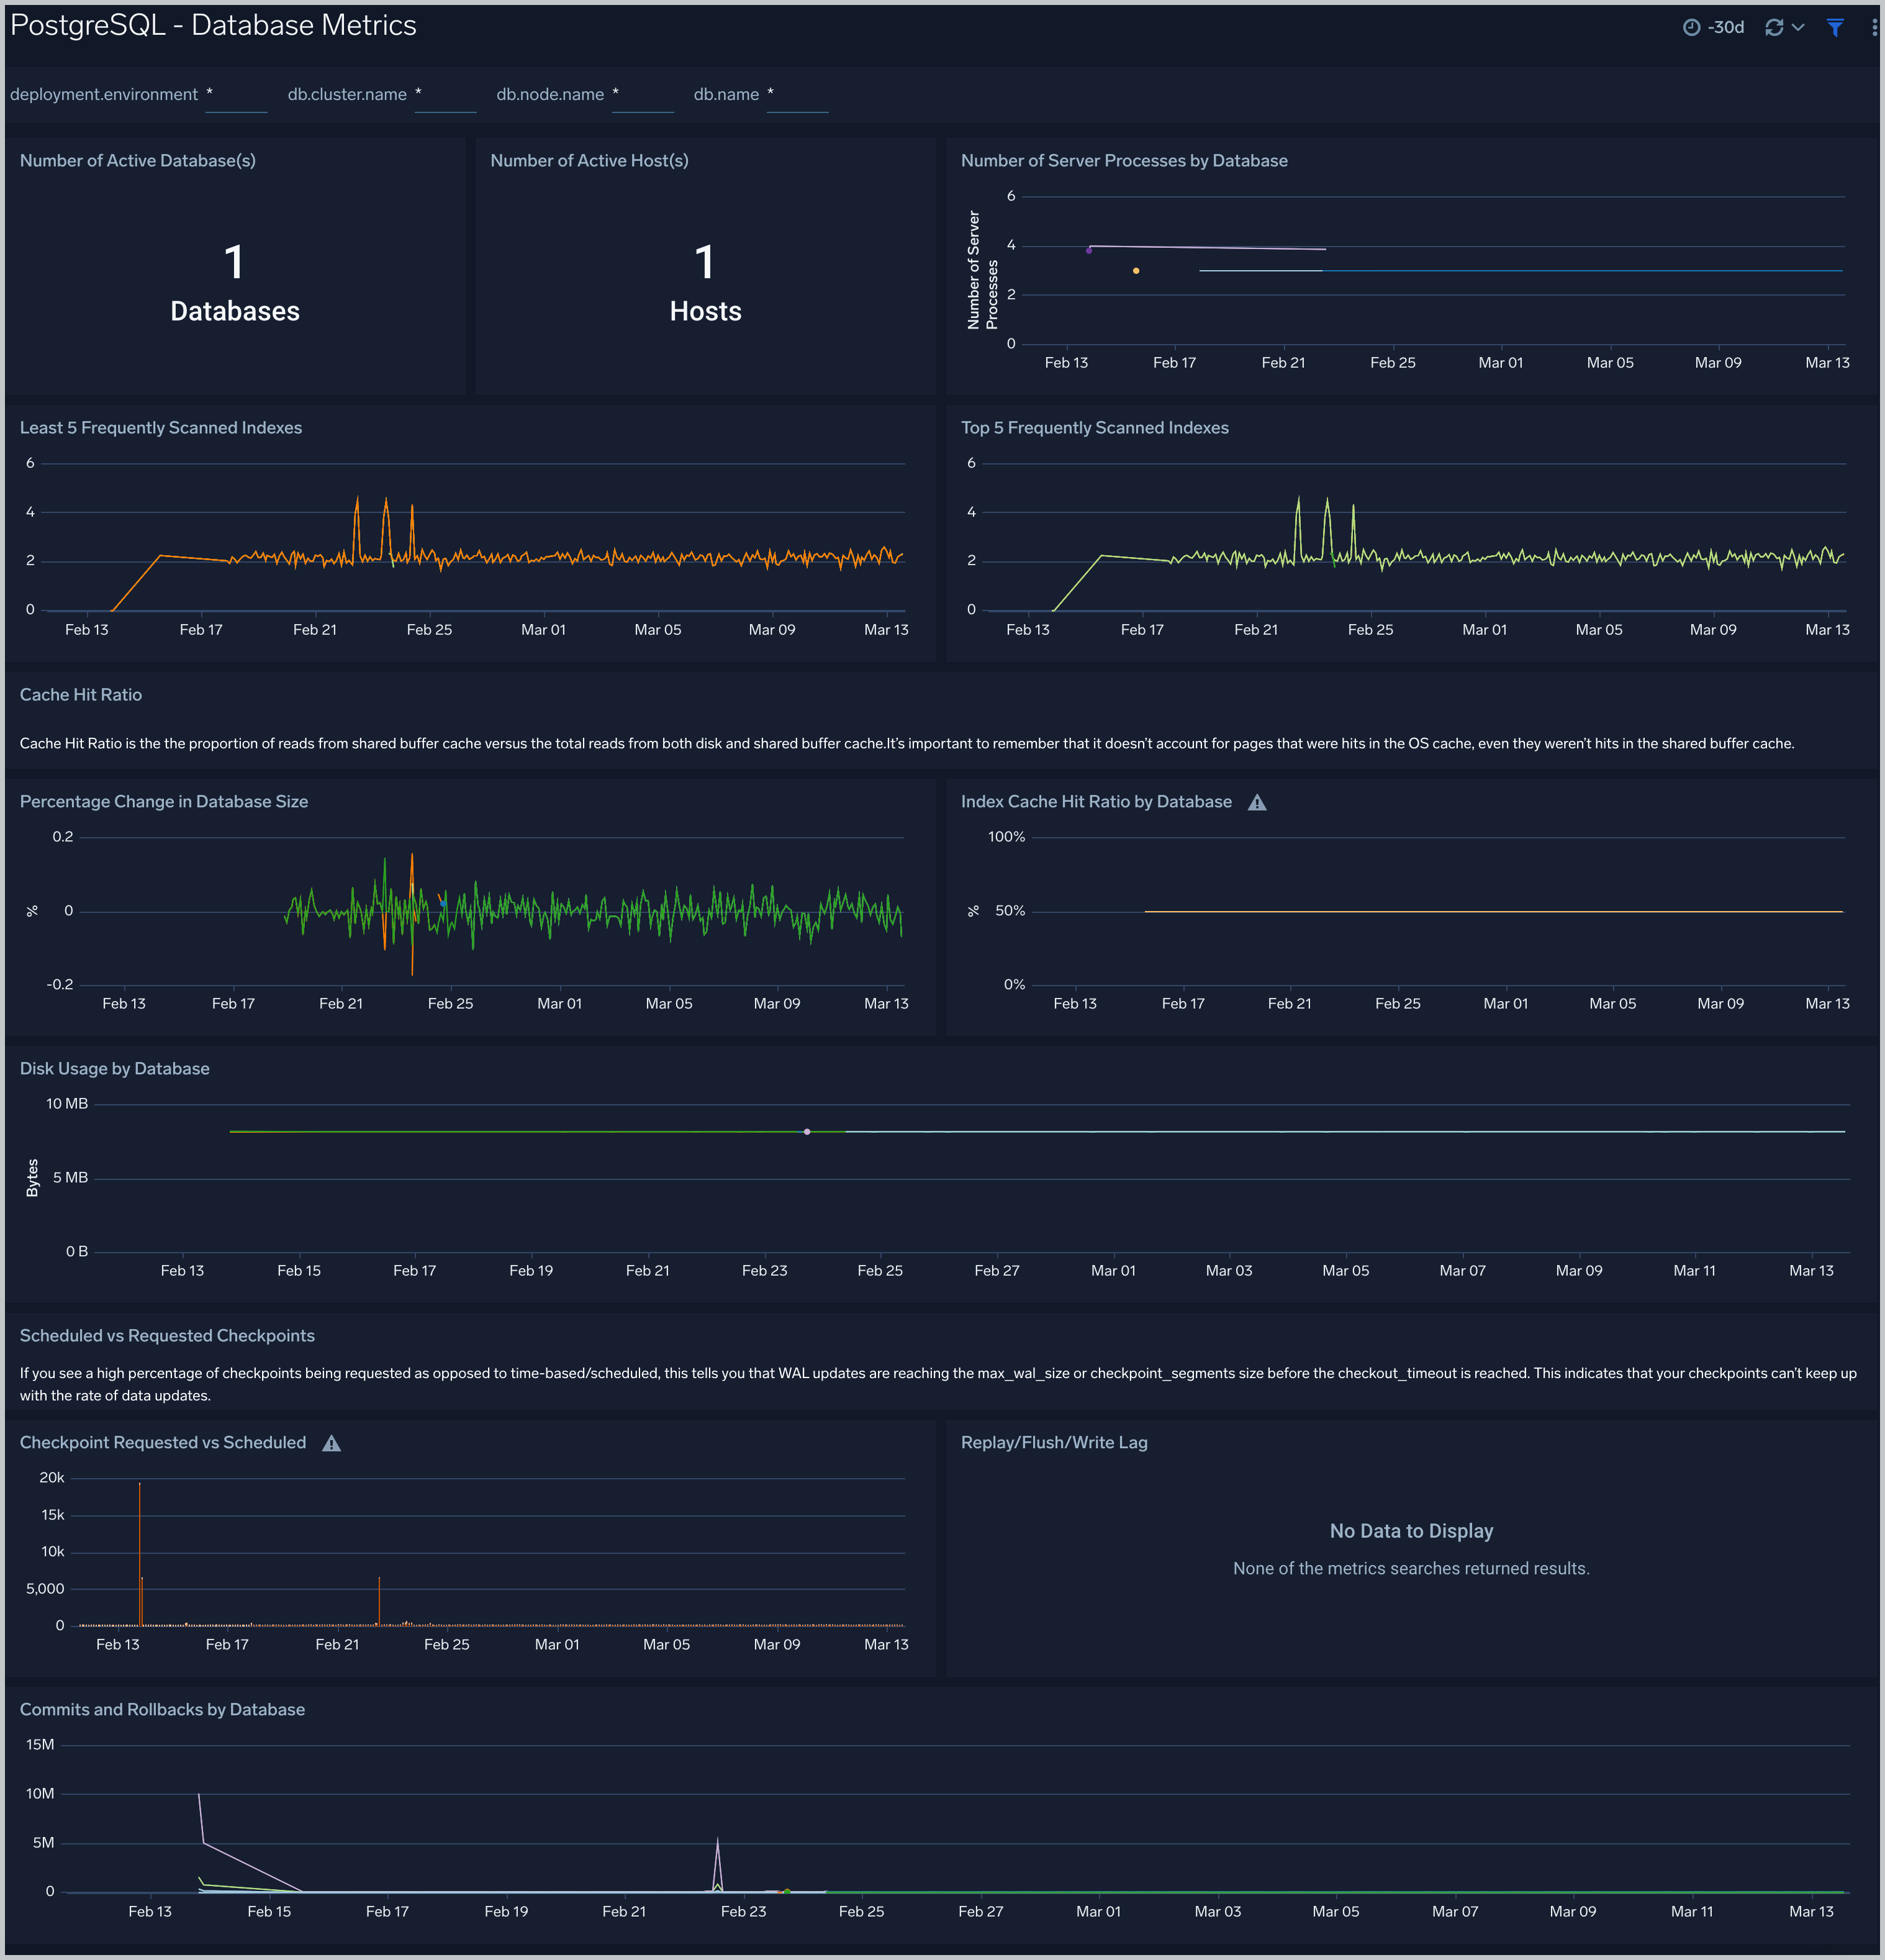
### Database Metrics
The **PostgreSQL - Database Metrics** dashboard allows you to monitor the database performance, which includes disk usage, commits, rollbacks, and scans.
Use this dashboard to:
- Understand the behavior and performance of your database clusters.
- Monitor the database size and disk usage.
- Identify top 5 and least 5 frequently scanned indexes.
- Monitor the row return and fetched ratio, block hits by database.
- Identify the number of Locks and Deadlocks.
- Identify the rows Update/Deleted/Inserted count trend.
 ### Schema Metrics
The **PostgreSQL - Schema Metrics** dashboard allows you to view and analyze the metrics for monitoring the schema in a cluster.
Use this dashboard to view:
- Head Only Tuple updated by schema.
- Disk block reads and Disk usage by schema.
- Buffer hits and rows inserted, updated and deleted by schema.
- Live rows by schema.
### Schema Metrics
The **PostgreSQL - Schema Metrics** dashboard allows you to view and analyze the metrics for monitoring the schema in a cluster.
Use this dashboard to view:
- Head Only Tuple updated by schema.
- Disk block reads and Disk usage by schema.
- Buffer hits and rows inserted, updated and deleted by schema.
- Live rows by schema.
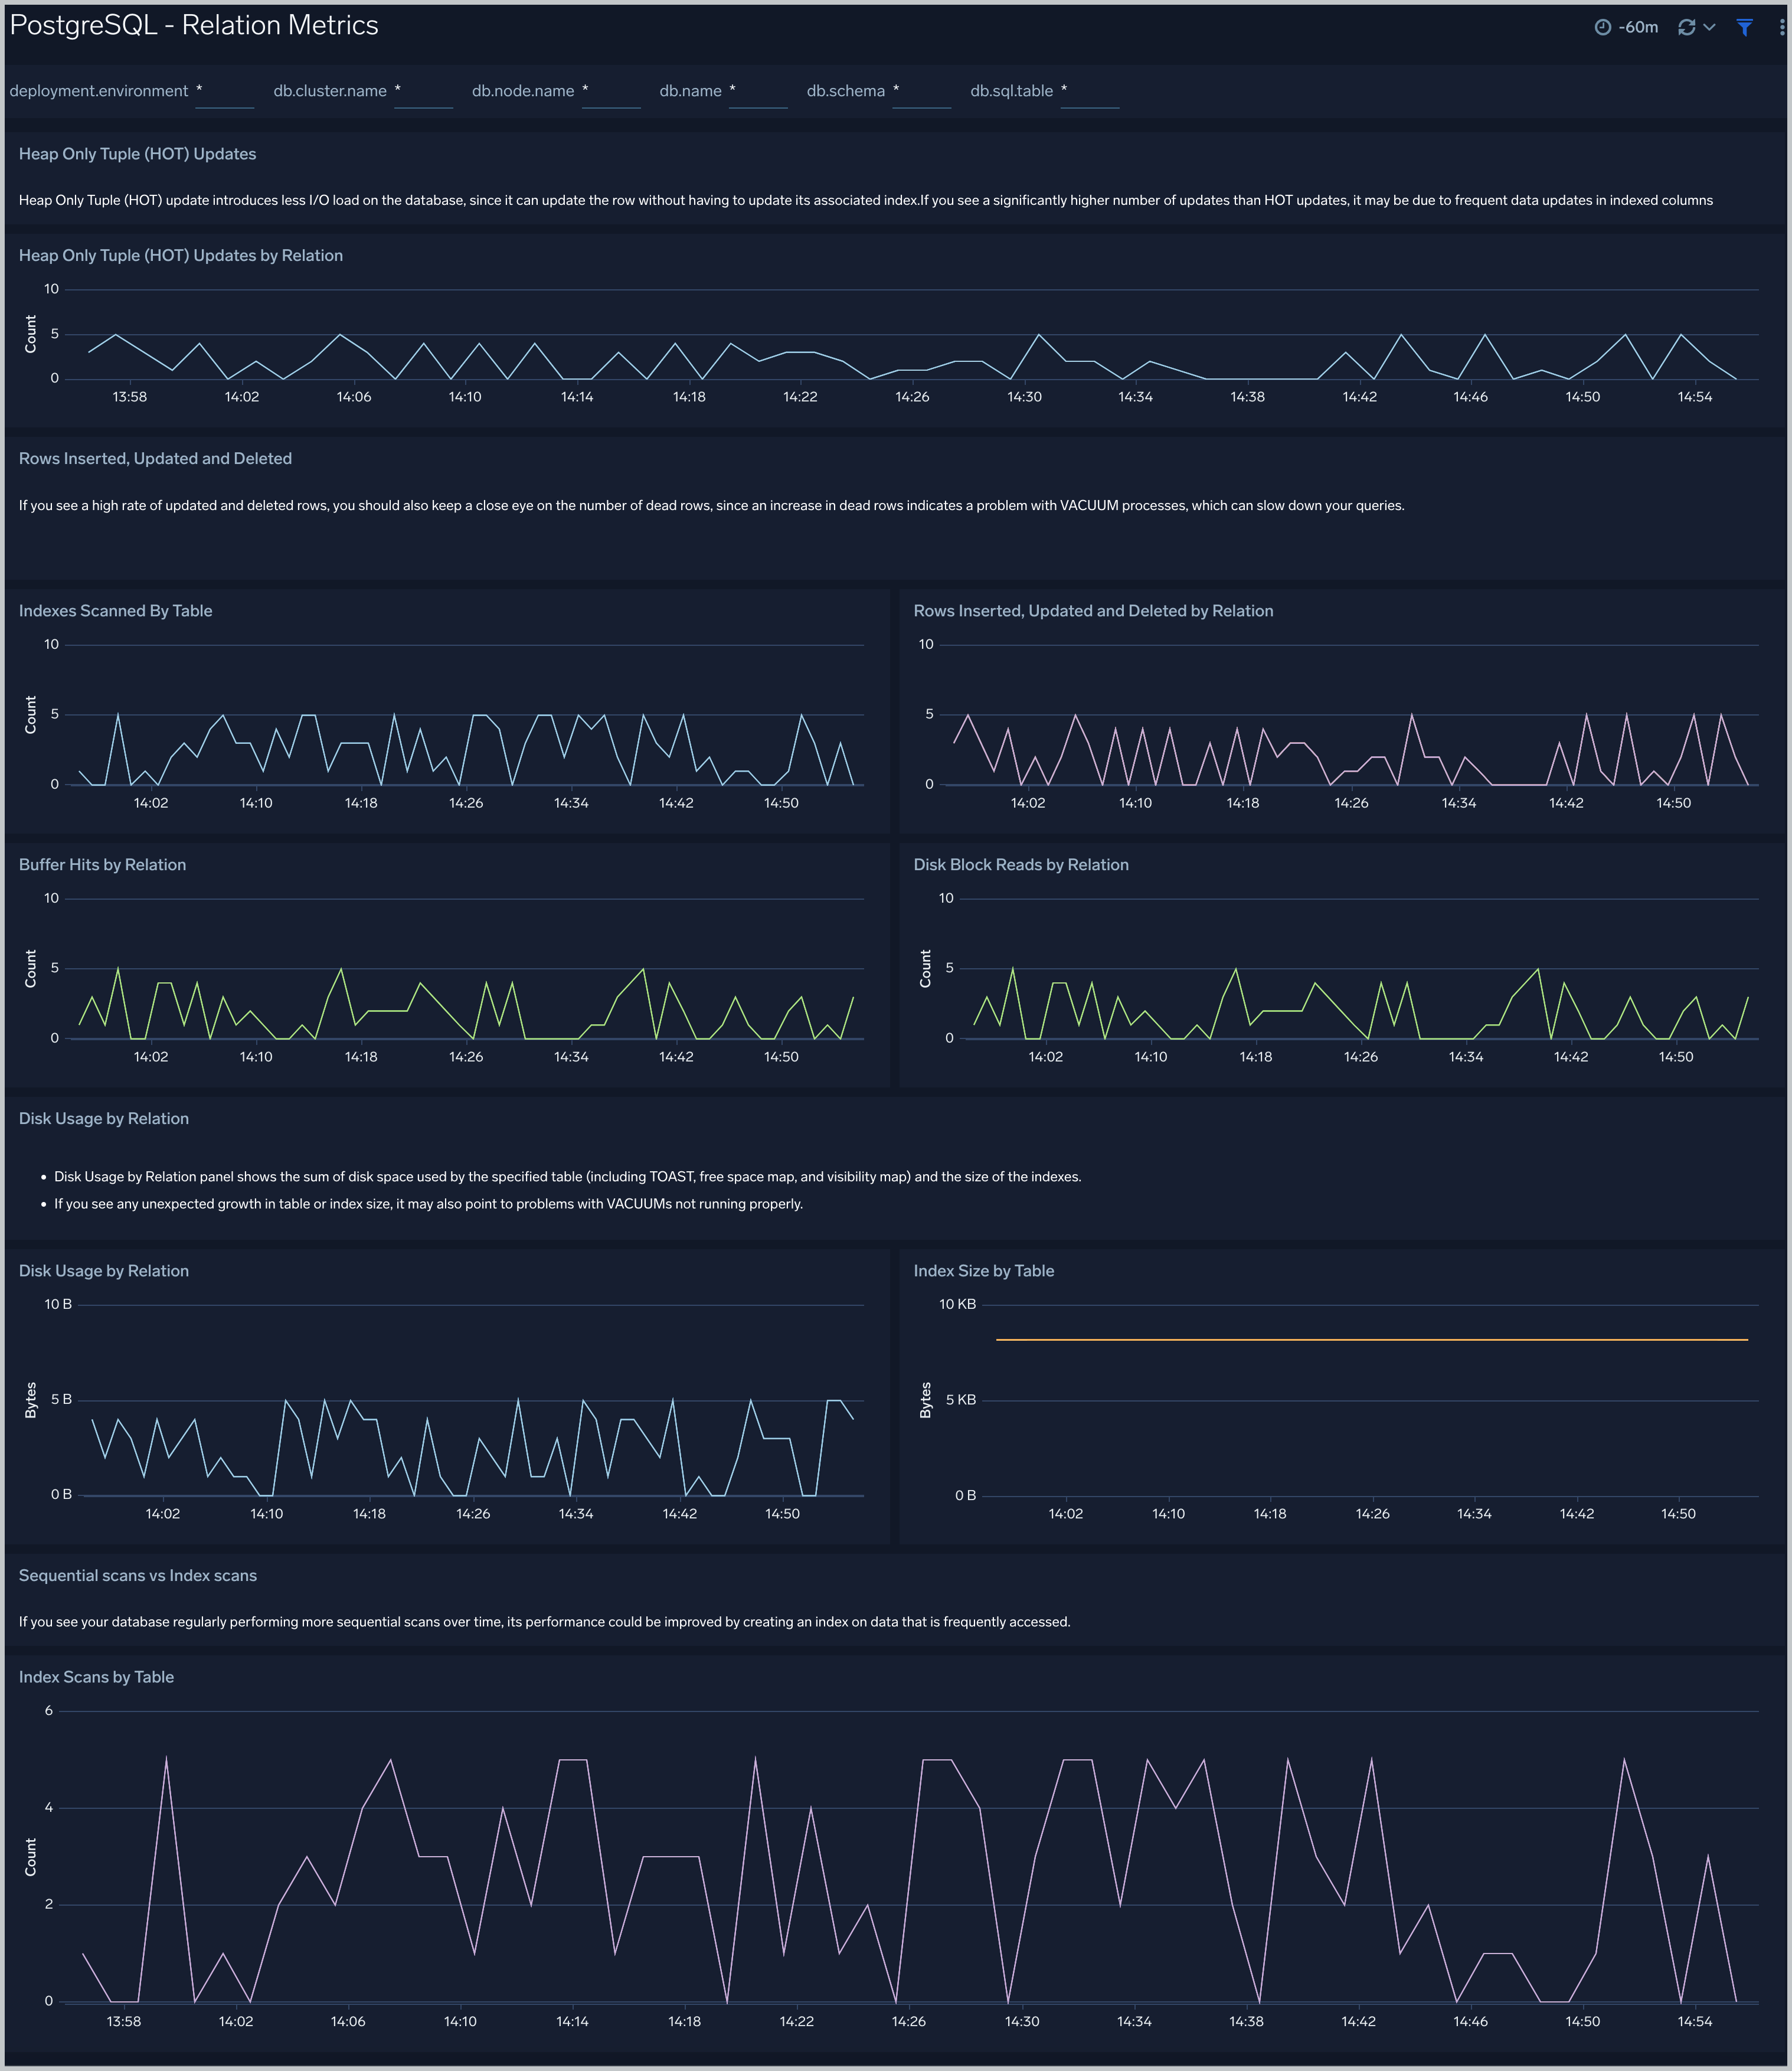
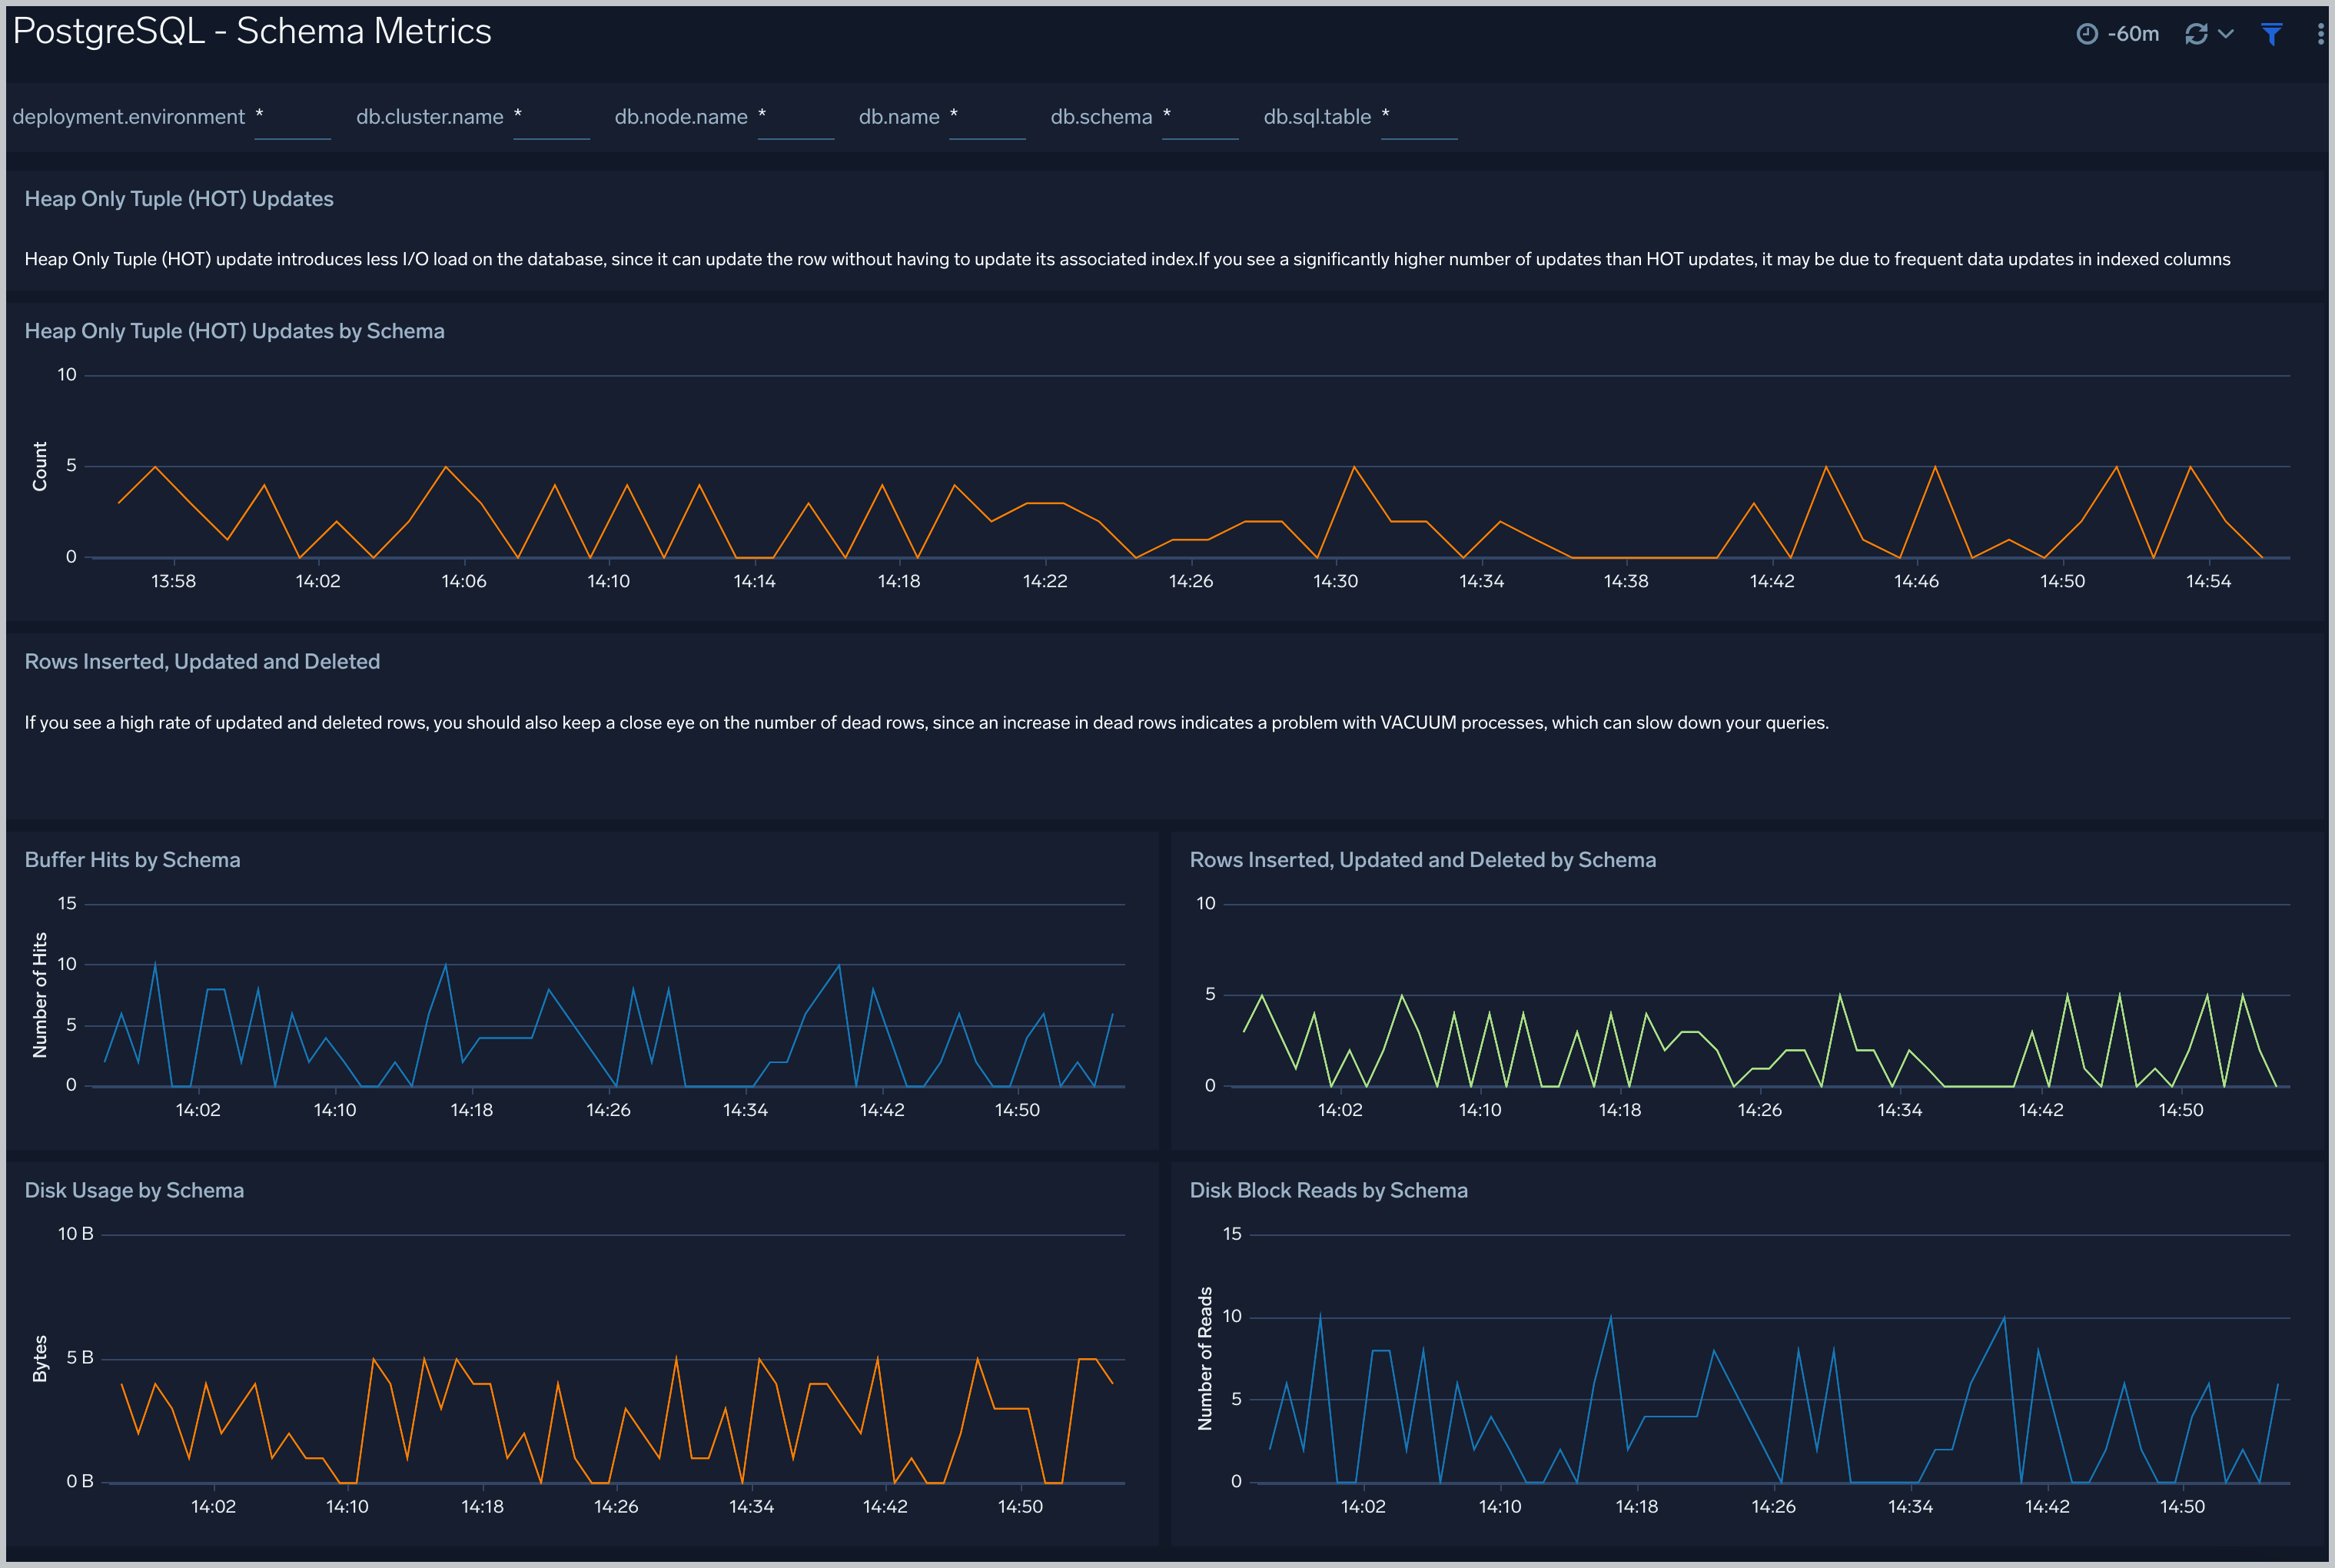 Query performance can degrade with the growth of the size of table, database and/or indexes. This means that you either need to scale up the database instance, [partition your data](https://www.postgresql.org/docs/current/static/ddl-partitioning.html), or redesign your indexes. Unusual growth in disk space can also mean there are problems with [VACUUMs](https://www.postgresql.org/docs/9.1/static/sql-vacuum.html) .
If your database regularly performs more sequential scans over time, you can improve its performance by creating an [index](https://www.postgresql.org/docs/current/static/sql-createindex.html) on frequently accessed data.
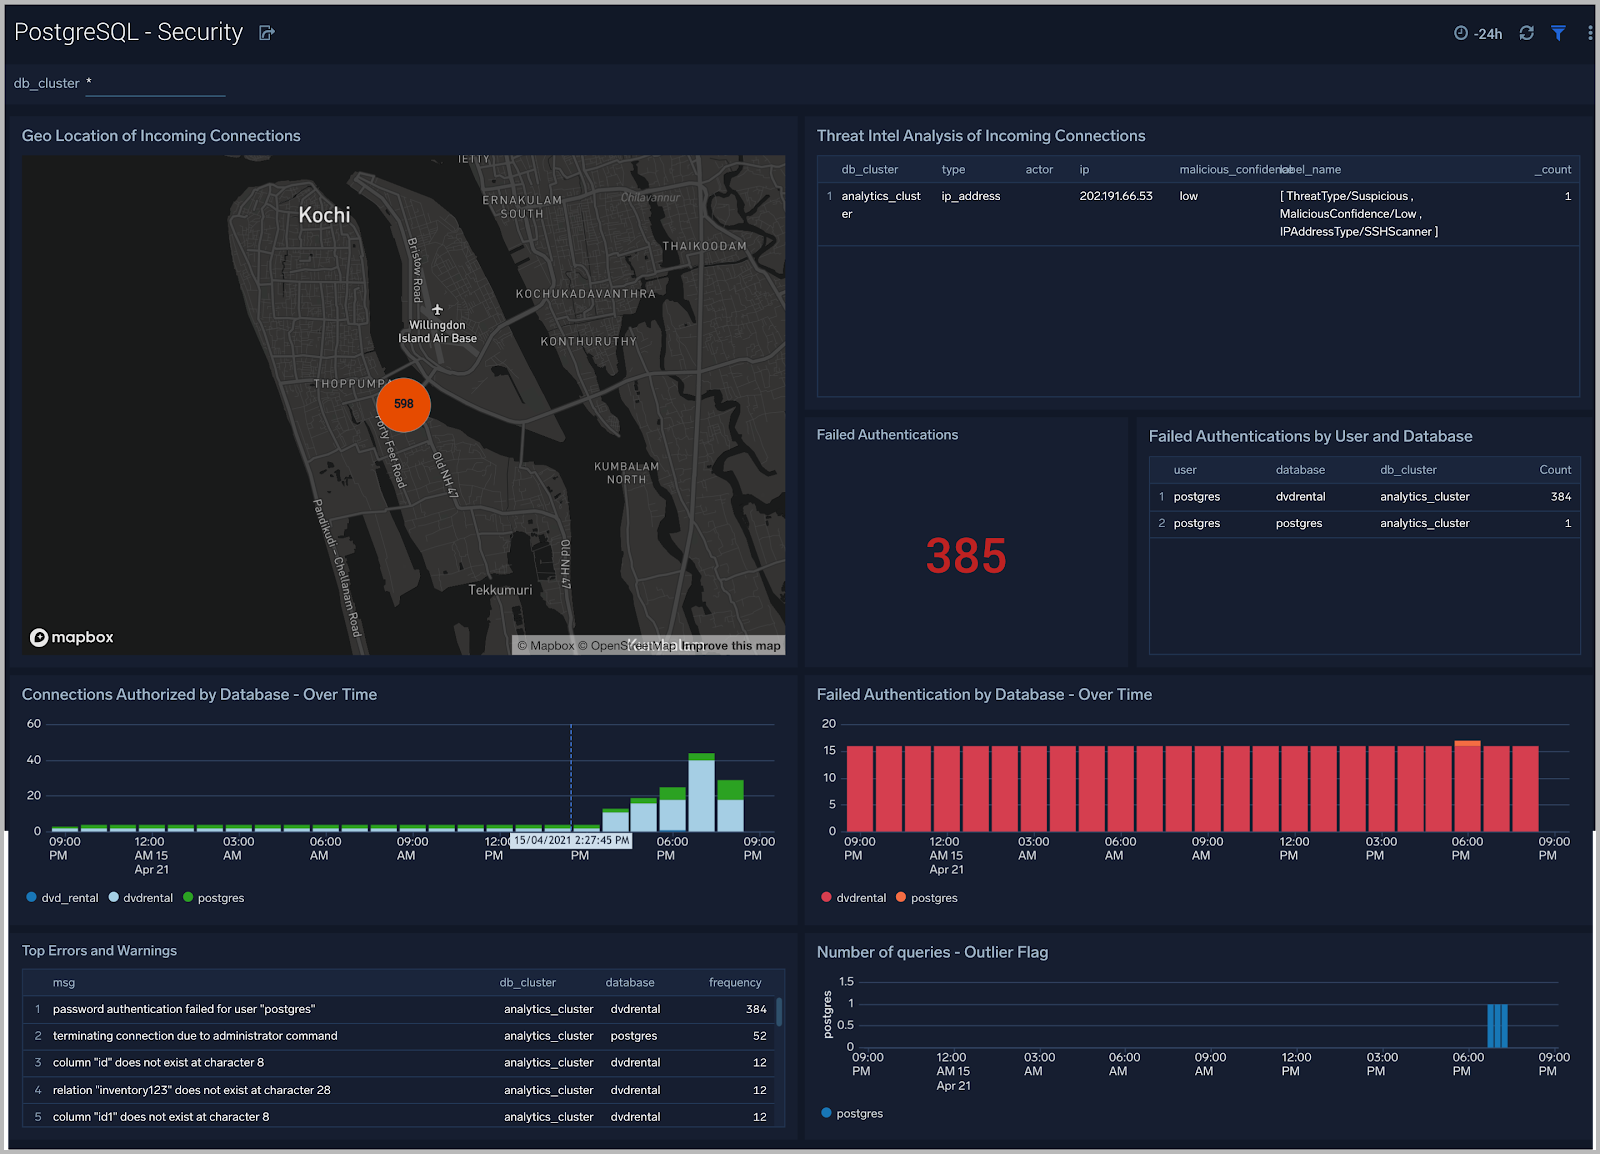
### Security
The **PostgreSQL - Security** dashboard provides insight into locations of incoming connections, failed authentications, and top database errors and warnings.
Use this dashboard to:
- Monitor incoming connections, failed authorization requests, and outliers in the number of queries executed outlier.
- Identify known malicious IPs that are accessing your databases and use firewall access control lists to prevent them from sending you traffic going forward.
Query performance can degrade with the growth of the size of table, database and/or indexes. This means that you either need to scale up the database instance, [partition your data](https://www.postgresql.org/docs/current/static/ddl-partitioning.html), or redesign your indexes. Unusual growth in disk space can also mean there are problems with [VACUUMs](https://www.postgresql.org/docs/9.1/static/sql-vacuum.html) .
If your database regularly performs more sequential scans over time, you can improve its performance by creating an [index](https://www.postgresql.org/docs/current/static/sql-createindex.html) on frequently accessed data.
### Security
The **PostgreSQL - Security** dashboard provides insight into locations of incoming connections, failed authentications, and top database errors and warnings.
Use this dashboard to:
- Monitor incoming connections, failed authorization requests, and outliers in the number of queries executed outlier.
- Identify known malicious IPs that are accessing your databases and use firewall access control lists to prevent them from sending you traffic going forward.
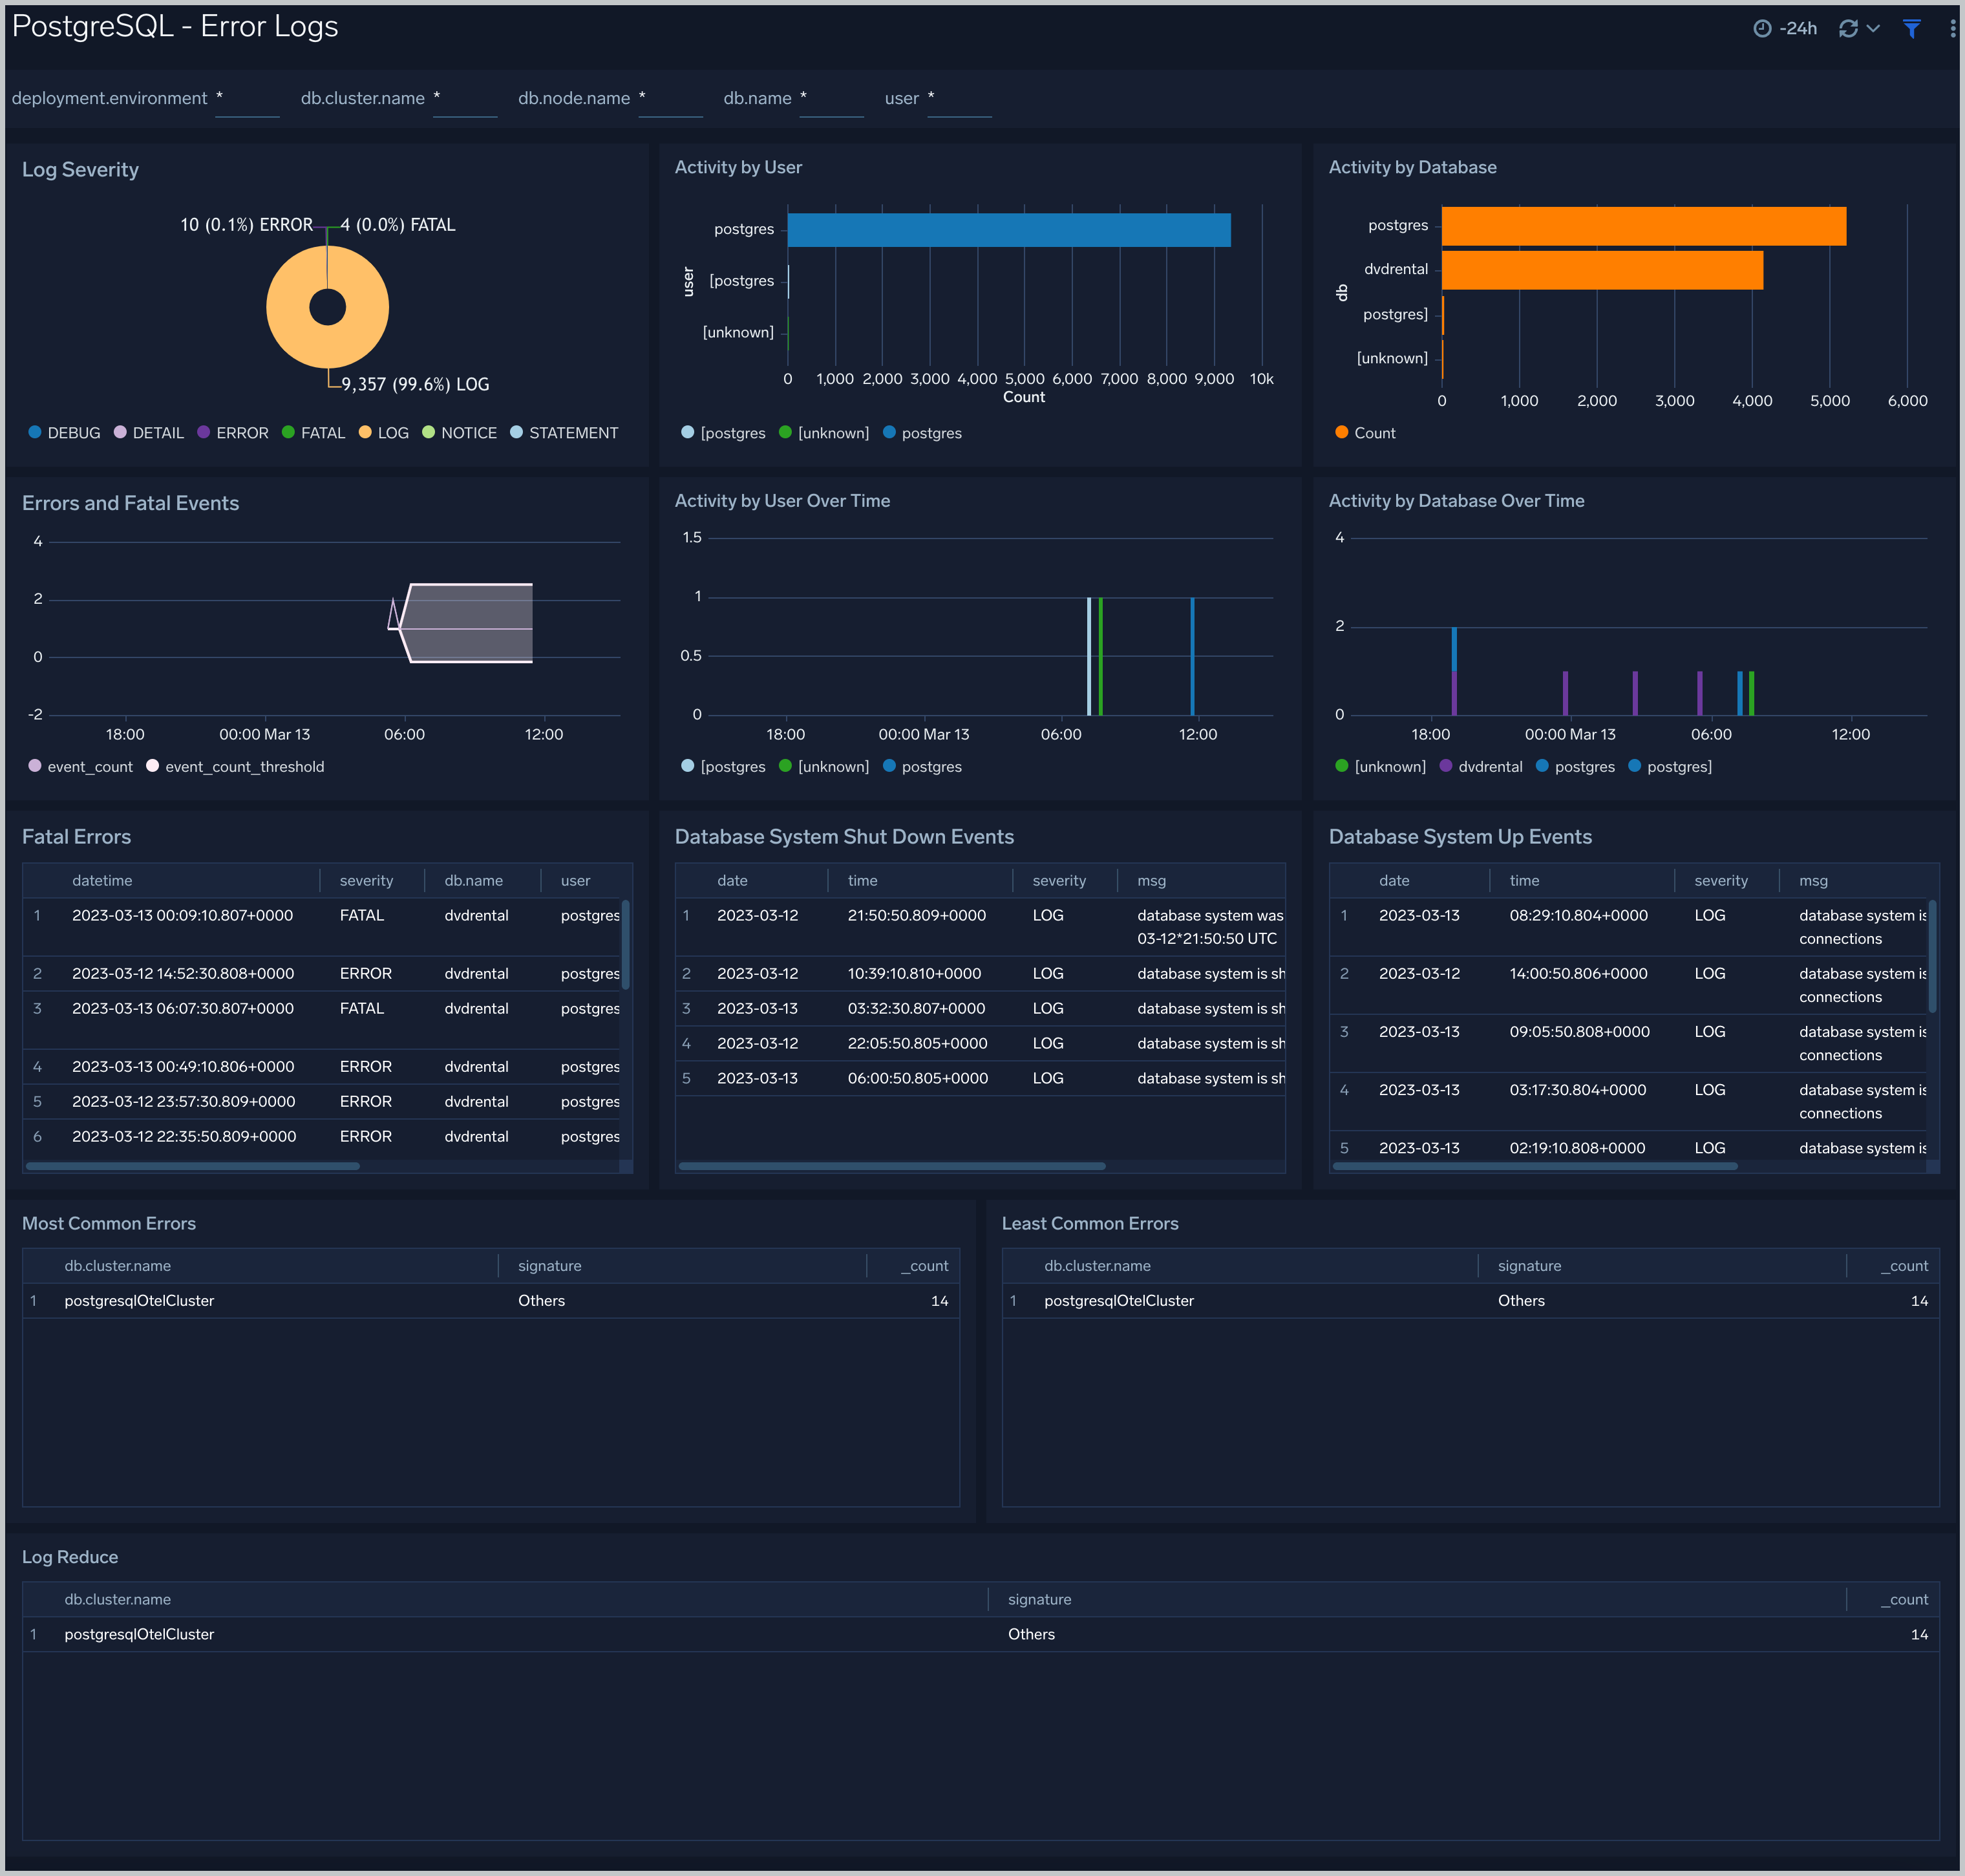
 ### Error Logs
The **PostgreSQL - Error Logs** dashboard provides insight into database error logs by specifically monitoring errors, user activity, database activity, and database shutdown/start events.
Use this dashboard to:
- Quickly identify errors and patterns in logs for troubleshooting.
- Monitor error trends and quickly identify outliers.
- Identify unexpected database or user activity.
### Error Logs
The **PostgreSQL - Error Logs** dashboard provides insight into database error logs by specifically monitoring errors, user activity, database activity, and database shutdown/start events.
Use this dashboard to:
- Quickly identify errors and patterns in logs for troubleshooting.
- Monitor error trends and quickly identify outliers.
- Identify unexpected database or user activity.
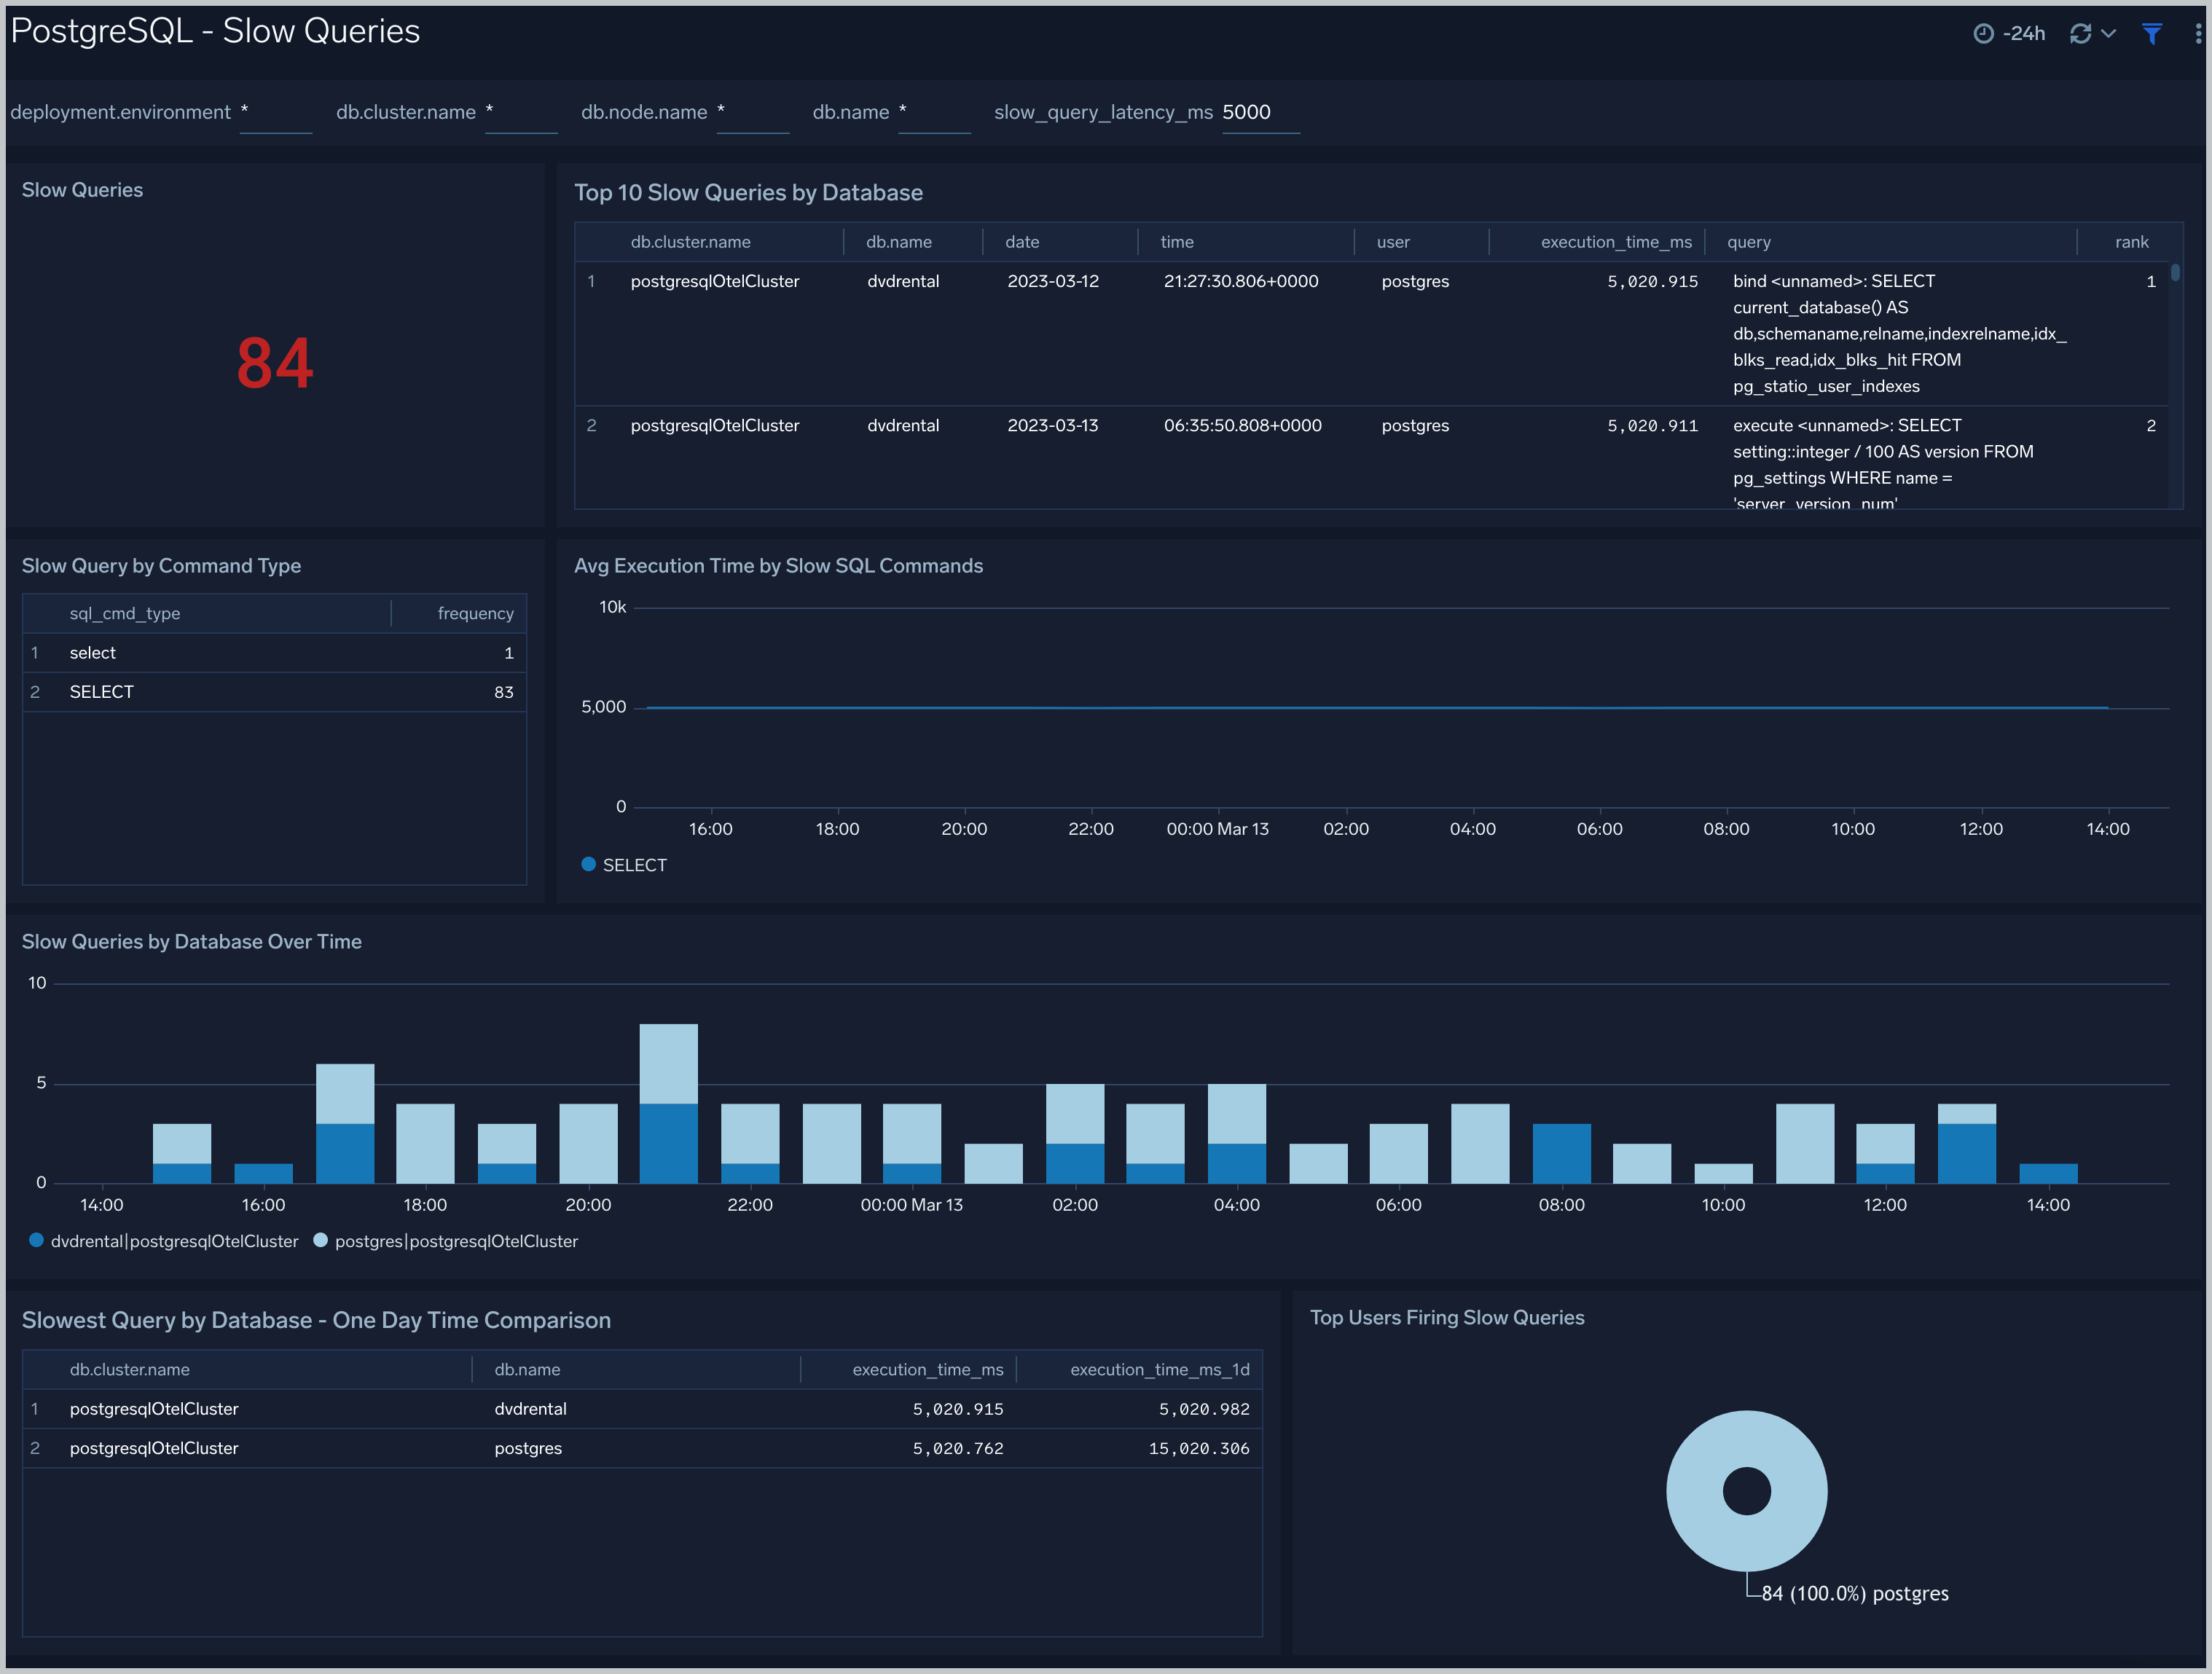
 ### Slow Queries
The **PostgreSQL - Slow Queries** dashboard provides insights into all slow queries executed on the database.
Use this dashboard to:
- Identify all slow queries.
- Monitor users and databases running slow queries.
- Determine which SQL commands are slower than others.
- Examine slow query trends to determine if there are periodic performance bottlenecks in your database clusters.
### Slow Queries
The **PostgreSQL - Slow Queries** dashboard provides insights into all slow queries executed on the database.
Use this dashboard to:
- Identify all slow queries.
- Monitor users and databases running slow queries.
- Determine which SQL commands are slower than others.
- Examine slow query trends to determine if there are periodic performance bottlenecks in your database clusters.
 ### Relation Metrics
The **PostgreSQL - Relation Metrics** dashboard allows you to view and analyze the metrics for monitoring the relations in a schema.
Use this dashboard to:
- Monitor PostgreSQL relation metrics (disk blocks, buffer hits, and hot updates) trends over time.
- Monitor index scans and size to determine if executed queries are accessing them for a relation.
- Track index utilization of existing indexes in a relation.
- Monitor the PostgreSQL live and dead rows count trend.
- Monitor the sequential scans and index scans by relation.
### Relation Metrics
The **PostgreSQL - Relation Metrics** dashboard allows you to view and analyze the metrics for monitoring the relations in a schema.
Use this dashboard to:
- Monitor PostgreSQL relation metrics (disk blocks, buffer hits, and hot updates) trends over time.
- Monitor index scans and size to determine if executed queries are accessing them for a relation.
- Track index utilization of existing indexes in a relation.
- Monitor the PostgreSQL live and dead rows count trend.
- Monitor the sequential scans and index scans by relation.
 ## Create monitors for PostgreSQL app
import CreateMonitors from '../../../reuse/apps/create-monitors.md';
### PostgreSQL alerts
| Alert Name | Alert Description and conditions | Alert Condition | Recover Condition |
|:--|:--|:--|:--|
| `PostgreSQL - Access from Highly Malicious Sources Alert` | This alert gets triggered when a Postgres instance is accessed from known malicious IP addresses. | Count > = 1 | Count < 1 |
| `PostgreSQL - High Rate of Statement Timeout Alert` | This alert gets triggered when we detect Postgres transactions show a high rate of statement timeouts. | Count > = 1 | Count < 1 |
| `PostgreSQL - High Replication Lag Alert` | This alert gets triggered when we detect that the Postgres Replication lag (in bytes) is high. | Count > 10 | Count < = 10 |
| `PostgreSQL - Instance Down Alert` | This alert gets triggered when the Postgres instance is down. | Count > = 1 | Count < 1 |
| `PostgreSQL - SlowQueries Alert` | This alert gets triggered when we detect that the PostgreSQL instance is executing slow queries. | Count > 5 | Count < = 5 |
| `Postgresql- Too Many Connections Alert` | PostgreSQL instance has too many connections. | Count > = 100 | Count < 100 |
| `PostgreSQL - Too Many Locks Acquired Alert` | This alert is triggered when there are too many locks acquired on the database. Increase the postgres setting `max_locks_per_transaction`, if this alert occurs frequently. | Count > = 100 | Count < 100 |
| `PostgreSQL - High Rate Deadlock` | This alert is triggered when deadlocks in a Postgres instance are detected. | Count > = 1 | Count < 1 |
## Create monitors for PostgreSQL app
import CreateMonitors from '../../../reuse/apps/create-monitors.md';
### PostgreSQL alerts
| Alert Name | Alert Description and conditions | Alert Condition | Recover Condition |
|:--|:--|:--|:--|
| `PostgreSQL - Access from Highly Malicious Sources Alert` | This alert gets triggered when a Postgres instance is accessed from known malicious IP addresses. | Count > = 1 | Count < 1 |
| `PostgreSQL - High Rate of Statement Timeout Alert` | This alert gets triggered when we detect Postgres transactions show a high rate of statement timeouts. | Count > = 1 | Count < 1 |
| `PostgreSQL - High Replication Lag Alert` | This alert gets triggered when we detect that the Postgres Replication lag (in bytes) is high. | Count > 10 | Count < = 10 |
| `PostgreSQL - Instance Down Alert` | This alert gets triggered when the Postgres instance is down. | Count > = 1 | Count < 1 |
| `PostgreSQL - SlowQueries Alert` | This alert gets triggered when we detect that the PostgreSQL instance is executing slow queries. | Count > 5 | Count < = 5 |
| `Postgresql- Too Many Connections Alert` | PostgreSQL instance has too many connections. | Count > = 100 | Count < 100 |
| `PostgreSQL - Too Many Locks Acquired Alert` | This alert is triggered when there are too many locks acquired on the database. Increase the postgres setting `max_locks_per_transaction`, if this alert occurs frequently. | Count > = 100 | Count < 100 |
| `PostgreSQL - High Rate Deadlock` | This alert is triggered when deadlocks in a Postgres instance are detected. | Count > = 1 | Count < 1 |