---
id: redis-opentelemetry
title: Redis - OpenTelemetry Collector
sidebar_label: Redis - OTel Collector
description: Learn about the Sumo Logic OpenTelemetry app for Redis.
slug: /help/docs/integrations/databases/opentelemetry/redis-opentelemetry/
canonical: https://www.sumologic.com/help/docs/integrations/databases/opentelemetry/redis-opentelemetry/
---
import useBaseUrl from '@docusaurus/useBaseUrl';
import Tabs from '@theme/Tabs';
import TabItem from '@theme/TabItem';
})
}) [Redis](https://redis.io/docs/about/) is an in-memory data structure that implements a distributed, in-memory key-value database with durability options.
The Sumo Logic app for Redis helps you monitor the Redis database cluster. The preconfigured dashboards provide detailed analysis based on logs and metrics. The panels provide details such as RDBMemory Usage, events, RDB, AOF events, resource usage, commands running, and cache hit rate.
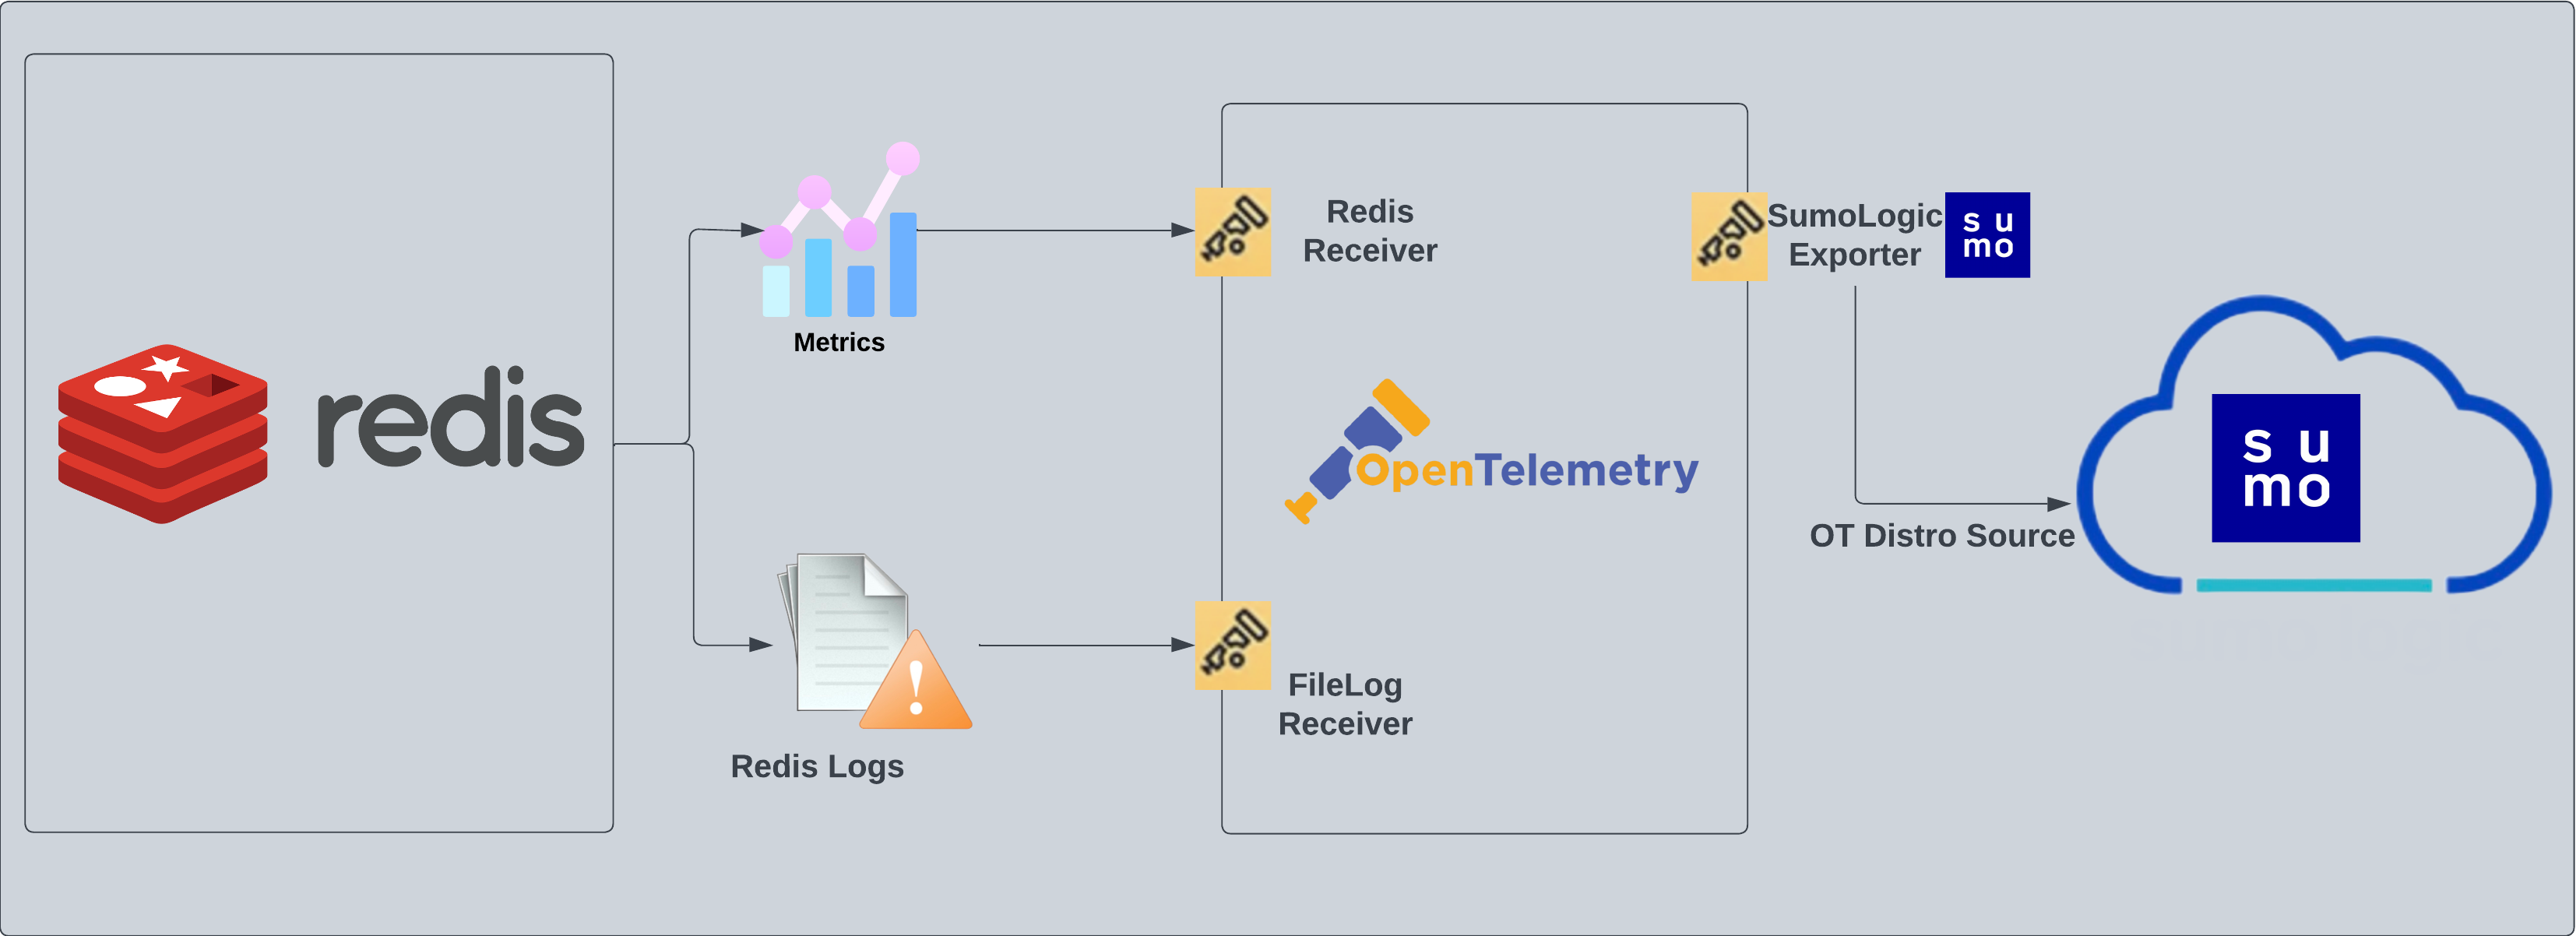
Redis logs are sent to Sumo Logic through OpenTelemetry [filelog receiver](https://github.com/open-telemetry/opentelemetry-collector-contrib/tree/main/receiver/filelogreceiver). The OpenTelemetry collector runs on the same host as Redis and uses the [Redis Receiver](https://github.com/open-telemetry/opentelemetry-collector-contrib/tree/main/receiver/redisreceiver) and the [Sumo Logic OpenTelemetry Exporter](https://github.com/open-telemetry/opentelemetry-collector-contrib/tree/main/exporter/sumologicexporter) to send the metrics to Sumo Logic.
[Redis](https://redis.io/docs/about/) is an in-memory data structure that implements a distributed, in-memory key-value database with durability options.
The Sumo Logic app for Redis helps you monitor the Redis database cluster. The preconfigured dashboards provide detailed analysis based on logs and metrics. The panels provide details such as RDBMemory Usage, events, RDB, AOF events, resource usage, commands running, and cache hit rate.
Redis logs are sent to Sumo Logic through OpenTelemetry [filelog receiver](https://github.com/open-telemetry/opentelemetry-collector-contrib/tree/main/receiver/filelogreceiver). The OpenTelemetry collector runs on the same host as Redis and uses the [Redis Receiver](https://github.com/open-telemetry/opentelemetry-collector-contrib/tree/main/receiver/redisreceiver) and the [Sumo Logic OpenTelemetry Exporter](https://github.com/open-telemetry/opentelemetry-collector-contrib/tree/main/exporter/sumologicexporter) to send the metrics to Sumo Logic.
 ## Log and metrics types
This app supports metrics and logs for Redis in Cluster mode or Standalone mode. The Redis logs are generated in files as configured in the cluster node configuration files in `/etc/redis/redis.conf`. For more details on Redis logs, see [Redis documentation](https://redislabs.com/ebook/part-2-core-concepts/chapter-5-using-redis-for-application-support/5-1-logging-to-redis/).
The app supports metrics generated by the [Redis Receiver](https://github.com/open-telemetry/opentelemetry-collector-contrib/blob/main/receiver/redisreceiver/documentation.md).
:::info
This app includes [built-in monitors](#redis-alerts). For details on creating custom monitors, refer to the [Create monitors for Redis app](#create-monitors-for-redis-app).
:::
## Creating fields in Sumo Logic for Redis
The following are [fields](/docs/manage/fields/) that will be created as part of the Redis App install if not already present.
* **`db.cluster.name`**. User configured. Enter a name to identify this Redis cluster. This cluster name will be shown in the Sumo Logic dashboards.
* **`db.system`**. Has fixed value of redis.
* **`deployment.environment`**. User configured. This is the deployment environment where the Redis cluster resides. For example: dev, prod, or qa.
* **`db.node.name`**. Has the value of host name of the machine which is being monitored.
* **`sumo.datasource`**. Has fixed value of redis.
## Prerequisites
### For metrics collection
The Redis INFO command returns information and statistics about a Redis server (see Redis [INFO](https://redis.io/commands/info) for details). The Redis receiver extracts values from the result and converts them to OpenTelemetry metrics.
### For logs collection
This section provides instructions for configuring log collection for Redis running on a non-Kubernetes environment. By default, Redis logs are stored in a log file.
Follow the instructions to set up log collection:
1. To configure the Redis log file, locate your local [`redis.conf`](https://download.redis.io/redis-stable/redis.conf) configuration file in the database directory. By default, Redis logs are stored in `/var/log/redis/redis-server.log`.
1. After determining the location of conf file, open your `redis.conf` configuration file in a text editor to modify its logging parameters as such:
1. Specify the server verbosity level. The value **`loglevel`** in conf file can be set to one of the following, in ascending order of severity: `debug`, `verbose`, `notice`, `warning`.
1. Specify the log file name. Also the empty string can be used to force Redis to log on the standard output. If you use the standard output for logging but daemonize, logs will be sent to `/dev/null` logfile.
1. Save the `redis.conf` file and restart the Redis server using the command: `sudo service redis-server restart`.
Once the logs are configured to write to a local file, follow the steps below to configure the collection in Sumo Logic.
import LogsCollectionPrereqisites from '../../../reuse/apps/logs-collection-prereqisites.md';
## Collection configuration and app installation
Follow these steps to set up and deploy the source template to collect data in Sumo Logic from a remotely managed OpenTelemetry collector.
### Step 1: Set up remotely managed OpenTelemetry collector
import OtelCollectorInstallation from '../../../reuse/apps/opentelemetry/otel-collector-installation.md';
:::note
If you want to configure your source locally, you can do so by downloading the YAML file. For details, see [Configure OpenTelemetry collectors locally](/docs/integrations/sumo-apps/opentelemetry-collector-insights/#configure-opentelemetry-collectors-locally).
:::
### Step 2: Configure the source template
import RedisConfigureSourceTemplate from '../../../reuse/send-data/redis-configure-source-template.md';
import TimestampParsing from '../../../reuse/apps/opentelemetry/timestamp-parsing.md';
import ProcessingRules from '../../../reuse/opentelemetry/processing-rules.md';
### Step 3: Push the source template to the desired remotely managed collectors
import DataConfiguration from '../../../reuse/apps/opentelemetry/data-configuration.md';
## Sample log messages
Here's a sample log message in a non-Kubernetes environment.
`5275:S 17 Mar 2021 19:13:38.138 * MASTER <-> REPLICA sync: Finished with success`
## Sample queries
### Logs
This sample query is from the **Redis - Logs** dashboard > Logs panel.
```sumo title="Query string"
db.cluster.name=* sumo.datasource="redis"
| json auto maxdepth 1 nodrop
| if (isEmpty(log), _raw, log) as message
| count by message
| limit 100
| fields message
```
### Metrics
This sample query is from the **Redis - Cluster Operations** dashboard Metrics panel.
```sql
sumo.datasource=redis metric=redis.cmd.calls
(cmd=set* or cmd=get* or cmd=incr* or cmd=decr* or cmd=mget or cmd=mset* or cmd=strlen or cmd=psetex or cmd=append)
deployment.environment=* db.cluster.name=* db.node.name=*
| delta
| sum
```
## Viewing Redis dashboards
### Logs
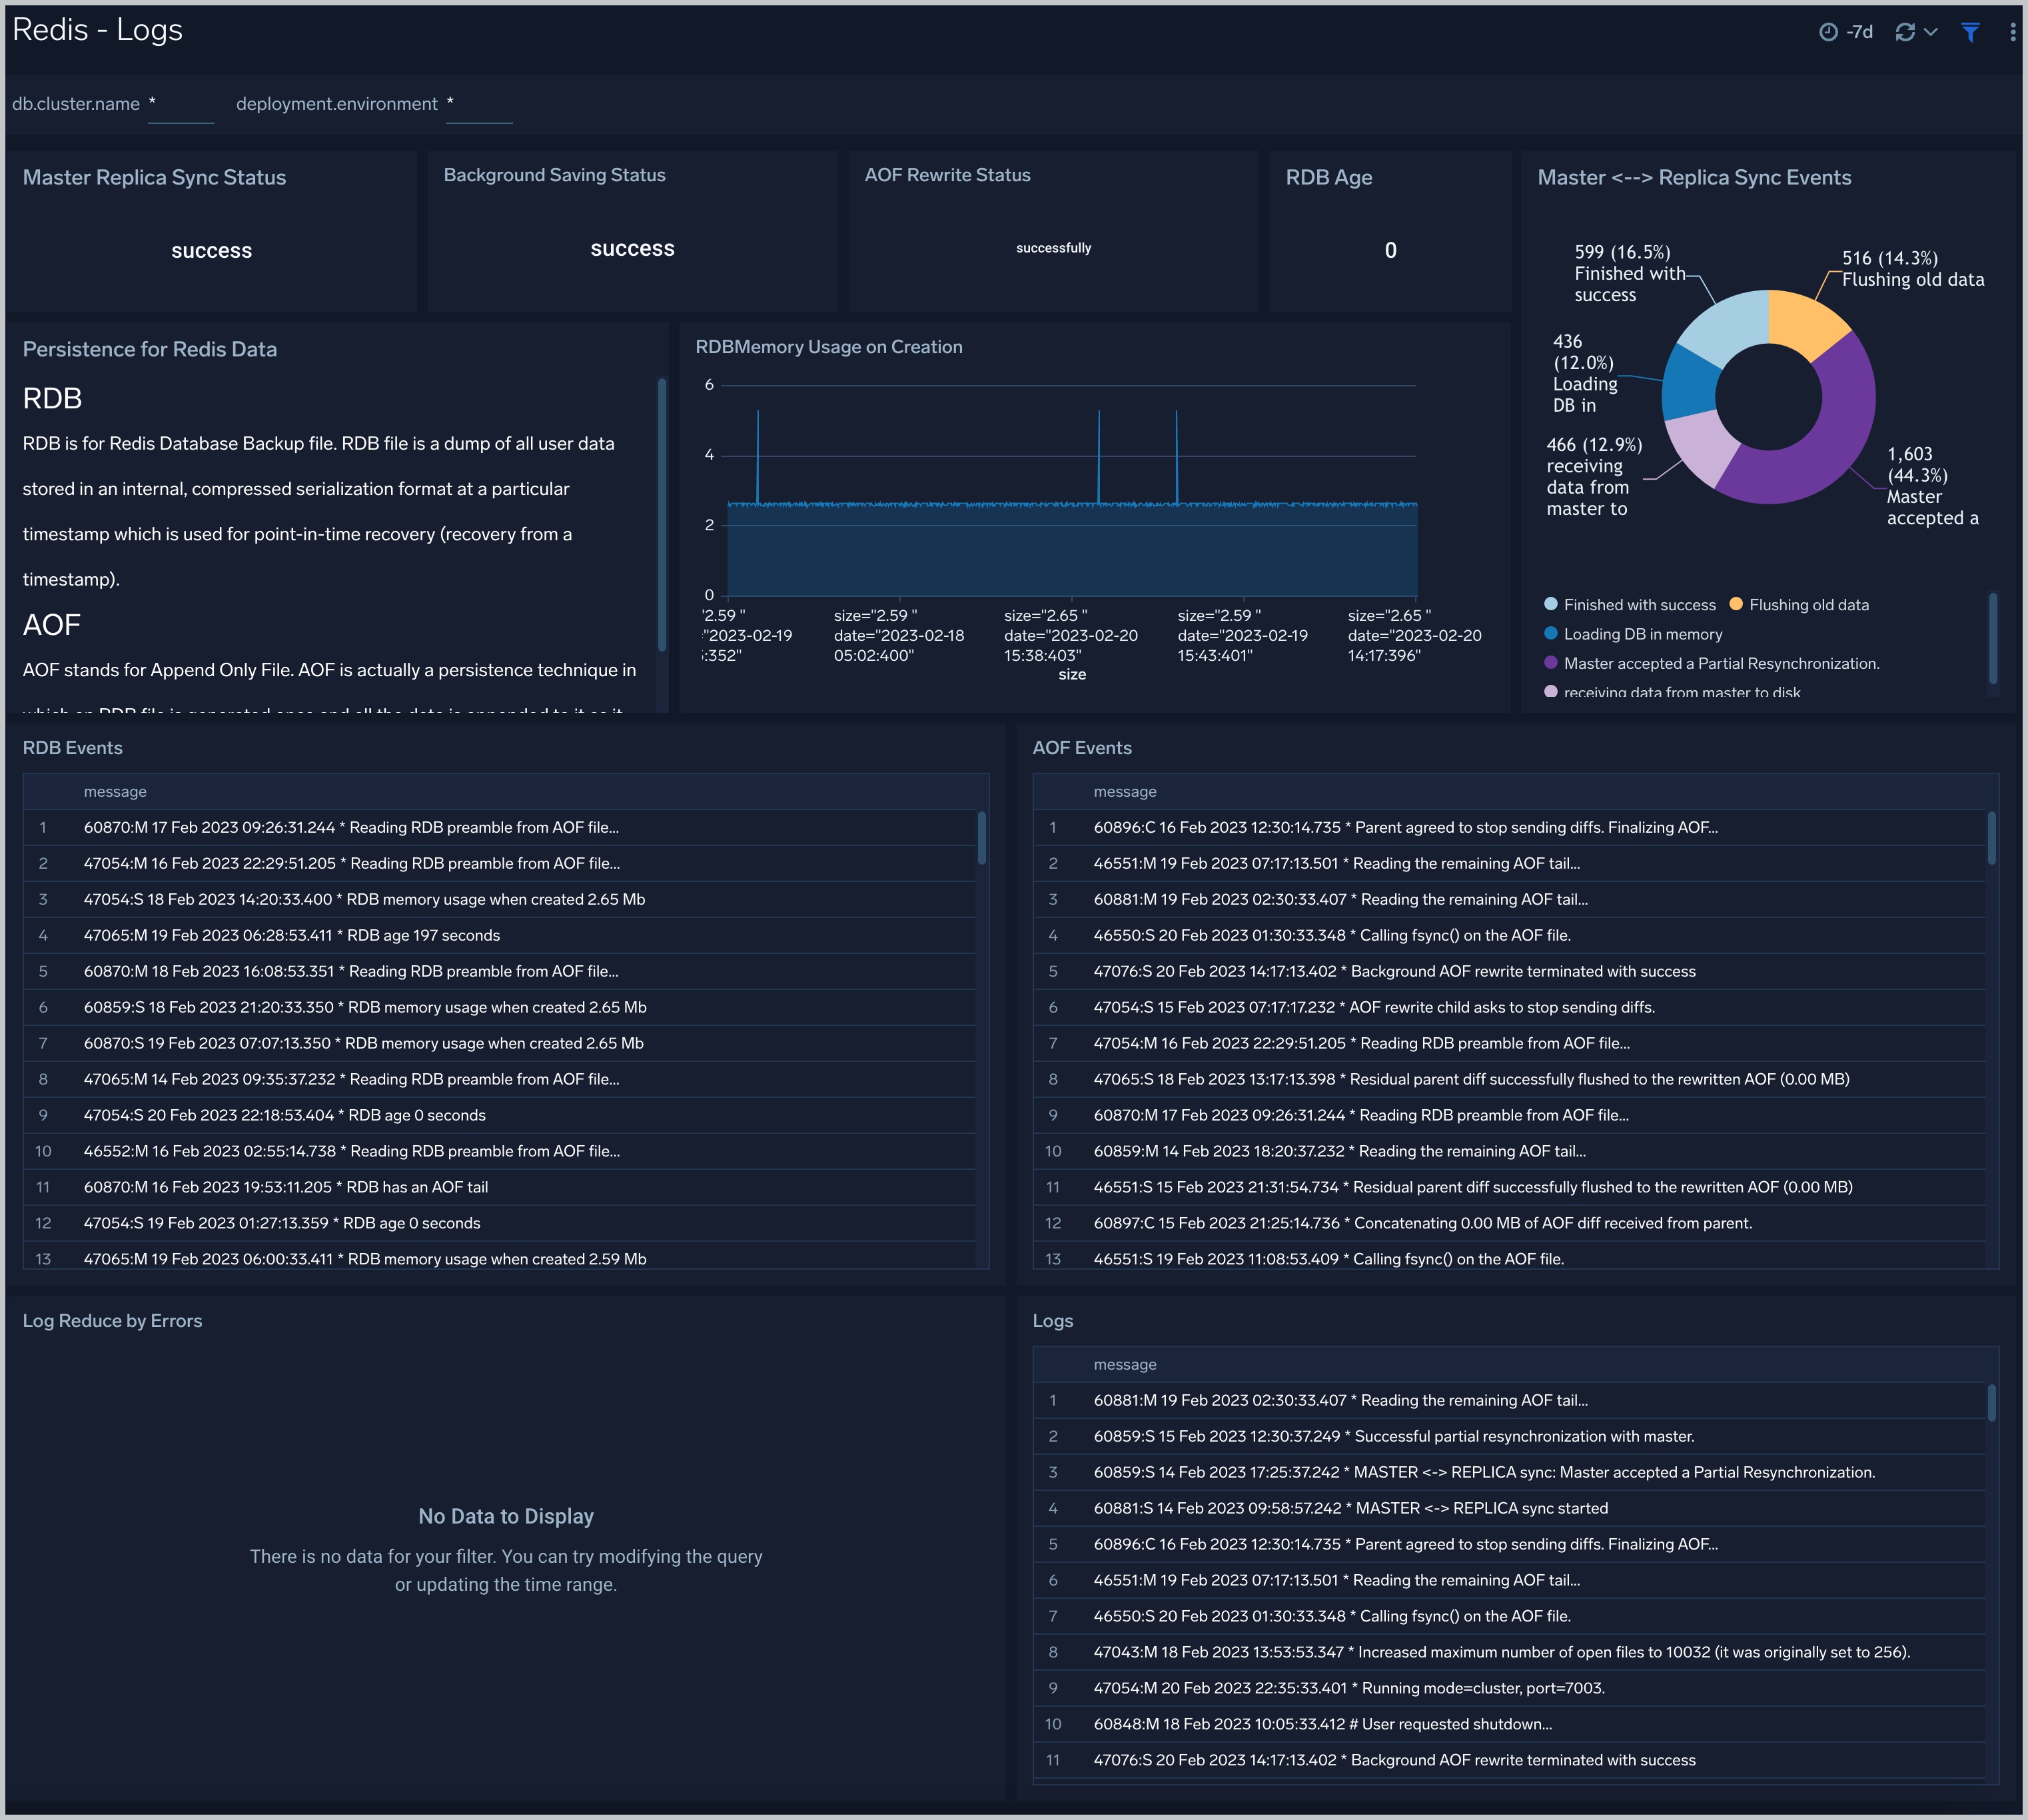
The **Redis - Logs** dashboard provides a detailed analysis based on logs. The panels provide details such as RDBMemory Usage, events, RDB, and AOF events.
Use this dashboard to:
- Review errors and warnings generated by the server.
- Review the RDBMemory Usage, events, RDB, and AOF events.
## Log and metrics types
This app supports metrics and logs for Redis in Cluster mode or Standalone mode. The Redis logs are generated in files as configured in the cluster node configuration files in `/etc/redis/redis.conf`. For more details on Redis logs, see [Redis documentation](https://redislabs.com/ebook/part-2-core-concepts/chapter-5-using-redis-for-application-support/5-1-logging-to-redis/).
The app supports metrics generated by the [Redis Receiver](https://github.com/open-telemetry/opentelemetry-collector-contrib/blob/main/receiver/redisreceiver/documentation.md).
:::info
This app includes [built-in monitors](#redis-alerts). For details on creating custom monitors, refer to the [Create monitors for Redis app](#create-monitors-for-redis-app).
:::
## Creating fields in Sumo Logic for Redis
The following are [fields](/docs/manage/fields/) that will be created as part of the Redis App install if not already present.
* **`db.cluster.name`**. User configured. Enter a name to identify this Redis cluster. This cluster name will be shown in the Sumo Logic dashboards.
* **`db.system`**. Has fixed value of redis.
* **`deployment.environment`**. User configured. This is the deployment environment where the Redis cluster resides. For example: dev, prod, or qa.
* **`db.node.name`**. Has the value of host name of the machine which is being monitored.
* **`sumo.datasource`**. Has fixed value of redis.
## Prerequisites
### For metrics collection
The Redis INFO command returns information and statistics about a Redis server (see Redis [INFO](https://redis.io/commands/info) for details). The Redis receiver extracts values from the result and converts them to OpenTelemetry metrics.
### For logs collection
This section provides instructions for configuring log collection for Redis running on a non-Kubernetes environment. By default, Redis logs are stored in a log file.
Follow the instructions to set up log collection:
1. To configure the Redis log file, locate your local [`redis.conf`](https://download.redis.io/redis-stable/redis.conf) configuration file in the database directory. By default, Redis logs are stored in `/var/log/redis/redis-server.log`.
1. After determining the location of conf file, open your `redis.conf` configuration file in a text editor to modify its logging parameters as such:
1. Specify the server verbosity level. The value **`loglevel`** in conf file can be set to one of the following, in ascending order of severity: `debug`, `verbose`, `notice`, `warning`.
1. Specify the log file name. Also the empty string can be used to force Redis to log on the standard output. If you use the standard output for logging but daemonize, logs will be sent to `/dev/null` logfile.
1. Save the `redis.conf` file and restart the Redis server using the command: `sudo service redis-server restart`.
Once the logs are configured to write to a local file, follow the steps below to configure the collection in Sumo Logic.
import LogsCollectionPrereqisites from '../../../reuse/apps/logs-collection-prereqisites.md';
## Collection configuration and app installation
Follow these steps to set up and deploy the source template to collect data in Sumo Logic from a remotely managed OpenTelemetry collector.
### Step 1: Set up remotely managed OpenTelemetry collector
import OtelCollectorInstallation from '../../../reuse/apps/opentelemetry/otel-collector-installation.md';
:::note
If you want to configure your source locally, you can do so by downloading the YAML file. For details, see [Configure OpenTelemetry collectors locally](/docs/integrations/sumo-apps/opentelemetry-collector-insights/#configure-opentelemetry-collectors-locally).
:::
### Step 2: Configure the source template
import RedisConfigureSourceTemplate from '../../../reuse/send-data/redis-configure-source-template.md';
import TimestampParsing from '../../../reuse/apps/opentelemetry/timestamp-parsing.md';
import ProcessingRules from '../../../reuse/opentelemetry/processing-rules.md';
### Step 3: Push the source template to the desired remotely managed collectors
import DataConfiguration from '../../../reuse/apps/opentelemetry/data-configuration.md';
## Sample log messages
Here's a sample log message in a non-Kubernetes environment.
`5275:S 17 Mar 2021 19:13:38.138 * MASTER <-> REPLICA sync: Finished with success`
## Sample queries
### Logs
This sample query is from the **Redis - Logs** dashboard > Logs panel.
```sumo title="Query string"
db.cluster.name=* sumo.datasource="redis"
| json auto maxdepth 1 nodrop
| if (isEmpty(log), _raw, log) as message
| count by message
| limit 100
| fields message
```
### Metrics
This sample query is from the **Redis - Cluster Operations** dashboard Metrics panel.
```sql
sumo.datasource=redis metric=redis.cmd.calls
(cmd=set* or cmd=get* or cmd=incr* or cmd=decr* or cmd=mget or cmd=mset* or cmd=strlen or cmd=psetex or cmd=append)
deployment.environment=* db.cluster.name=* db.node.name=*
| delta
| sum
```
## Viewing Redis dashboards
### Logs
The **Redis - Logs** dashboard provides a detailed analysis based on logs. The panels provide details such as RDBMemory Usage, events, RDB, and AOF events.
Use this dashboard to:
- Review errors and warnings generated by the server.
- Review the RDBMemory Usage, events, RDB, and AOF events.
 ### Overview
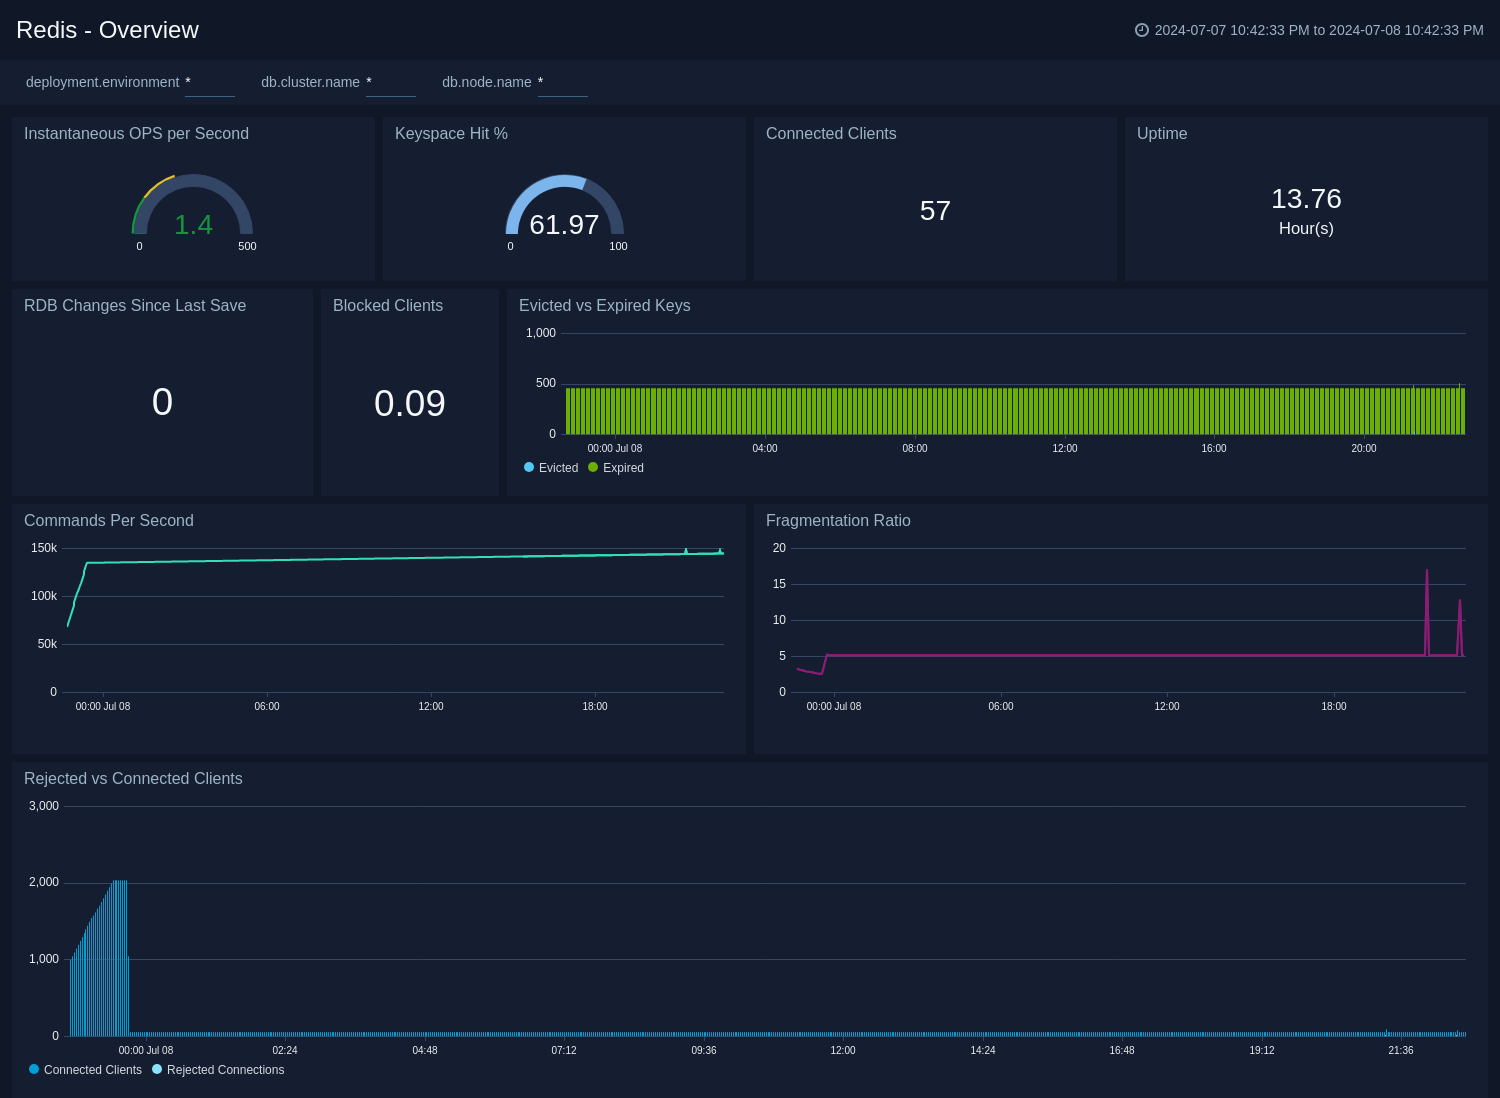
The **Redis - Overview** dashboard provides an at-a-glance view of the Redis server status and error logs, along with database metrics.
Use this dashboard to review keyspace hit, connected clients, Uptime, Evicted vs Expired Keys, and Commands Per Seconds.
### Overview
The **Redis - Overview** dashboard provides an at-a-glance view of the Redis server status and error logs, along with database metrics.
Use this dashboard to review keyspace hit, connected clients, Uptime, Evicted vs Expired Keys, and Commands Per Seconds.
 ### Cluster Operations
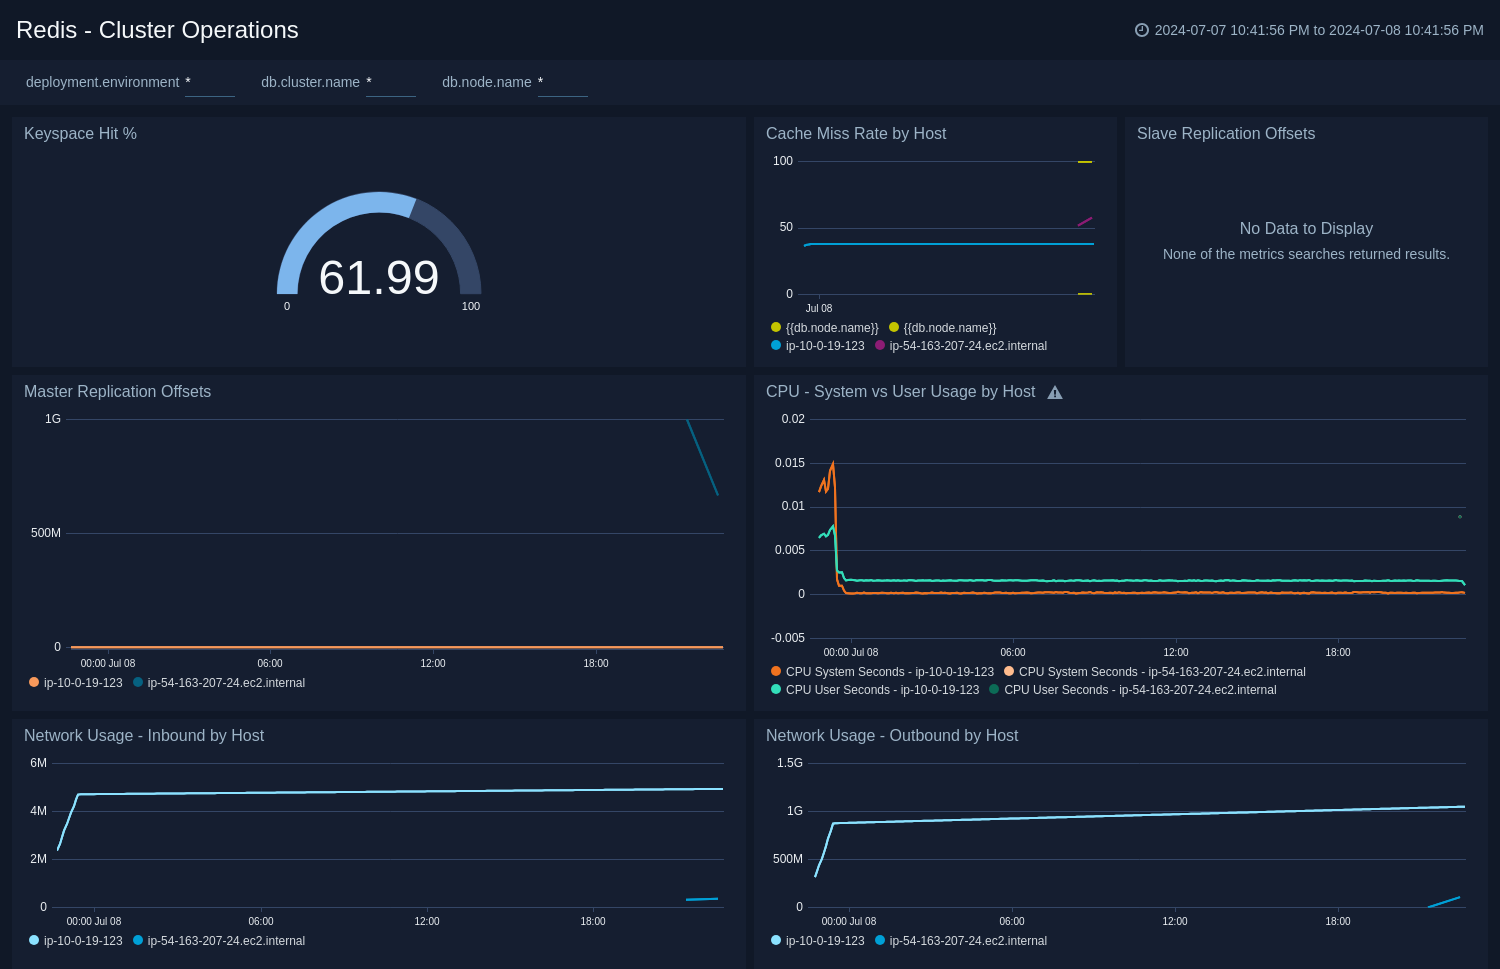
The **Redis - Cluster Operations** Operations dashboard provides a high-level view of the activity and health of Master and Slaves on your network. Dashboard panels display visual graphs and detailed information on cache rate and most importantly, resource usage.
Use this dashboard to review keyspace hit, Cache miss rate by host, CPU - System vs User usage by host, and Network Usage - Inbound/Outbound by Host.
### Cluster Operations
The **Redis - Cluster Operations** Operations dashboard provides a high-level view of the activity and health of Master and Slaves on your network. Dashboard panels display visual graphs and detailed information on cache rate and most importantly, resource usage.
Use this dashboard to review keyspace hit, Cache miss rate by host, CPU - System vs User usage by host, and Network Usage - Inbound/Outbound by Host.
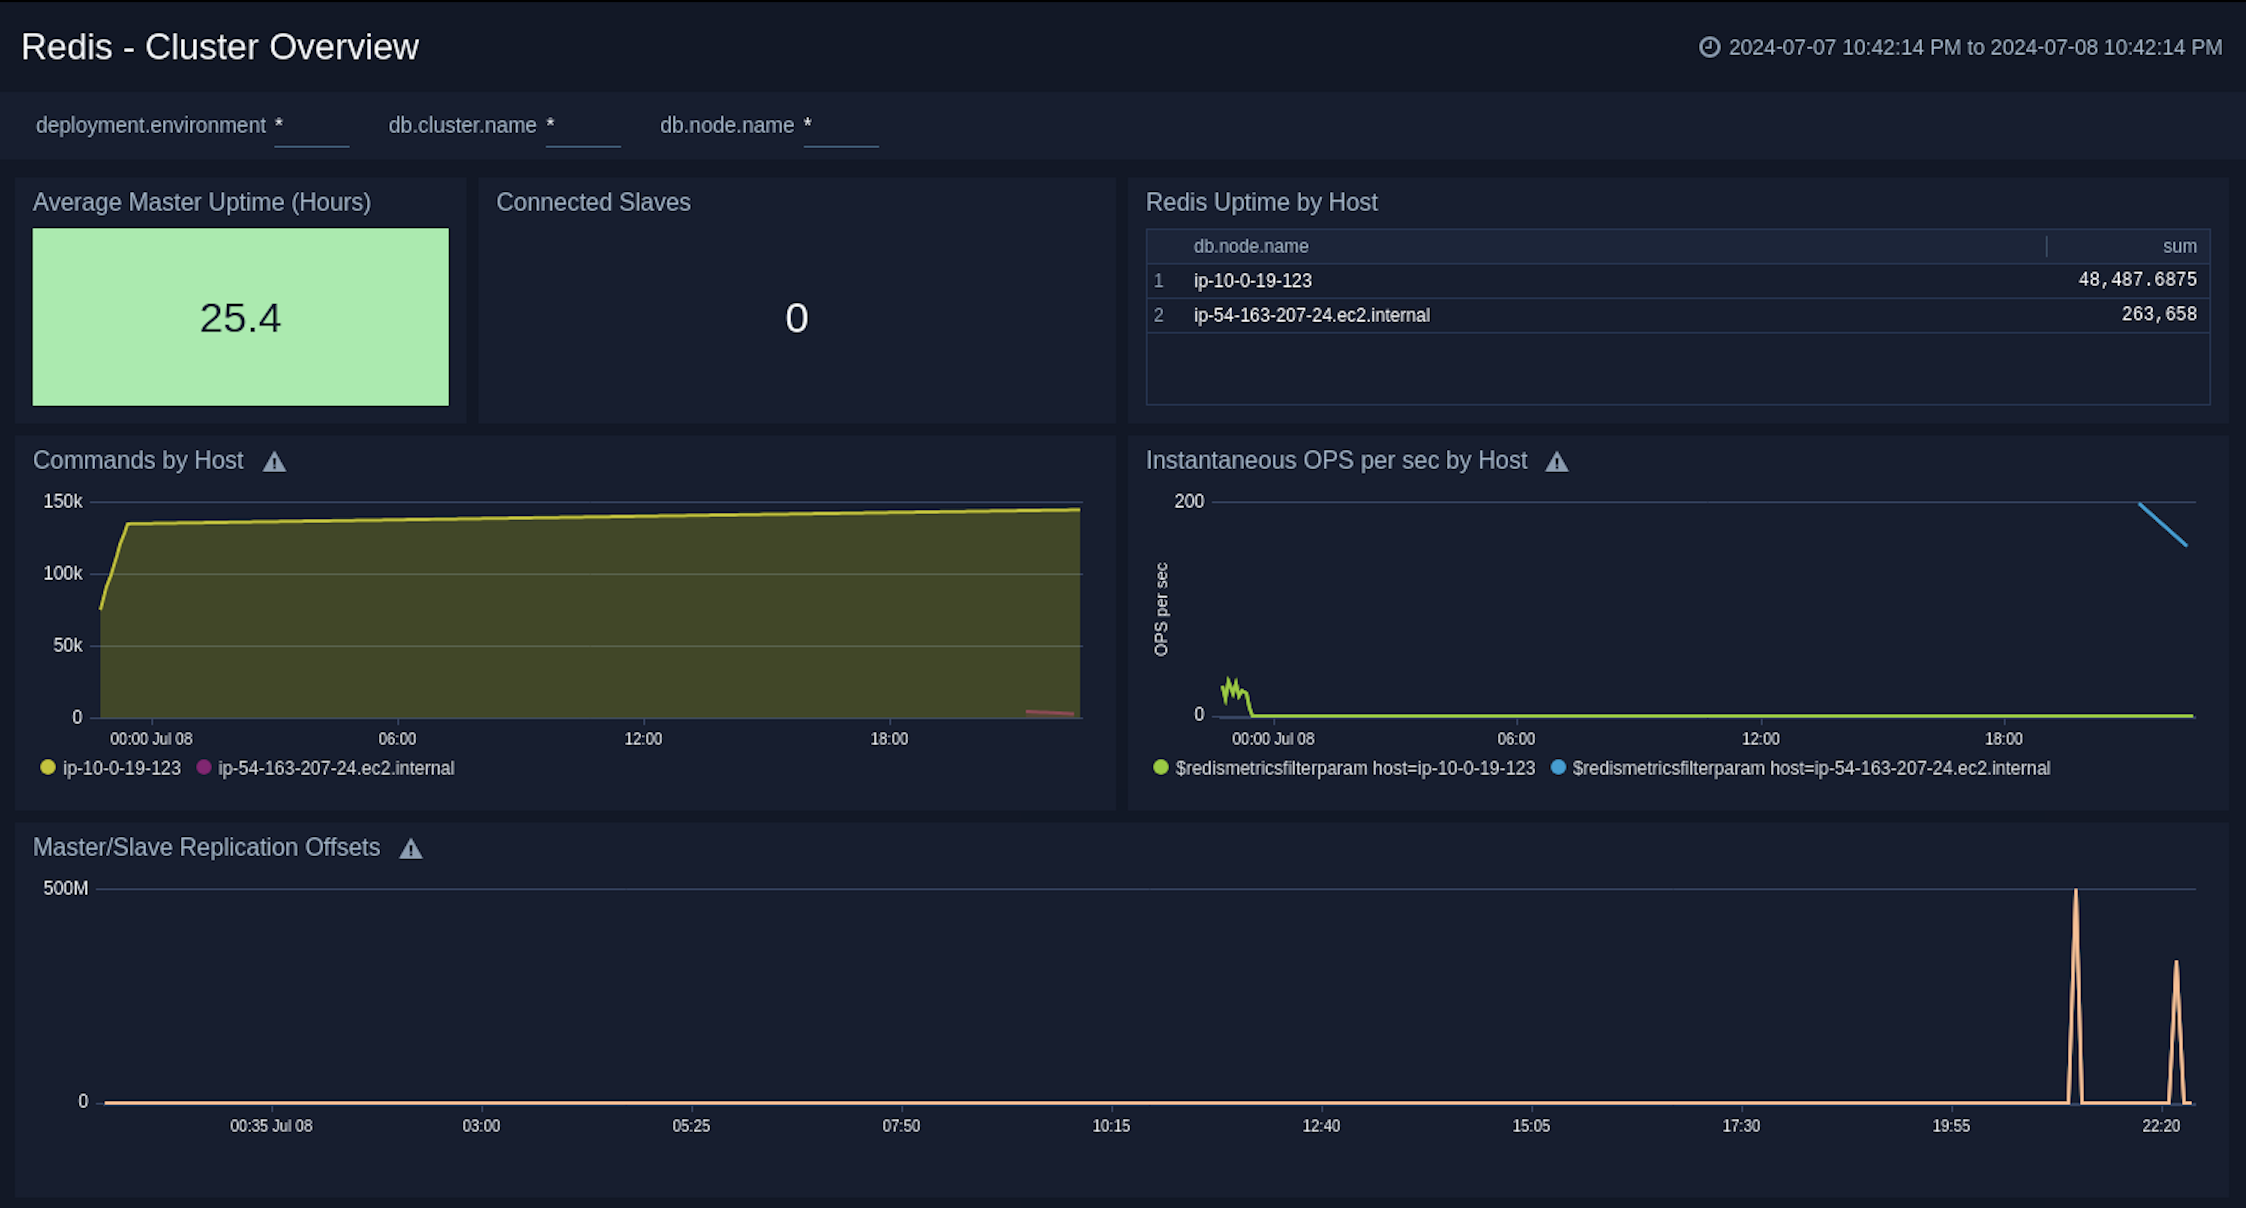
 ### Cluster Overview
The **Redis - Cluster Overview** dashboard provides a high-level view of cluster infrastructure, comparisons, and trends.
Use this dashboard to review Average Master Uptime, Connected Slaves, Redis Uptime by Host, Commands by Host, and Instantaneous OPS per sec by Host.
### Cluster Overview
The **Redis - Cluster Overview** dashboard provides a high-level view of cluster infrastructure, comparisons, and trends.
Use this dashboard to review Average Master Uptime, Connected Slaves, Redis Uptime by Host, Commands by Host, and Instantaneous OPS per sec by Host.
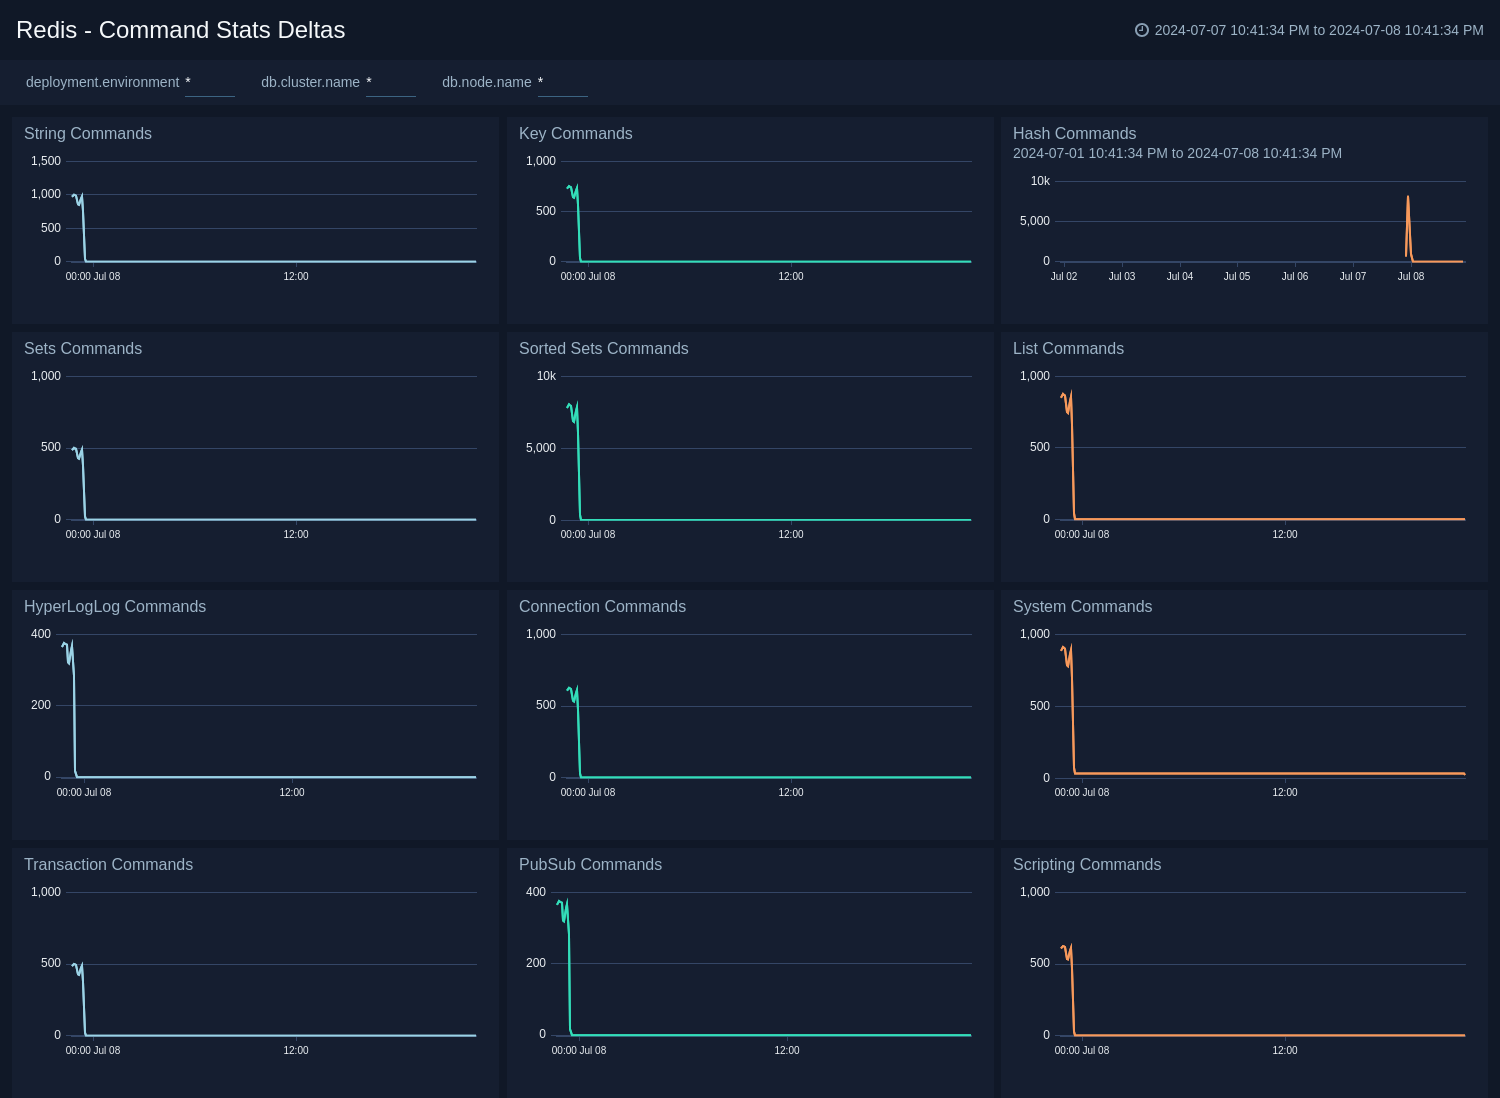
 ### Command Stats Delta
The **Redis - Command Stats Delta** dashboard provides an at-a-glance view of commands running on your Redis server.
Use this dashboard to review String Commands, Key Commands, Hash Commands, Sets Commands, Sorted Sets Commands, List Commands, Transaction Commands, and Scripting Commands.
### Command Stats Delta
The **Redis - Command Stats Delta** dashboard provides an at-a-glance view of commands running on your Redis server.
Use this dashboard to review String Commands, Key Commands, Hash Commands, Sets Commands, Sorted Sets Commands, List Commands, Transaction Commands, and Scripting Commands.
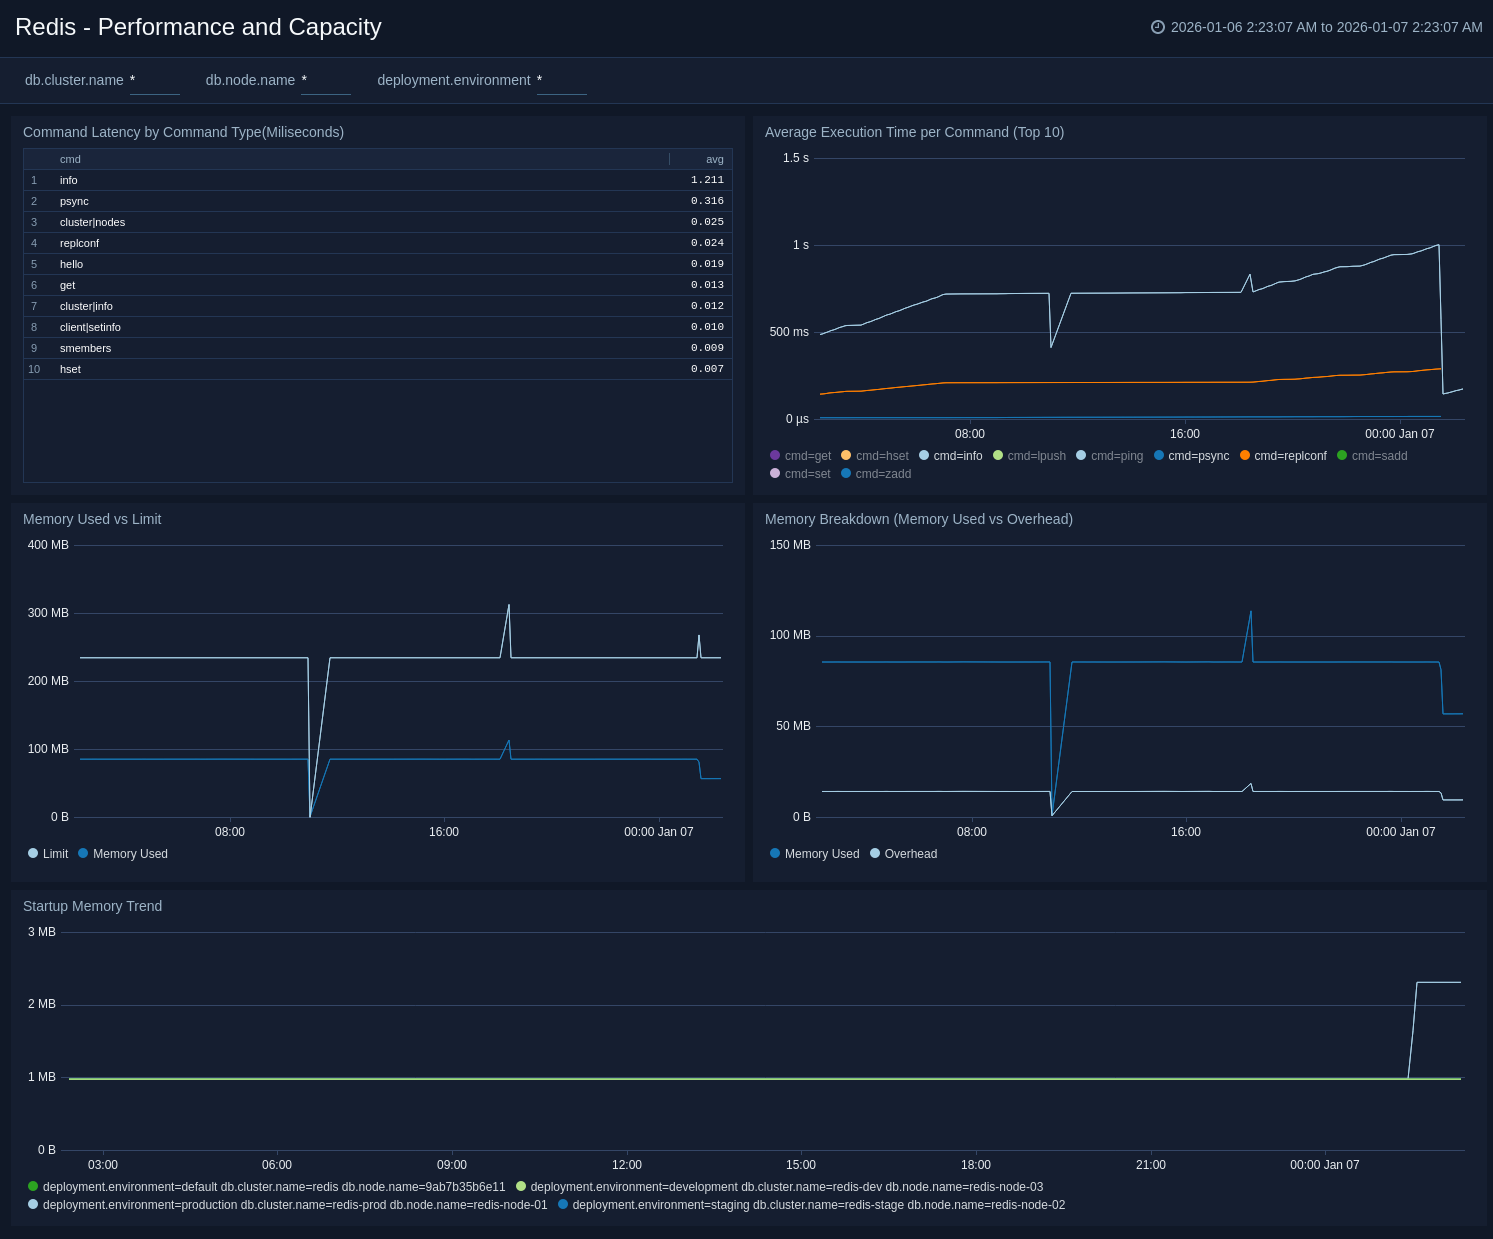
 ### Performance and Capacity
The **Redis – Performance and Capacity** dashboard provides at-a-glance view of key Redis performance metrics and resource limits.
This dashboard offers detailed insights into command latency analysis, execution time tracking, memory consumption patterns, and capacity limits, enabling teams to monitor performance, optimize resource usage, and proactively prevent capacity-related issues.
### Performance and Capacity
The **Redis – Performance and Capacity** dashboard provides at-a-glance view of key Redis performance metrics and resource limits.
This dashboard offers detailed insights into command latency analysis, execution time tracking, memory consumption patterns, and capacity limits, enabling teams to monitor performance, optimize resource usage, and proactively prevent capacity-related issues.
 ## Create monitors for Redis app
import CreateMonitors from '../../../reuse/apps/create-monitors.md';
### Redis alerts
| Name | Description | Alert Condition | Recover Condition |
|:--|:--|:--|:--|
| `Redis - High Memory Fragmentation Ratio` | This alert is triggered when the ratio of Redis memory usage to Linux virtual memory pages (mapped to physical memory chunks) is higher than 1.5. A high ratio will lead to swapping and can adversely affect performance. | Count > 1.5 | Count < = 1.5 |
| `Redis - Instance Down` | This alert is triggered if the Redis instance is down for 5 minutes. | Missing Data | Data Found |
| `Redis - Rejected Connections` | This alert is triggered when some connections to a Redis cluster have been rejected. | Count > 0 | Count < = 0 |
| `Redis - Replication Broken` | This alert is triggered when a Redis instance has lost all slaves. This will affect the redundancy of data stored in Redis. We suggest you to review how replication has been configured. | Count < 1 | Count > = 1 |
| `Redis - Replication Offset` | This alert is triggered when the replication offset in a given Redis cluster is greater than 1 MB for last 5 minutes. We suggest you to review how replication has been configured. | Count > = 1 | Count < 1 |
| `Redis - Too Many Connections` | This alert is triggered when a given Redis server has too many connections (default is 100). | Count > 100 | Count < = 100 |
## Create monitors for Redis app
import CreateMonitors from '../../../reuse/apps/create-monitors.md';
### Redis alerts
| Name | Description | Alert Condition | Recover Condition |
|:--|:--|:--|:--|
| `Redis - High Memory Fragmentation Ratio` | This alert is triggered when the ratio of Redis memory usage to Linux virtual memory pages (mapped to physical memory chunks) is higher than 1.5. A high ratio will lead to swapping and can adversely affect performance. | Count > 1.5 | Count < = 1.5 |
| `Redis - Instance Down` | This alert is triggered if the Redis instance is down for 5 minutes. | Missing Data | Data Found |
| `Redis - Rejected Connections` | This alert is triggered when some connections to a Redis cluster have been rejected. | Count > 0 | Count < = 0 |
| `Redis - Replication Broken` | This alert is triggered when a Redis instance has lost all slaves. This will affect the redundancy of data stored in Redis. We suggest you to review how replication has been configured. | Count < 1 | Count > = 1 |
| `Redis - Replication Offset` | This alert is triggered when the replication offset in a given Redis cluster is greater than 1 MB for last 5 minutes. We suggest you to review how replication has been configured. | Count > = 1 | Count < 1 |
| `Redis - Too Many Connections` | This alert is triggered when a given Redis server has too many connections (default is 100). | Count > 100 | Count < = 100 |