---
id: linux-opentelemetry
title: Linux - OpenTelemetry Collector
sidebar_label: Linux - OTel Collector
description: Learn about the Sumo Logic OpenTelemetry app for Linux.
slug: /help/docs/integrations/hosts-operating-systems/opentelemetry/linux-opentelemetry/
canonical: https://www.sumologic.com/help/docs/integrations/hosts-operating-systems/opentelemetry/linux-opentelemetry/
---
import useBaseUrl from '@docusaurus/useBaseUrl';
import Tabs from '@theme/Tabs';
import TabItem from '@theme/TabItem';
})
}) The Sumo Logic app for Linux allows you to monitor the performance and resource utilization of hosts and processes that your mission-critical applications are dependent upon. In addition to that, it allows you to view information about events, logins, and the security status of your Linux system using Linux system logs.
The app consists of predefined searches and dashboards that provide visibility into your environment for real-time or historical analysis. Our dashboards provide insight into CPU, memory, network, file descriptors, page faults, and TCP connectors. This app uses OpenTelemetry, an open-source collector for the collection of both metrics and log data.
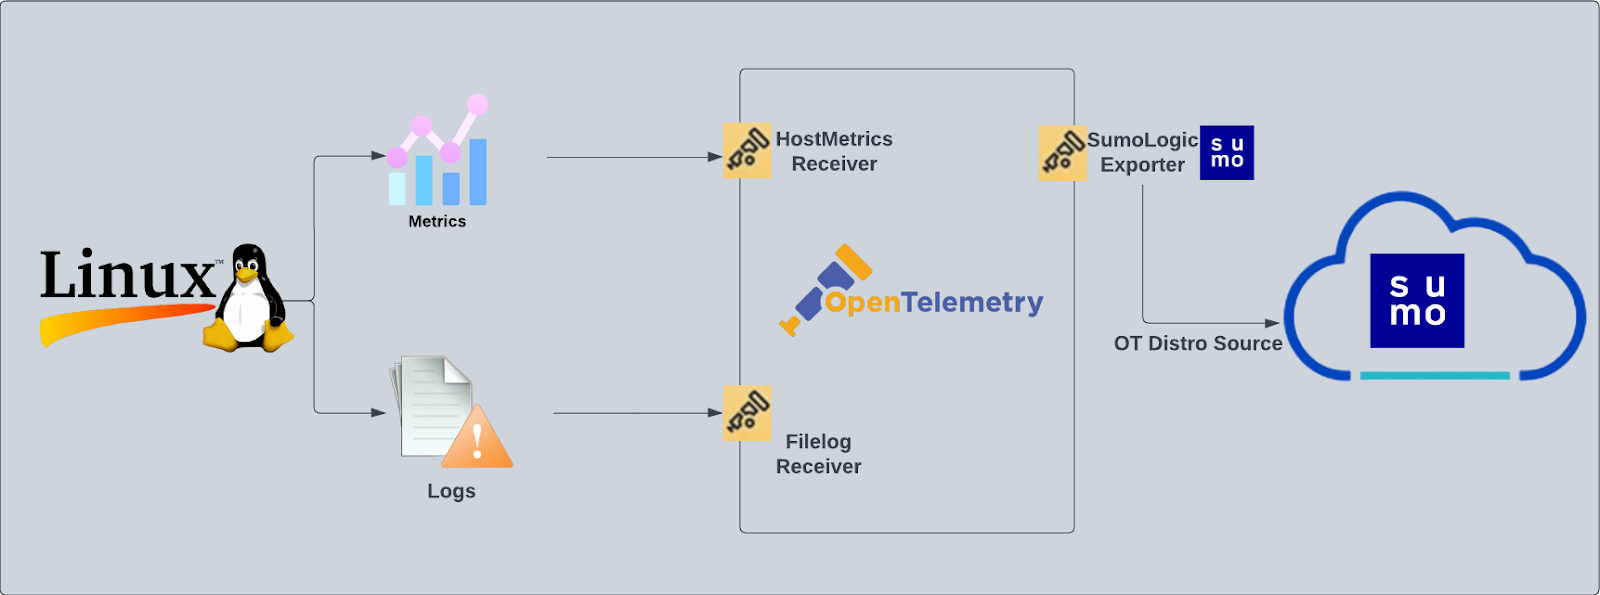
We use the Sumo Logic Distribution for OpenTelemetry Collector to collect Linux metrics and system logs. The OpenTelemetry collector runs on the Linux machine and uses the [Host Metric Receiver](https://github.com/open-telemetry/opentelemetry-collector-contrib/tree/main/receiver/hostmetricsreceiver) to obtain Host and process metrics, and the [Sumo Logic OpenTelemetry Exporter](https://github.com/open-telemetry/opentelemetry-collector-contrib/tree/main/exporter/sumologicexporter) to send the metrics to Sumo Logic. Linux logs are sent to Sumo Logic through a [filelog receiver](https://github.com/open-telemetry/opentelemetry-collector-contrib/tree/main/receiver/filelogreceiver).
The Sumo Logic app for Linux allows you to monitor the performance and resource utilization of hosts and processes that your mission-critical applications are dependent upon. In addition to that, it allows you to view information about events, logins, and the security status of your Linux system using Linux system logs.
The app consists of predefined searches and dashboards that provide visibility into your environment for real-time or historical analysis. Our dashboards provide insight into CPU, memory, network, file descriptors, page faults, and TCP connectors. This app uses OpenTelemetry, an open-source collector for the collection of both metrics and log data.
We use the Sumo Logic Distribution for OpenTelemetry Collector to collect Linux metrics and system logs. The OpenTelemetry collector runs on the Linux machine and uses the [Host Metric Receiver](https://github.com/open-telemetry/opentelemetry-collector-contrib/tree/main/receiver/hostmetricsreceiver) to obtain Host and process metrics, and the [Sumo Logic OpenTelemetry Exporter](https://github.com/open-telemetry/opentelemetry-collector-contrib/tree/main/exporter/sumologicexporter) to send the metrics to Sumo Logic. Linux logs are sent to Sumo Logic through a [filelog receiver](https://github.com/open-telemetry/opentelemetry-collector-contrib/tree/main/receiver/filelogreceiver).
 :::info
This app includes [built-in monitors](#linux-alerts). For details on creating custom monitors, refer to [Create monitors for Linux app](#create-monitors-for-linux-app).
:::
## Fields Created in Sumo Logic for Linux
Following are the [fields](/docs/manage/fields) that will be created as part of Linux app install if not already present.
- **`sumo.datasource`**. Has a fixed value of `linux`.
- **`deployment.environment`**. This is a collector level field and is user configured (at the time of collector installation). Through this, the linux host cluster is identified by the environment where it resides. For example: `dev`, `prod`, or `qa`.
- **`host.group`**. This is a collector level field and is user configured (at the time of collector installation). Through this, the linux host cluster is identified.
- **`host.name`**. This is tagged through the `resourcedetection` processor. It holds the value of the host name where the OTel collector is installed.
## Prereqisites
This app is based on the following log files from the Ubuntu Linux machine.
- auth.log
- syslog
- daemon.log
- dpkg.log
- kern.log
- CentOS, Amazon Linux, and Red Hat
- audit/audit.log
- secure
- messages
- yum.log
:::note
If you've already configured collection of these log files (for example, during Linux or Linux - PCI app setup), then no additional log file collection is required. If any log files are missing, you can configure the missing file collection in the next step.
:::
import LogsCollectionPrereqisites from '../../../reuse/apps/logs-collection-prereqisites.md';
## Collection configuration and app installation
:::note
You can skip this section if you have already set up the logs collection through [Linux PCI](/docs/integrations/pci-compliance/opentelemetry/linux-opentelemetry) or [Linux - Cloud Security Monitoring and Analytics](/docs/integrations/cloud-security-monitoring-analytics/opentelemetry/linux-opentelemetry) app installation. Additional collection is not required as the logs used by this app are already ingested into Sumo Logic.
:::
Follow these steps to set up and deploy the source template to collect data in Sumo Logic from a remotely managed OpenTelemetry collector.
### Step 1: Set up remotely managed OpenTelemetry collector
import OtelCollectorInstallation from '../../../reuse/apps/opentelemetry/otel-collector-installation.md';
:::note
If you want to configure your source locally, you can do so by downloading the YAML file. For details, see [Configure OpenTelemetry collectors locally](/docs/integrations/sumo-apps/opentelemetry-collector-insights/#configure-opentelemetry-collectors-locally).
:::
### Step 2: Configure the source template
import LinuxConfigureSourceTemplate from '../../../reuse/send-data/linux-configure-source-template.md';
### Step 3: Push the source template to the desired remotely managed collectors
import DataConfiguration from '../../../reuse/apps/opentelemetry/data-configuration.md';
## Sample log messages
```
Dec 13 04:44:00 <1> [zypper++] Summary.cc(readPool):133 I_TsU(27372)Mesa-libGL1-8.0.4-20.4.1.i586(@System)
```
## Sample metrics
```json
{
"queryId":"A",
"_source":"linux-otel-metric",
"process.executable.name":"apache2",
"_sourceName":"Http Input",
"process.command":"/usr/sbin/apache2",
"host":"ip-172-31-90-39.ec2.internal",
"os.type":"linux",
"sumo.datasource":"linux",
"process.executable.path":"/usr/sbin/apache2",
"process.command_line":"/usr/sbin/apache2_-k_start",
"process.owner":"www-data",
"_sourceCategory":"Labs/linux-otel/metric",
"_contentType":"Carbon2",
"metric":"process.memory.physical_usage",
"_collectorId":"000000000C984E1A",
"_sourceId":"0000000042E512AE",
"unit":"By",
"_collector":"Labs - linux-otel",
"process.pid":"26967",
"max":42295296,
"min":536576,
"avg":9061120,
"sum":144977920,
"latest":8069120,
"count":16
}
```
## Sample queries
### Log query
This is a sample log query from the **Total Event Distribution** panel.
```sumo
%"sumo.datasource"=linux
| parse regex "\d+\s+\d+:\d+:\d+\s(?\S+)\s(?\w*)(?:\[\d+\]|):\s+"
|where dest_hostname matches "{{dest_hostname}}" AND process_name matches "{{process_name}}"
|count as Events by dest_hostname
```
### Metrics query
This is a metrics query from the **CPU Utilization Over Time** panel.
```sql
sumo.datasource=linux host.name=* metric=system.cpu.utilization state=(user OR system OR wait OR steal OR softirq OR interrupt OR nice) | sum by host.name | outlier
```
## Viewing Linux dashboards
All dashboards have a set of filters that you can apply to the entire dashboard. Use these filters to drill down and examine the data to a granular level.
- You can change the time range for a dashboard or panel by selecting a predefined interval from a drop-down list, choosing a recently used time range, or specifying custom dates and times. [Learn more](/docs/dashboards/set-custom-time-ranges/).
- You can use template variables to drill down and examine the data on a granular level. For more information, see [Filtering Dashboards with Template Variables](/docs/dashboards/filter-template-variables/).
### Linux - Overview
The **Linux - Overview** dashboard provides an overview of Linux activity, including the distribution of system events across hosts, group assignment changes, successful and failed logins, sudo attempts, and the count of reporting hosts. This dashboard also gives you an at-a-glance view of the key metrics like CPU, memory, disk, network, and TCP connections of all your hosts. You can drill down from this dashboard to the Host Metrics - CPU/Disk/Memory/Network/TCP dashboard by using the honeycombs or line charts in all the panels.
:::info
This app includes [built-in monitors](#linux-alerts). For details on creating custom monitors, refer to [Create monitors for Linux app](#create-monitors-for-linux-app).
:::
## Fields Created in Sumo Logic for Linux
Following are the [fields](/docs/manage/fields) that will be created as part of Linux app install if not already present.
- **`sumo.datasource`**. Has a fixed value of `linux`.
- **`deployment.environment`**. This is a collector level field and is user configured (at the time of collector installation). Through this, the linux host cluster is identified by the environment where it resides. For example: `dev`, `prod`, or `qa`.
- **`host.group`**. This is a collector level field and is user configured (at the time of collector installation). Through this, the linux host cluster is identified.
- **`host.name`**. This is tagged through the `resourcedetection` processor. It holds the value of the host name where the OTel collector is installed.
## Prereqisites
This app is based on the following log files from the Ubuntu Linux machine.
- auth.log
- syslog
- daemon.log
- dpkg.log
- kern.log
- CentOS, Amazon Linux, and Red Hat
- audit/audit.log
- secure
- messages
- yum.log
:::note
If you've already configured collection of these log files (for example, during Linux or Linux - PCI app setup), then no additional log file collection is required. If any log files are missing, you can configure the missing file collection in the next step.
:::
import LogsCollectionPrereqisites from '../../../reuse/apps/logs-collection-prereqisites.md';
## Collection configuration and app installation
:::note
You can skip this section if you have already set up the logs collection through [Linux PCI](/docs/integrations/pci-compliance/opentelemetry/linux-opentelemetry) or [Linux - Cloud Security Monitoring and Analytics](/docs/integrations/cloud-security-monitoring-analytics/opentelemetry/linux-opentelemetry) app installation. Additional collection is not required as the logs used by this app are already ingested into Sumo Logic.
:::
Follow these steps to set up and deploy the source template to collect data in Sumo Logic from a remotely managed OpenTelemetry collector.
### Step 1: Set up remotely managed OpenTelemetry collector
import OtelCollectorInstallation from '../../../reuse/apps/opentelemetry/otel-collector-installation.md';
:::note
If you want to configure your source locally, you can do so by downloading the YAML file. For details, see [Configure OpenTelemetry collectors locally](/docs/integrations/sumo-apps/opentelemetry-collector-insights/#configure-opentelemetry-collectors-locally).
:::
### Step 2: Configure the source template
import LinuxConfigureSourceTemplate from '../../../reuse/send-data/linux-configure-source-template.md';
### Step 3: Push the source template to the desired remotely managed collectors
import DataConfiguration from '../../../reuse/apps/opentelemetry/data-configuration.md';
## Sample log messages
```
Dec 13 04:44:00 <1> [zypper++] Summary.cc(readPool):133 I_TsU(27372)Mesa-libGL1-8.0.4-20.4.1.i586(@System)
```
## Sample metrics
```json
{
"queryId":"A",
"_source":"linux-otel-metric",
"process.executable.name":"apache2",
"_sourceName":"Http Input",
"process.command":"/usr/sbin/apache2",
"host":"ip-172-31-90-39.ec2.internal",
"os.type":"linux",
"sumo.datasource":"linux",
"process.executable.path":"/usr/sbin/apache2",
"process.command_line":"/usr/sbin/apache2_-k_start",
"process.owner":"www-data",
"_sourceCategory":"Labs/linux-otel/metric",
"_contentType":"Carbon2",
"metric":"process.memory.physical_usage",
"_collectorId":"000000000C984E1A",
"_sourceId":"0000000042E512AE",
"unit":"By",
"_collector":"Labs - linux-otel",
"process.pid":"26967",
"max":42295296,
"min":536576,
"avg":9061120,
"sum":144977920,
"latest":8069120,
"count":16
}
```
## Sample queries
### Log query
This is a sample log query from the **Total Event Distribution** panel.
```sumo
%"sumo.datasource"=linux
| parse regex "\d+\s+\d+:\d+:\d+\s(?\S+)\s(?\w*)(?:\[\d+\]|):\s+"
|where dest_hostname matches "{{dest_hostname}}" AND process_name matches "{{process_name}}"
|count as Events by dest_hostname
```
### Metrics query
This is a metrics query from the **CPU Utilization Over Time** panel.
```sql
sumo.datasource=linux host.name=* metric=system.cpu.utilization state=(user OR system OR wait OR steal OR softirq OR interrupt OR nice) | sum by host.name | outlier
```
## Viewing Linux dashboards
All dashboards have a set of filters that you can apply to the entire dashboard. Use these filters to drill down and examine the data to a granular level.
- You can change the time range for a dashboard or panel by selecting a predefined interval from a drop-down list, choosing a recently used time range, or specifying custom dates and times. [Learn more](/docs/dashboards/set-custom-time-ranges/).
- You can use template variables to drill down and examine the data on a granular level. For more information, see [Filtering Dashboards with Template Variables](/docs/dashboards/filter-template-variables/).
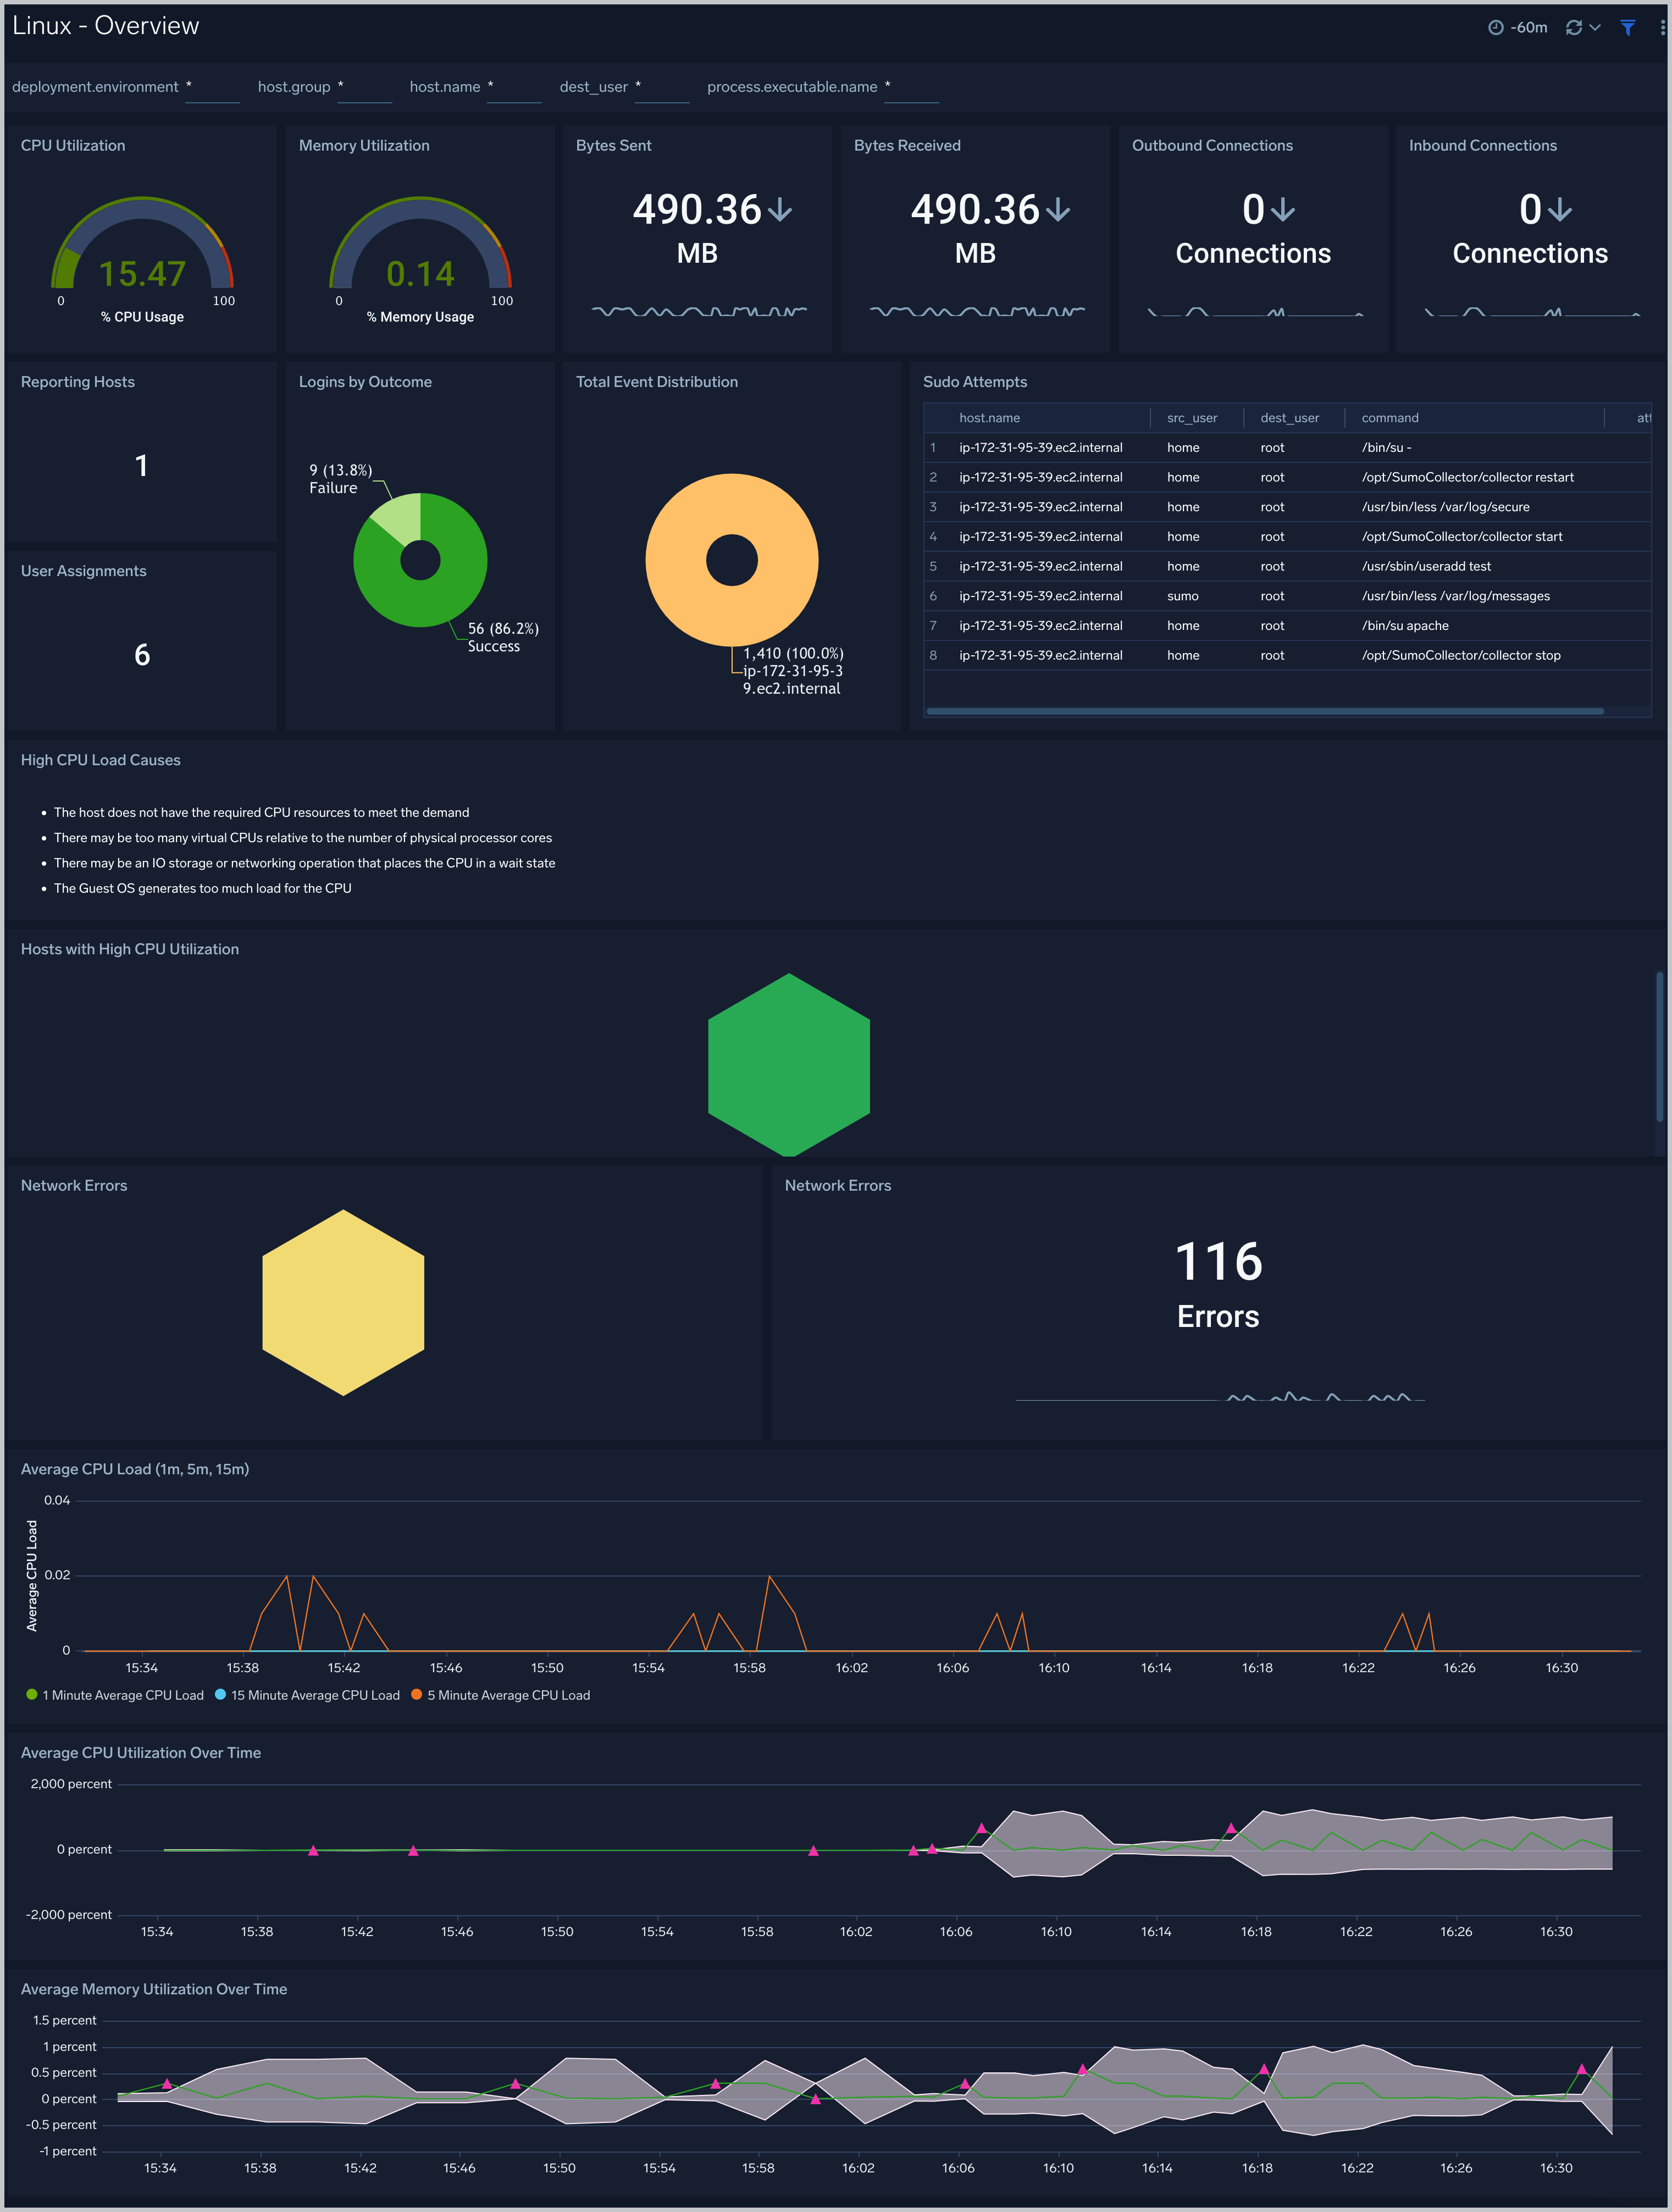
### Linux - Overview
The **Linux - Overview** dashboard provides an overview of Linux activity, including the distribution of system events across hosts, group assignment changes, successful and failed logins, sudo attempts, and the count of reporting hosts. This dashboard also gives you an at-a-glance view of the key metrics like CPU, memory, disk, network, and TCP connections of all your hosts. You can drill down from this dashboard to the Host Metrics - CPU/Disk/Memory/Network/TCP dashboard by using the honeycombs or line charts in all the panels.
 ### Host Metrics - CPU
The **Host Metrics - CPU** dashboard provides a detailed analysis based on CPU metrics. You can drill down from this dashboard to the Process Metrics - Details dashboard by using the honeycombs or line charts in all the panels.
Use this dashboard to:
- Identify hosts and processes with high CPU utilization.
- Examine CPU usage by type and identify anomalies over time.
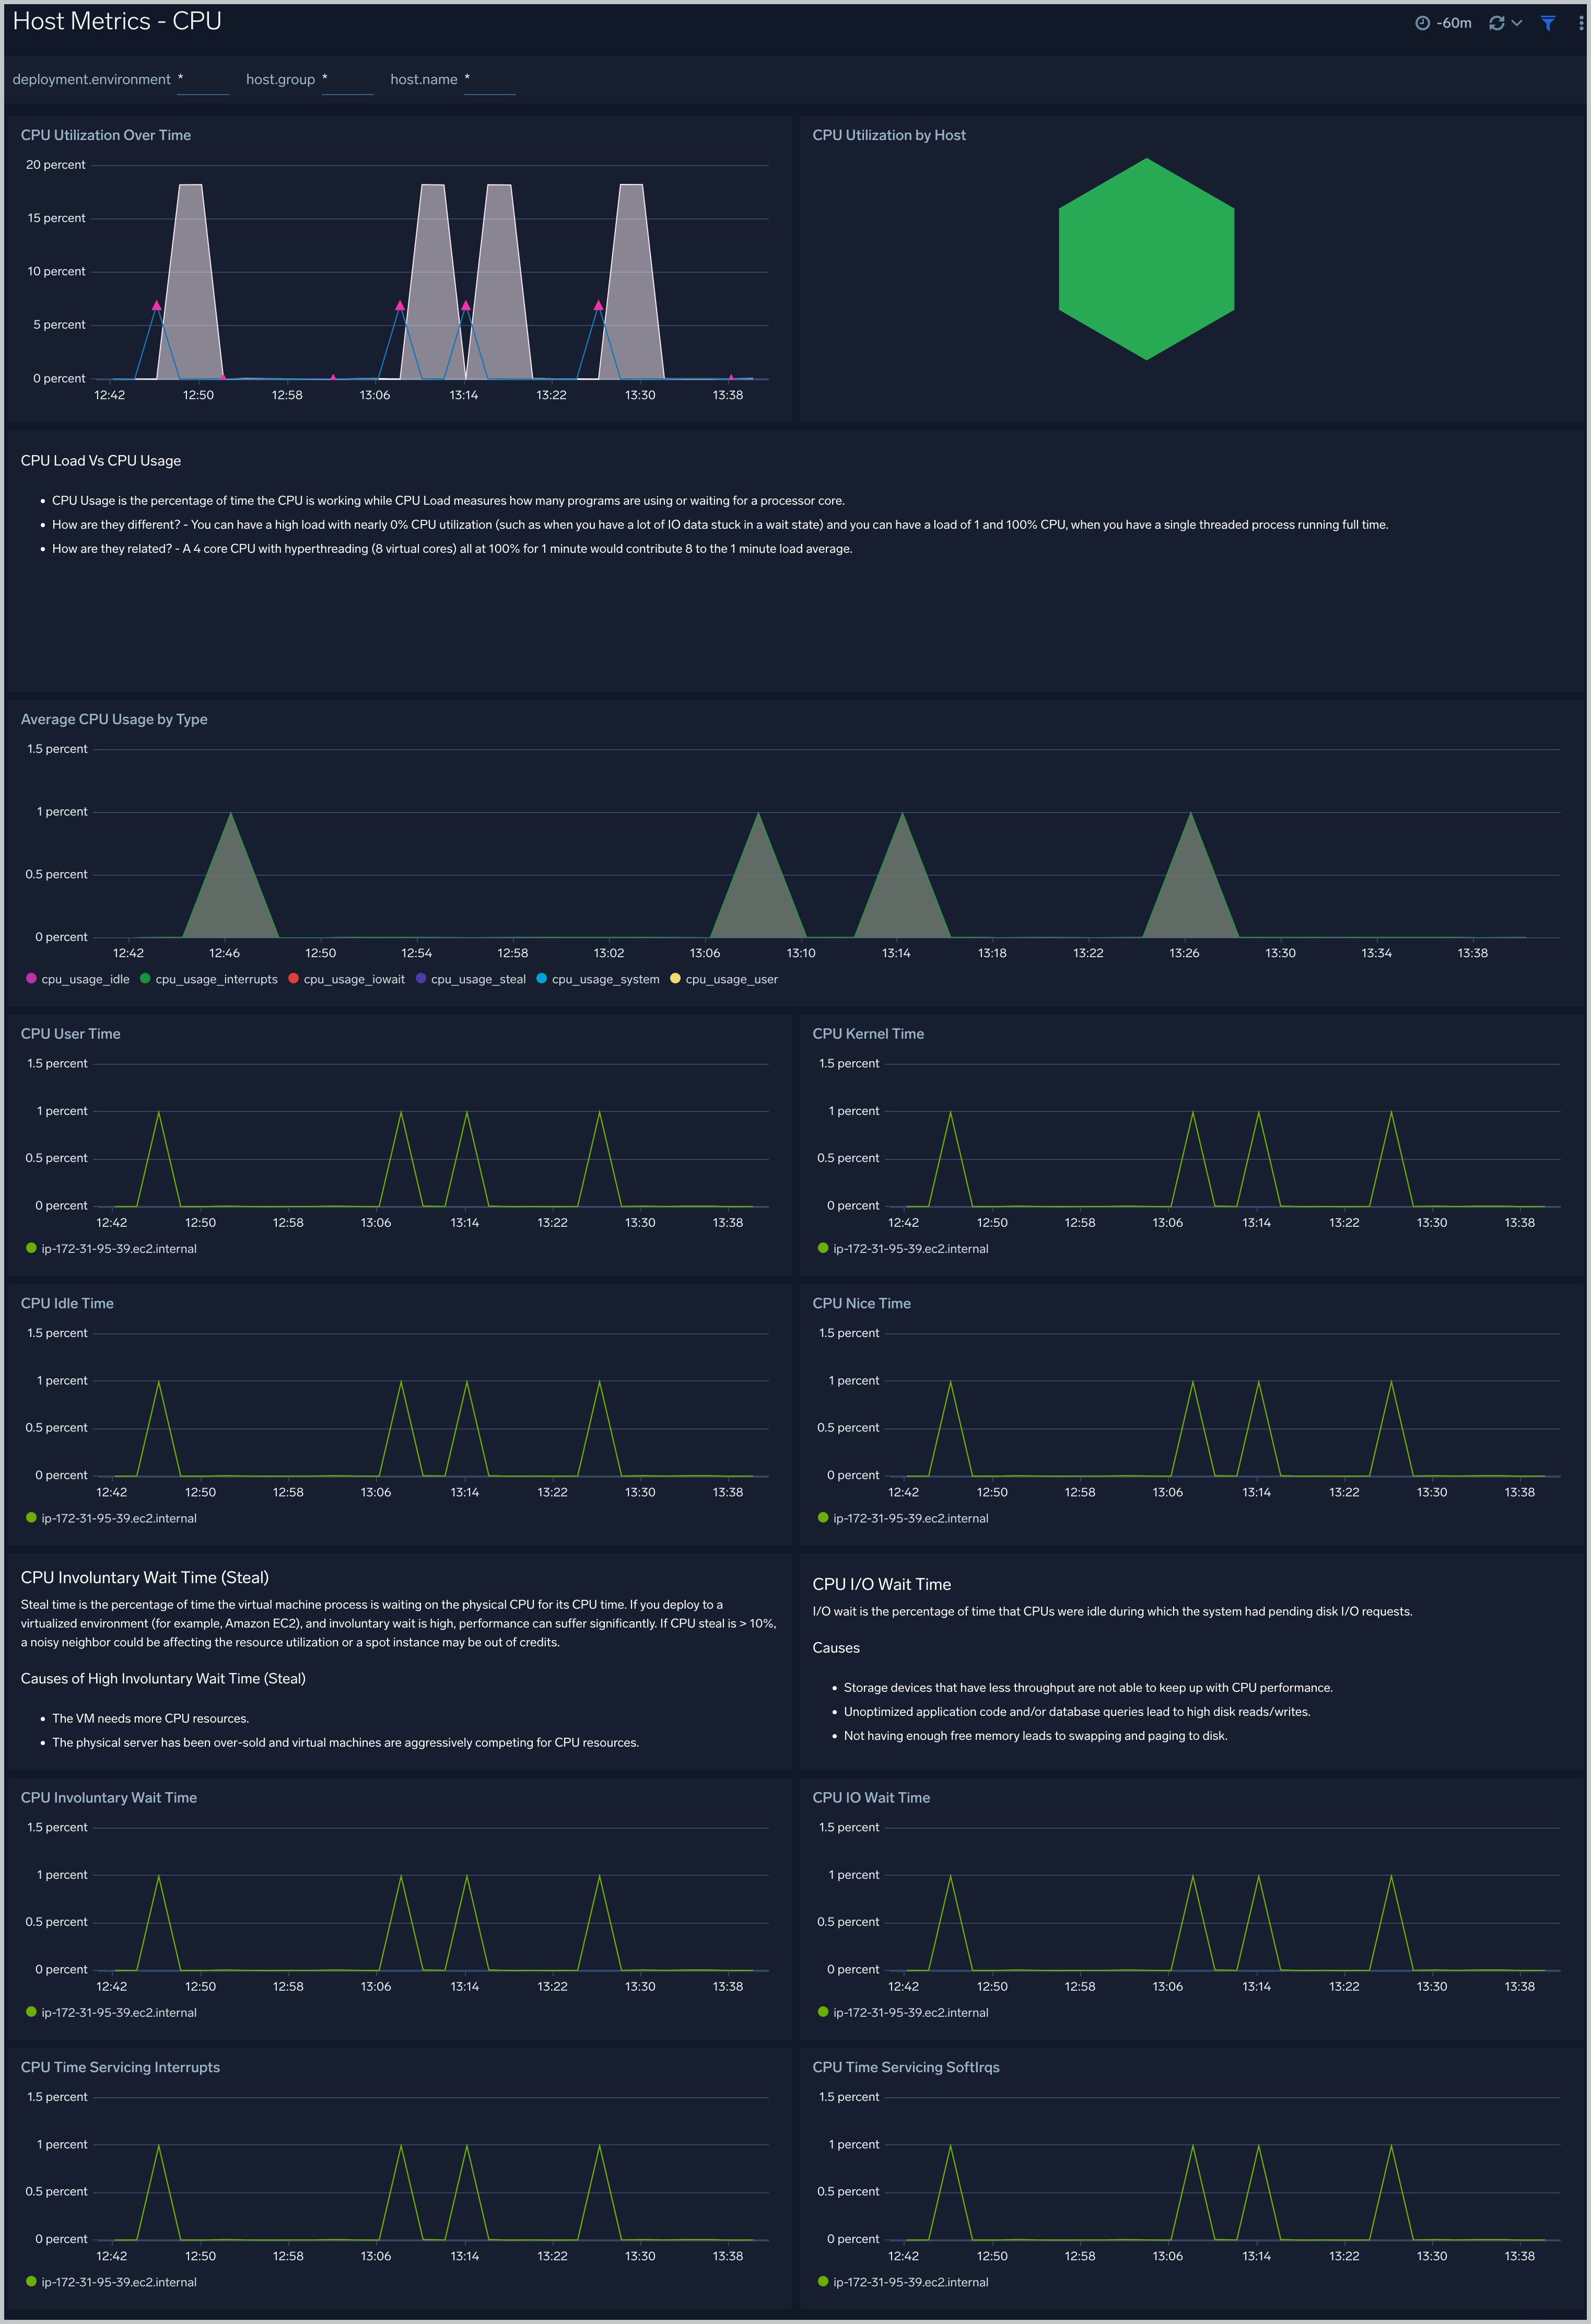
### Host Metrics - CPU
The **Host Metrics - CPU** dashboard provides a detailed analysis based on CPU metrics. You can drill down from this dashboard to the Process Metrics - Details dashboard by using the honeycombs or line charts in all the panels.
Use this dashboard to:
- Identify hosts and processes with high CPU utilization.
- Examine CPU usage by type and identify anomalies over time.
 ### Host Metrics - Disk
The **Host Metrics - Disk** dashboard provides detailed information about on disk utilization and disk IO operations.You can drill down from this dashboard to the Process Metrics - Details dashboard by using the honeycombs or line charts in all the panels.
Use this dashboard to:
- Identify hosts with high disk utilization and disk IO operations.
- Monitor abnormal spikes in read/write rates.
- Compare disk throughput across storage devices of a host.
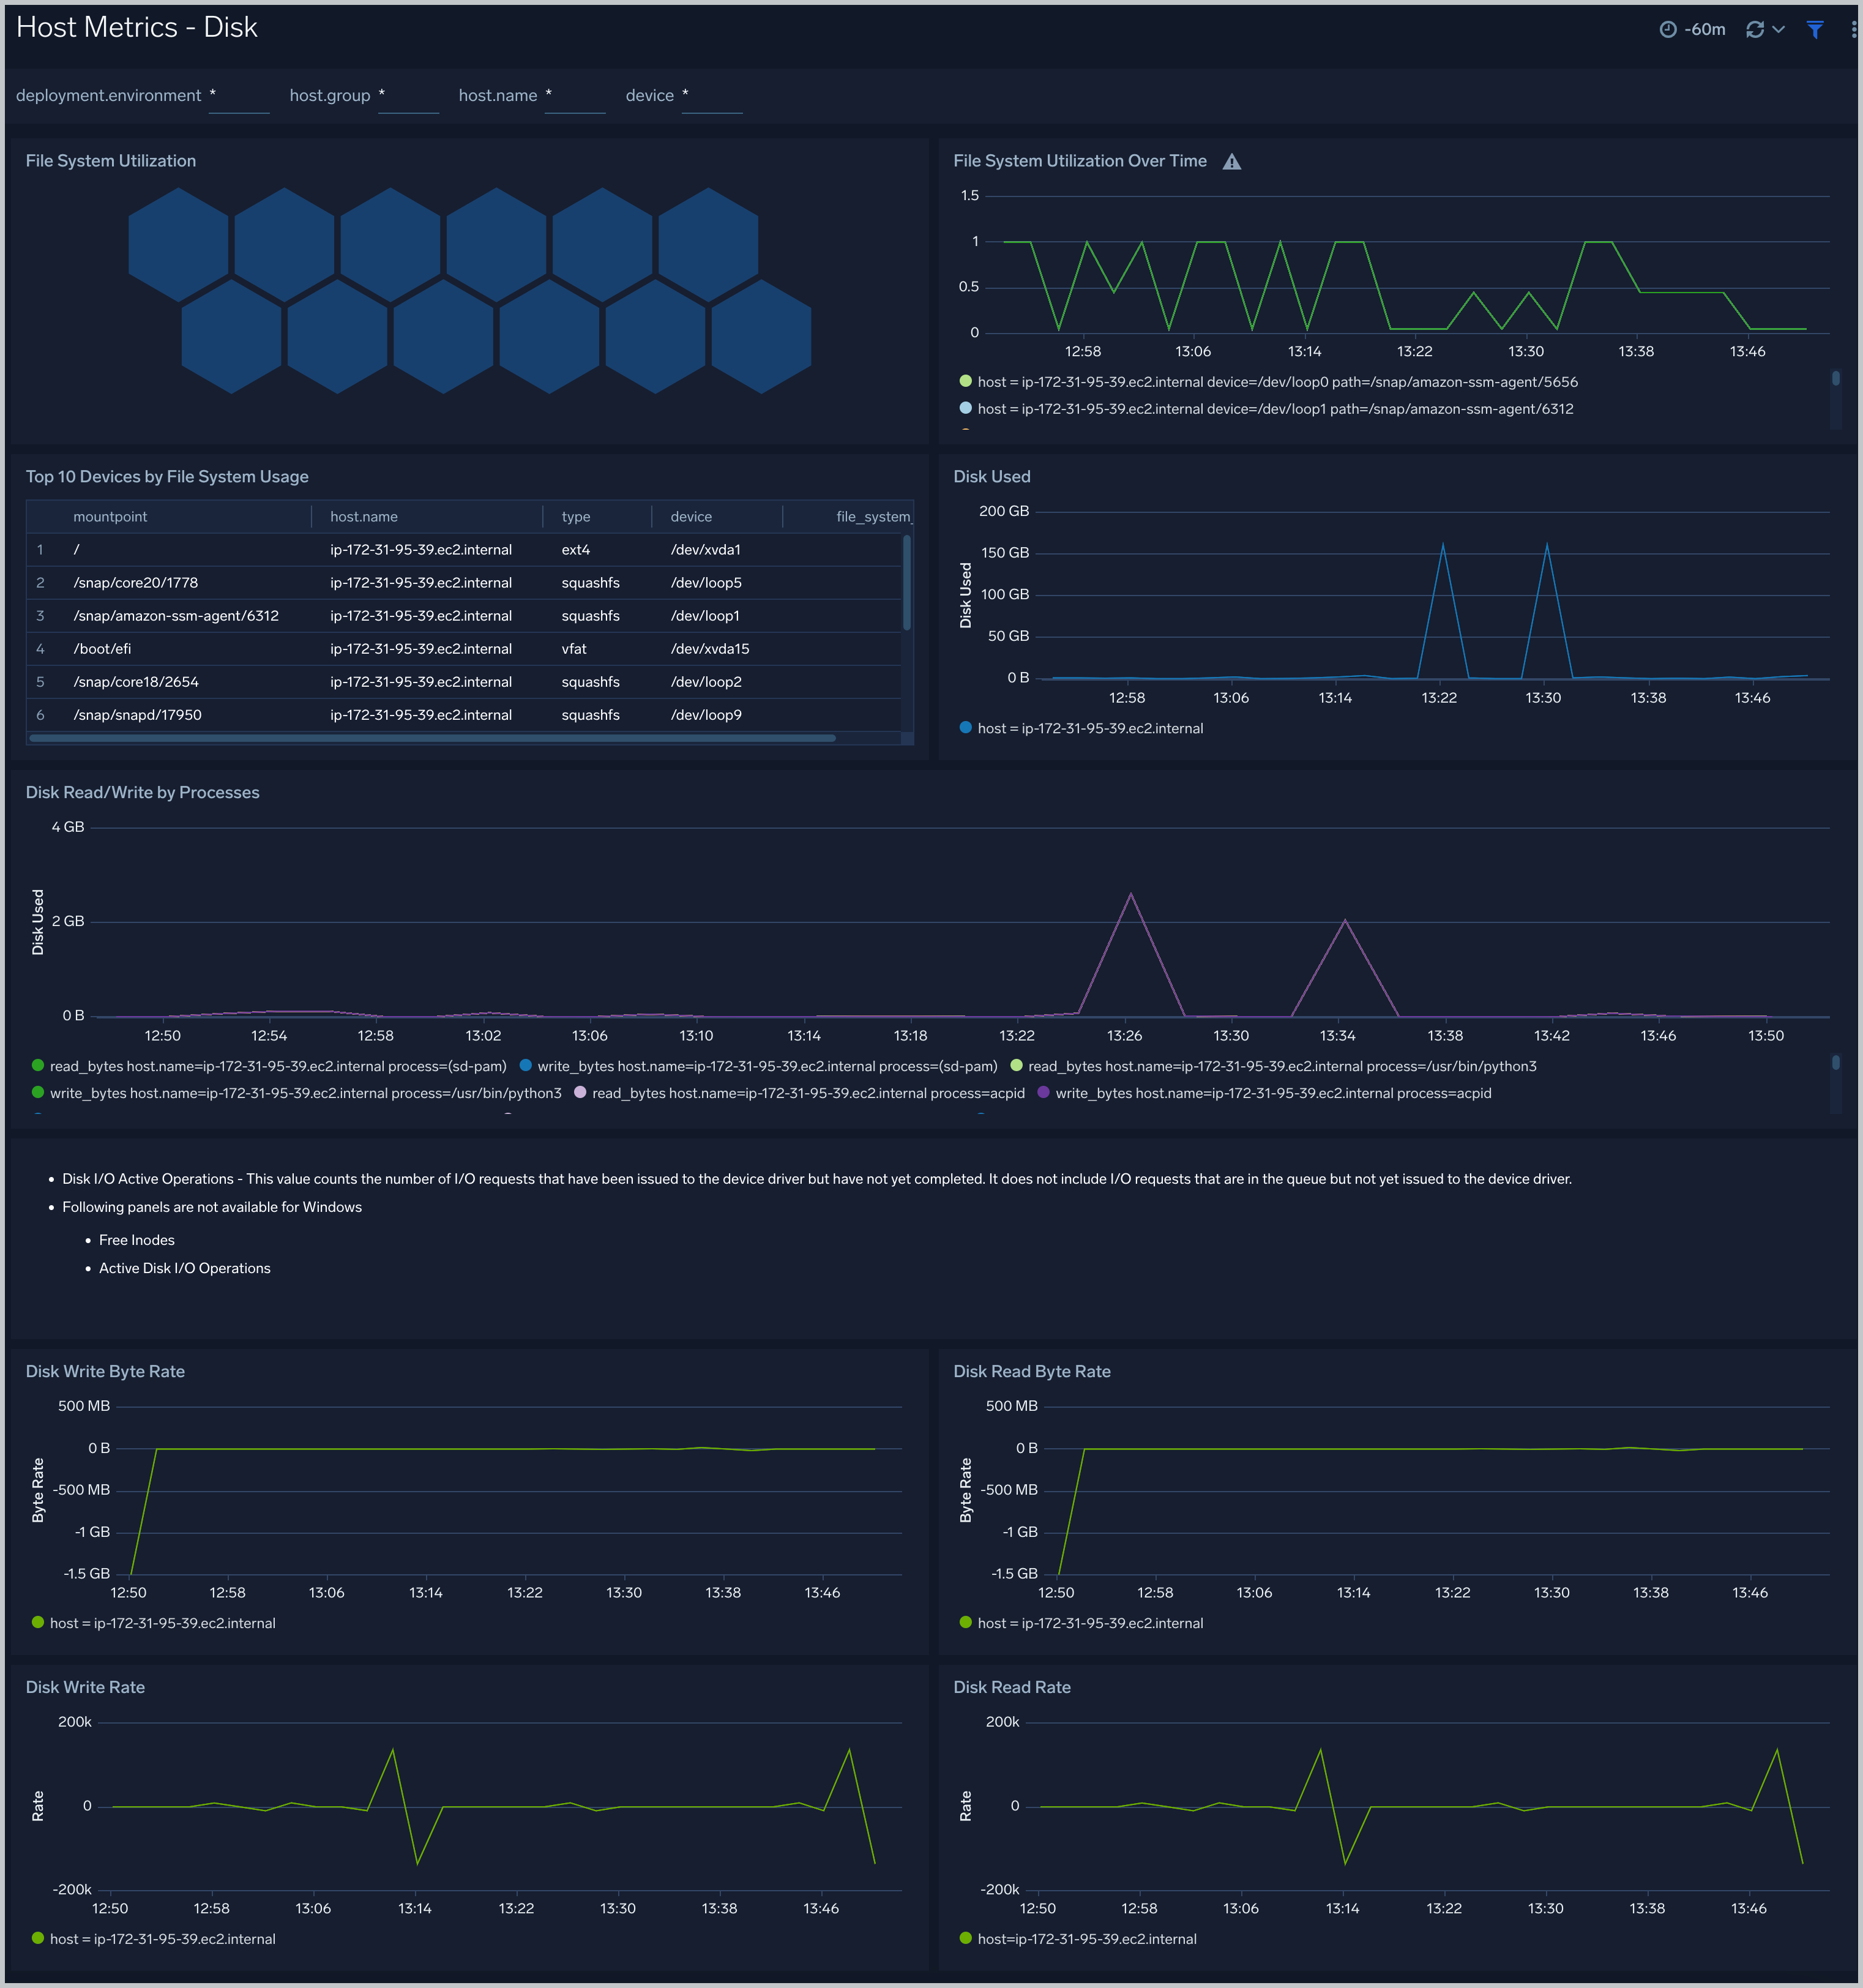
### Host Metrics - Disk
The **Host Metrics - Disk** dashboard provides detailed information about on disk utilization and disk IO operations.You can drill down from this dashboard to the Process Metrics - Details dashboard by using the honeycombs or line charts in all the panels.
Use this dashboard to:
- Identify hosts with high disk utilization and disk IO operations.
- Monitor abnormal spikes in read/write rates.
- Compare disk throughput across storage devices of a host.
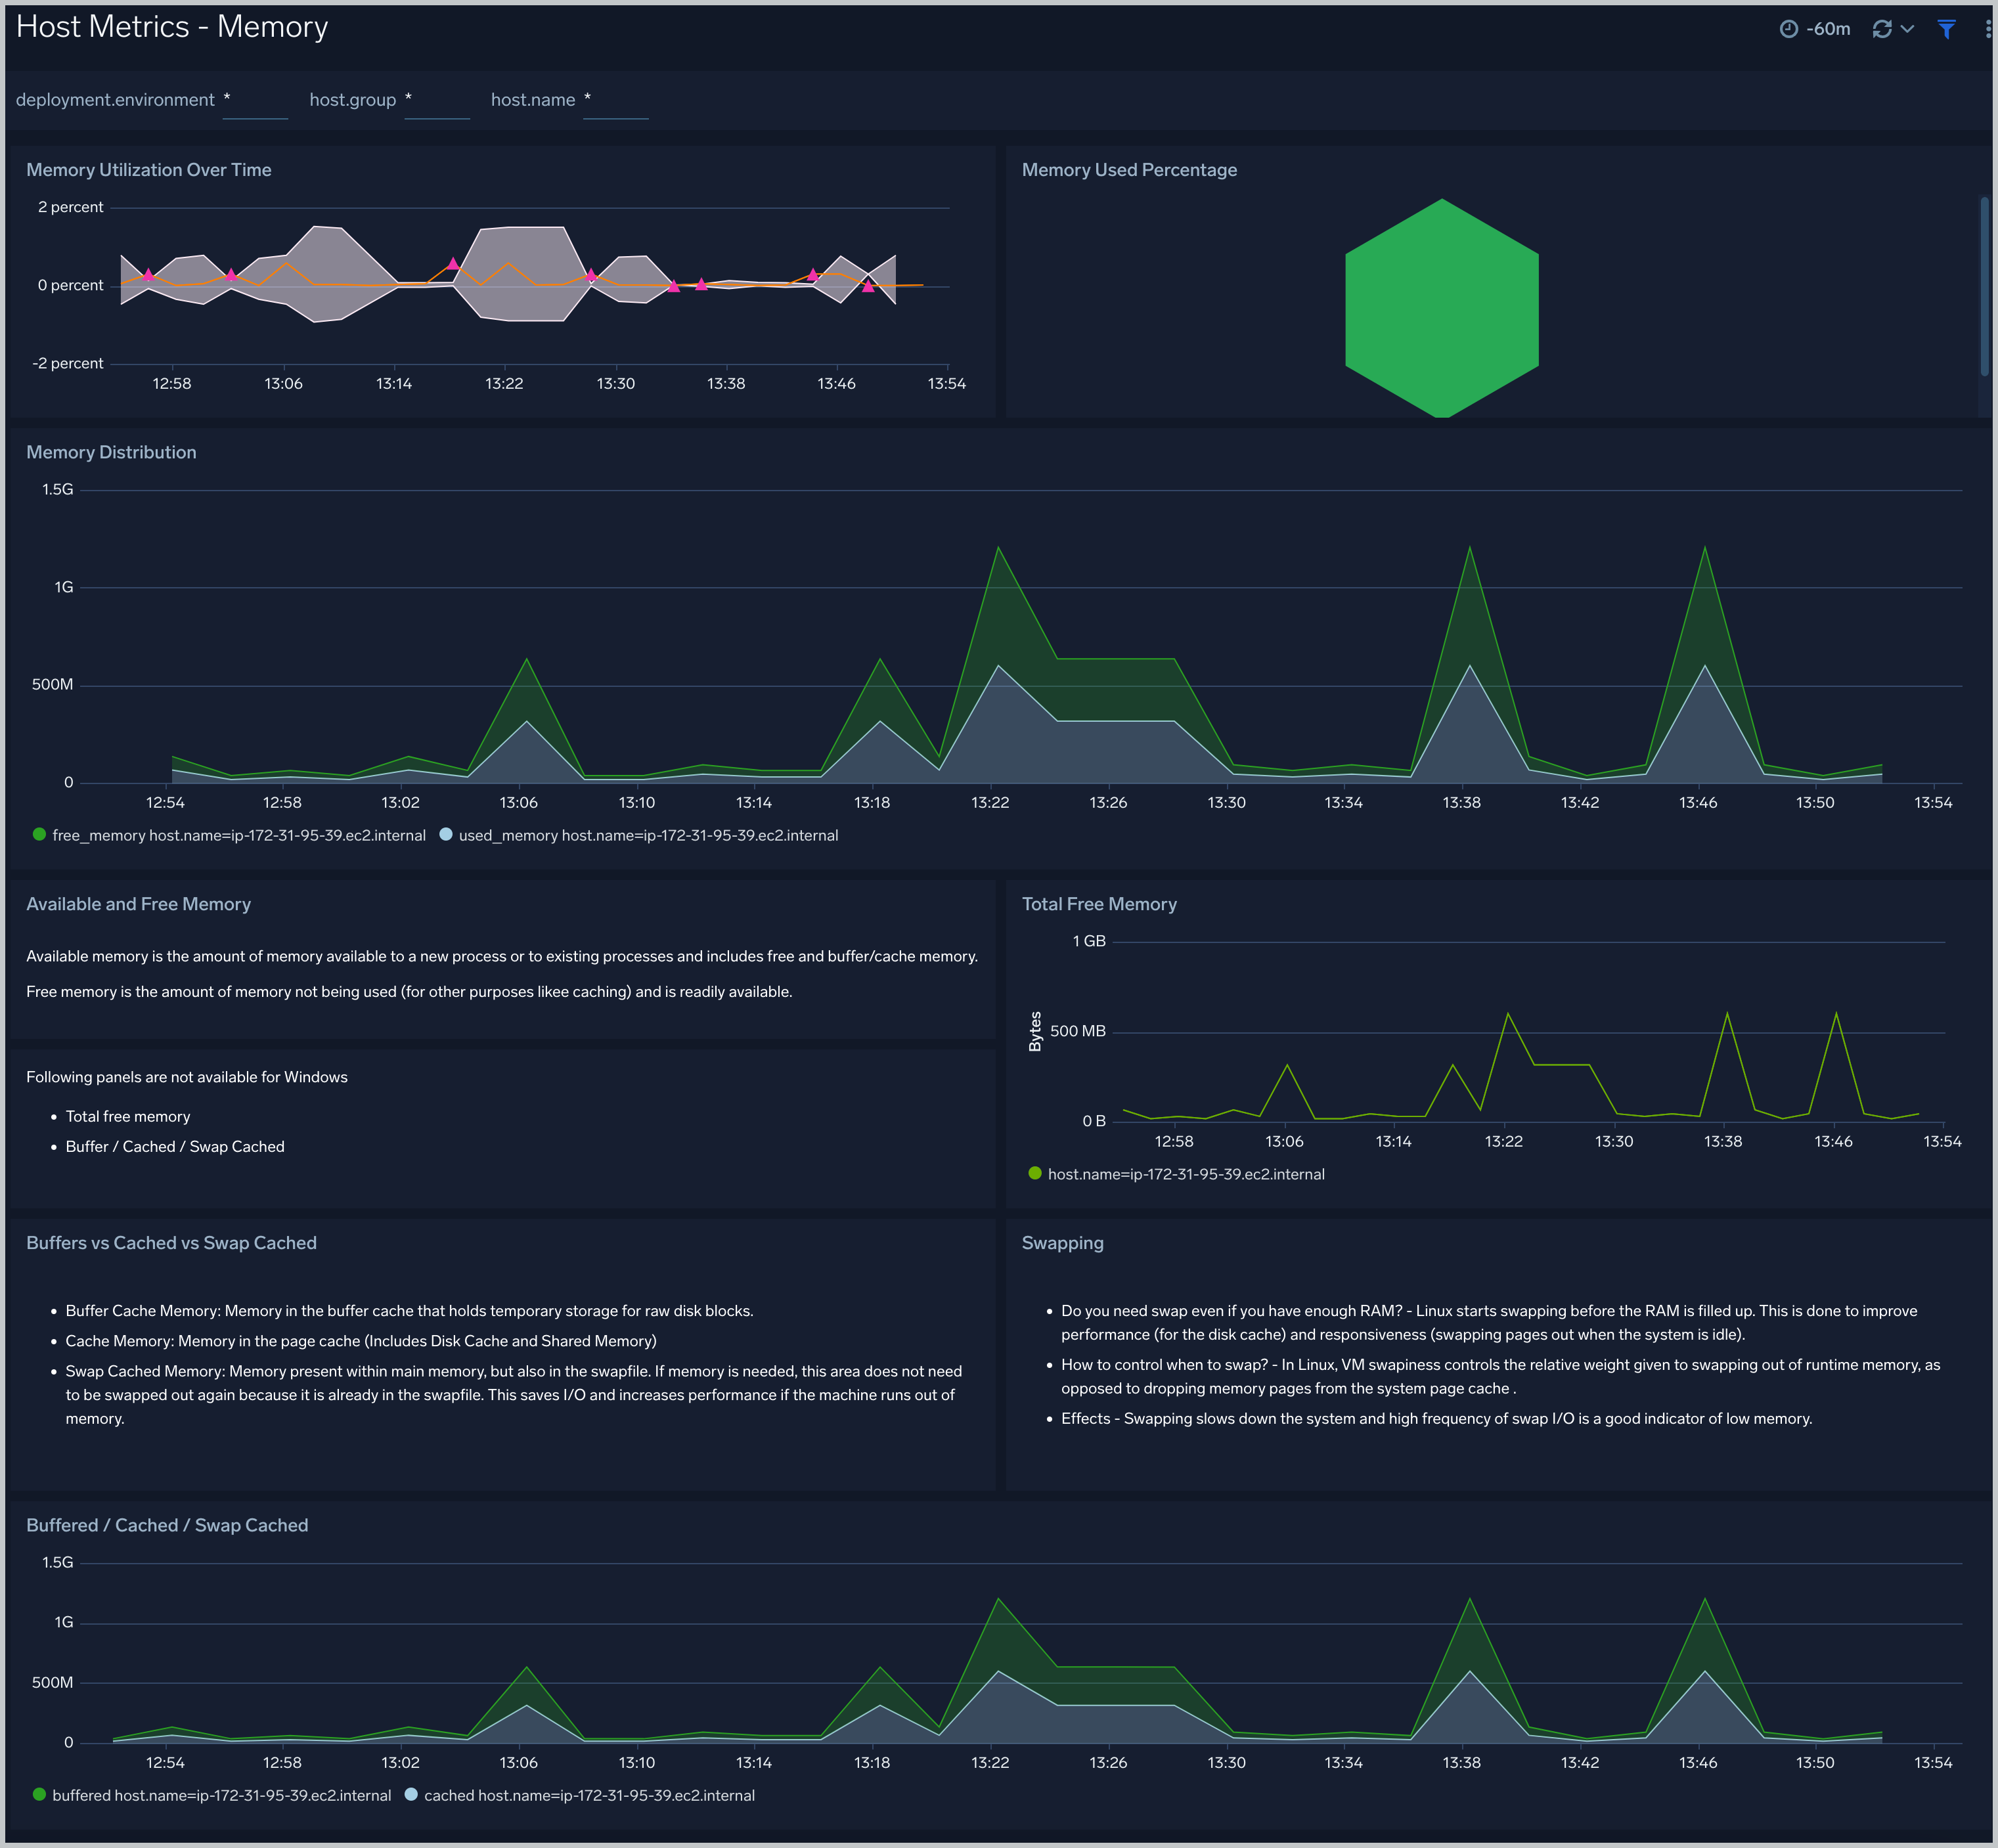
 ### Host Metrics - Memory
The **Host Metrics - Memory** dashboard provides detailed information on host memory usage, memory distribution, and swap space utilization. You can drill down from this dashboard to the Process Metrics - Details dashboard by using the honeycombs or line charts in all the panels.
Use this dashboard to:
- Identify hosts with high memory utilization.
- Examine memory distribution (free, buffered-cache, used, total) for a given host.
- Monitor abnormal spikes in memory and swap utilization.
### Host Metrics - Memory
The **Host Metrics - Memory** dashboard provides detailed information on host memory usage, memory distribution, and swap space utilization. You can drill down from this dashboard to the Process Metrics - Details dashboard by using the honeycombs or line charts in all the panels.
Use this dashboard to:
- Identify hosts with high memory utilization.
- Examine memory distribution (free, buffered-cache, used, total) for a given host.
- Monitor abnormal spikes in memory and swap utilization.
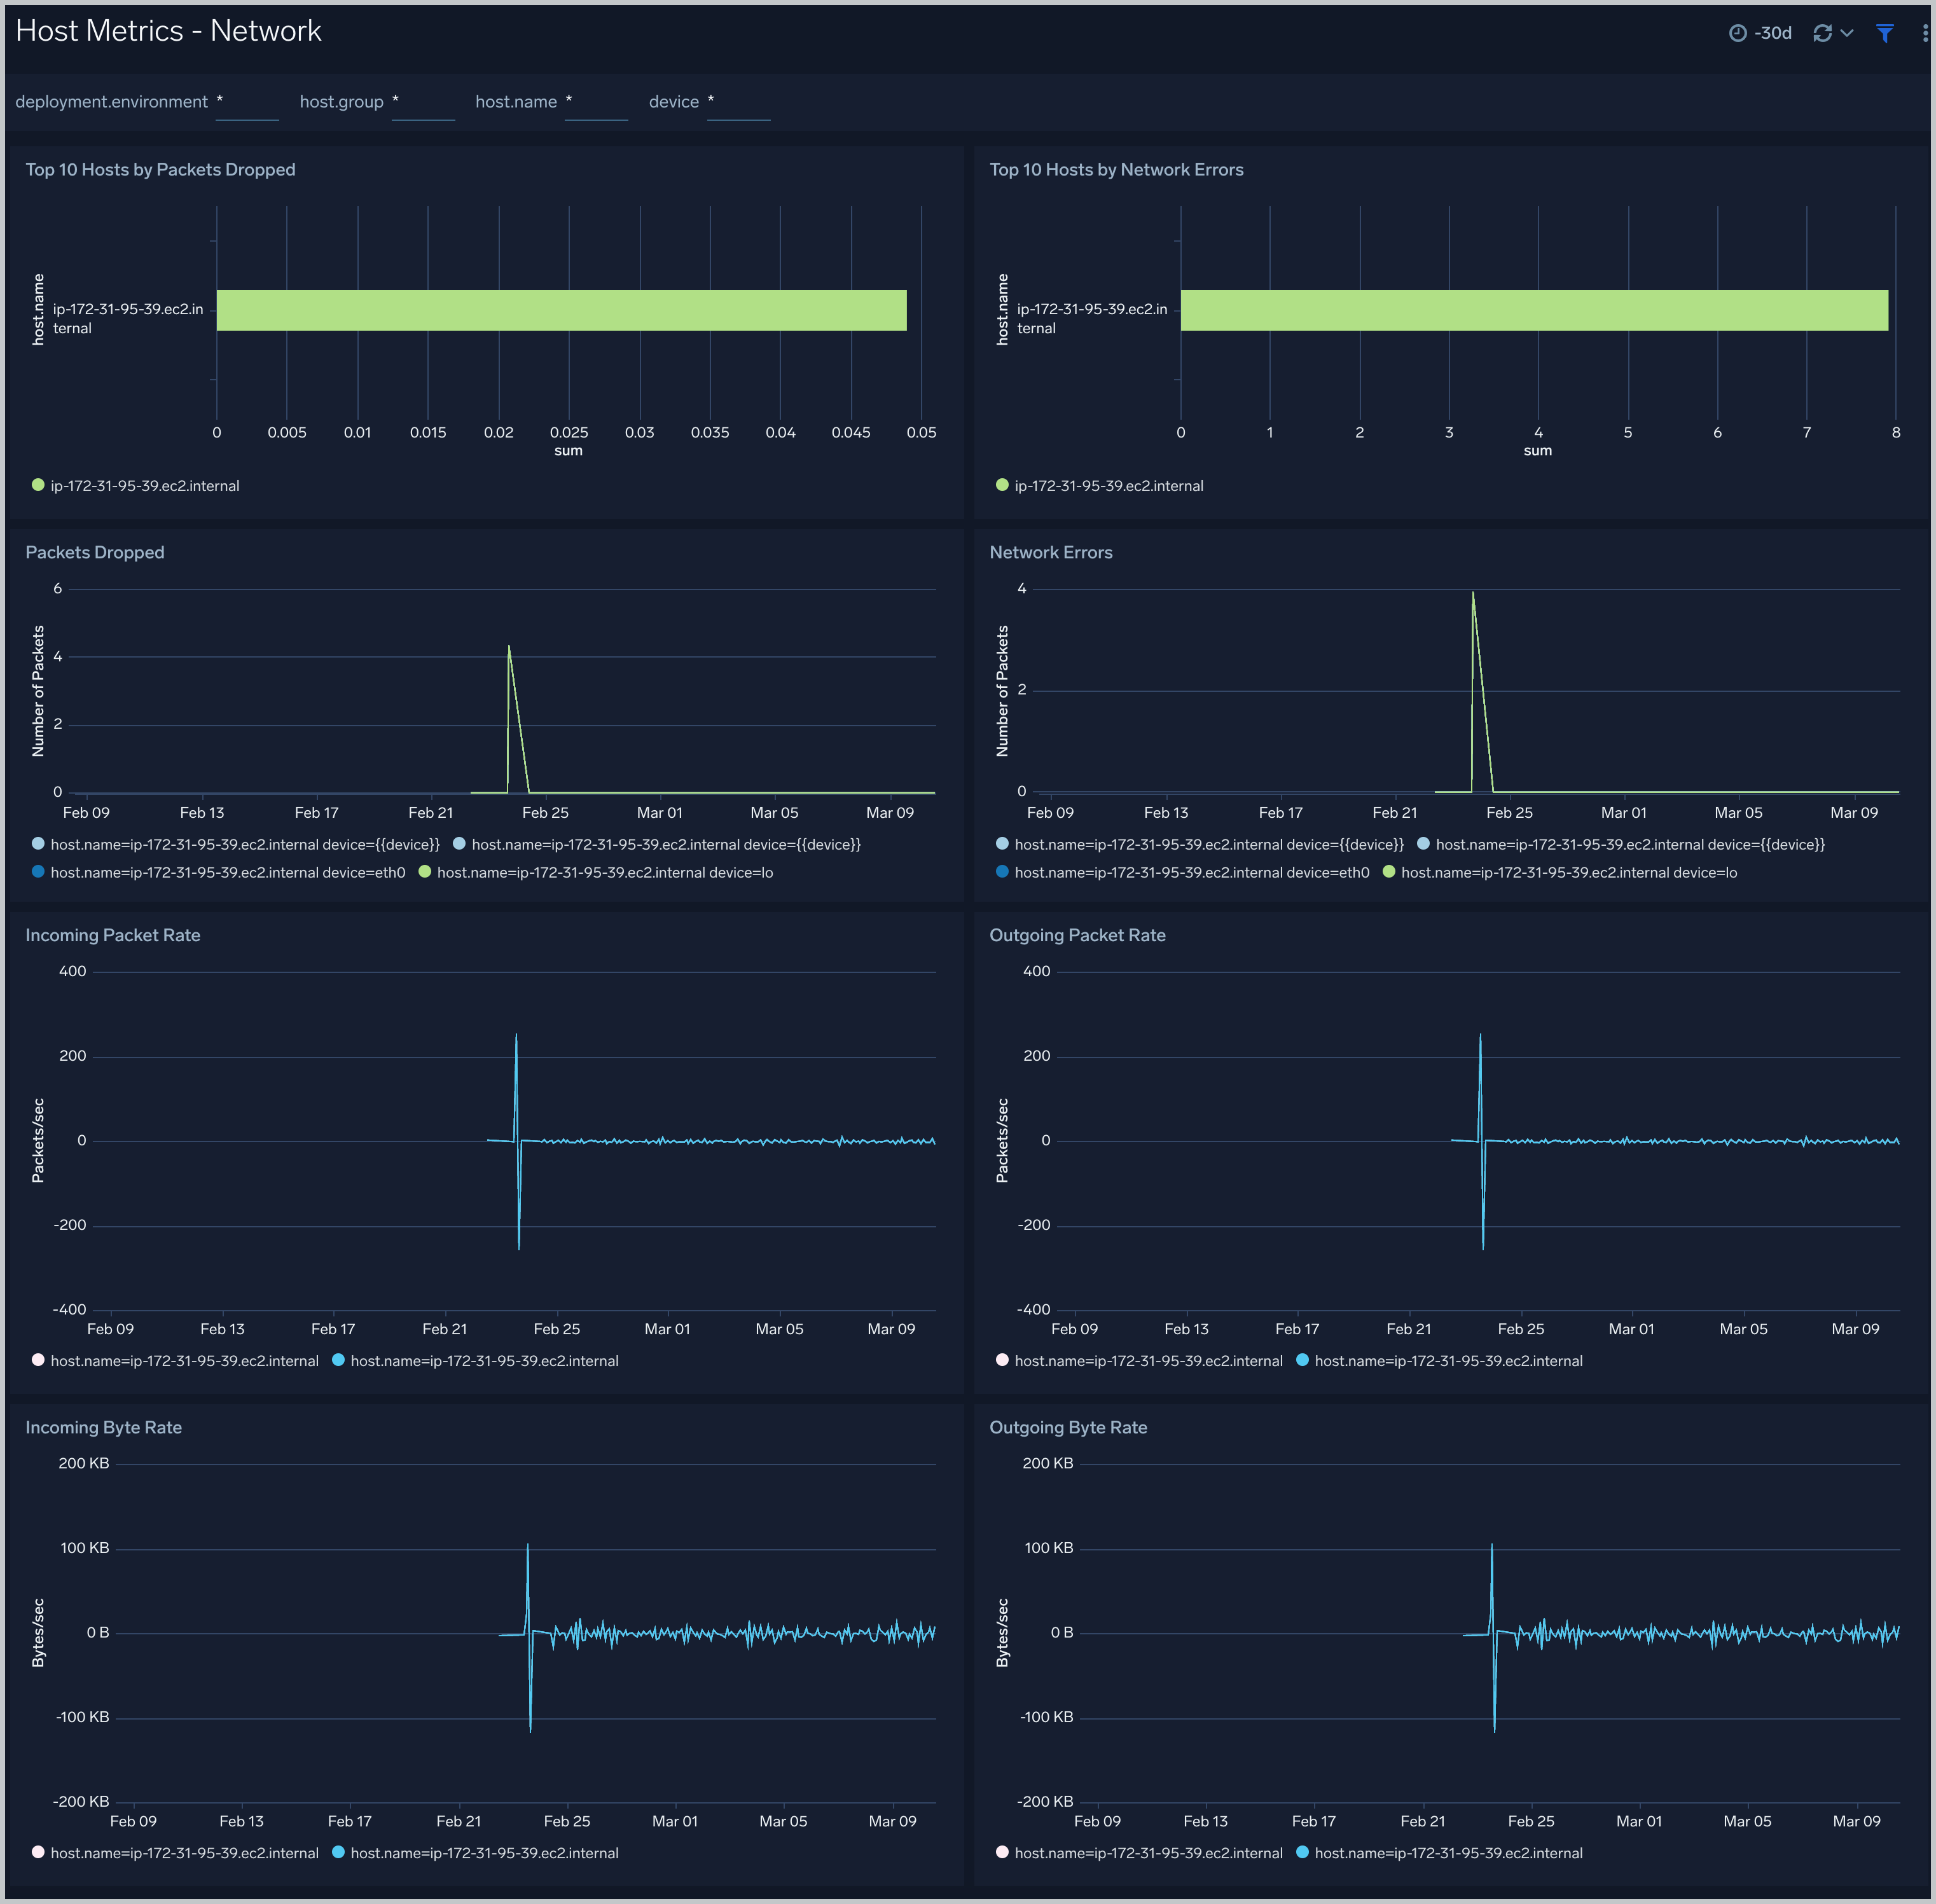
 ### Host Metrics - Network
The **Host Metrics - Network** dashboard provides detailed information on host network errors, throughput, and packets sent and received.
Use this dashboard to:
- Determine top hosts with network errors and dropped packets.
- Monitor abnormal spikes in incoming/outgoing packets and bytes sent and received.
- Use dashboard filters to compare throughput across the interface of a host.
### Host Metrics - Network
The **Host Metrics - Network** dashboard provides detailed information on host network errors, throughput, and packets sent and received.
Use this dashboard to:
- Determine top hosts with network errors and dropped packets.
- Monitor abnormal spikes in incoming/outgoing packets and bytes sent and received.
- Use dashboard filters to compare throughput across the interface of a host.
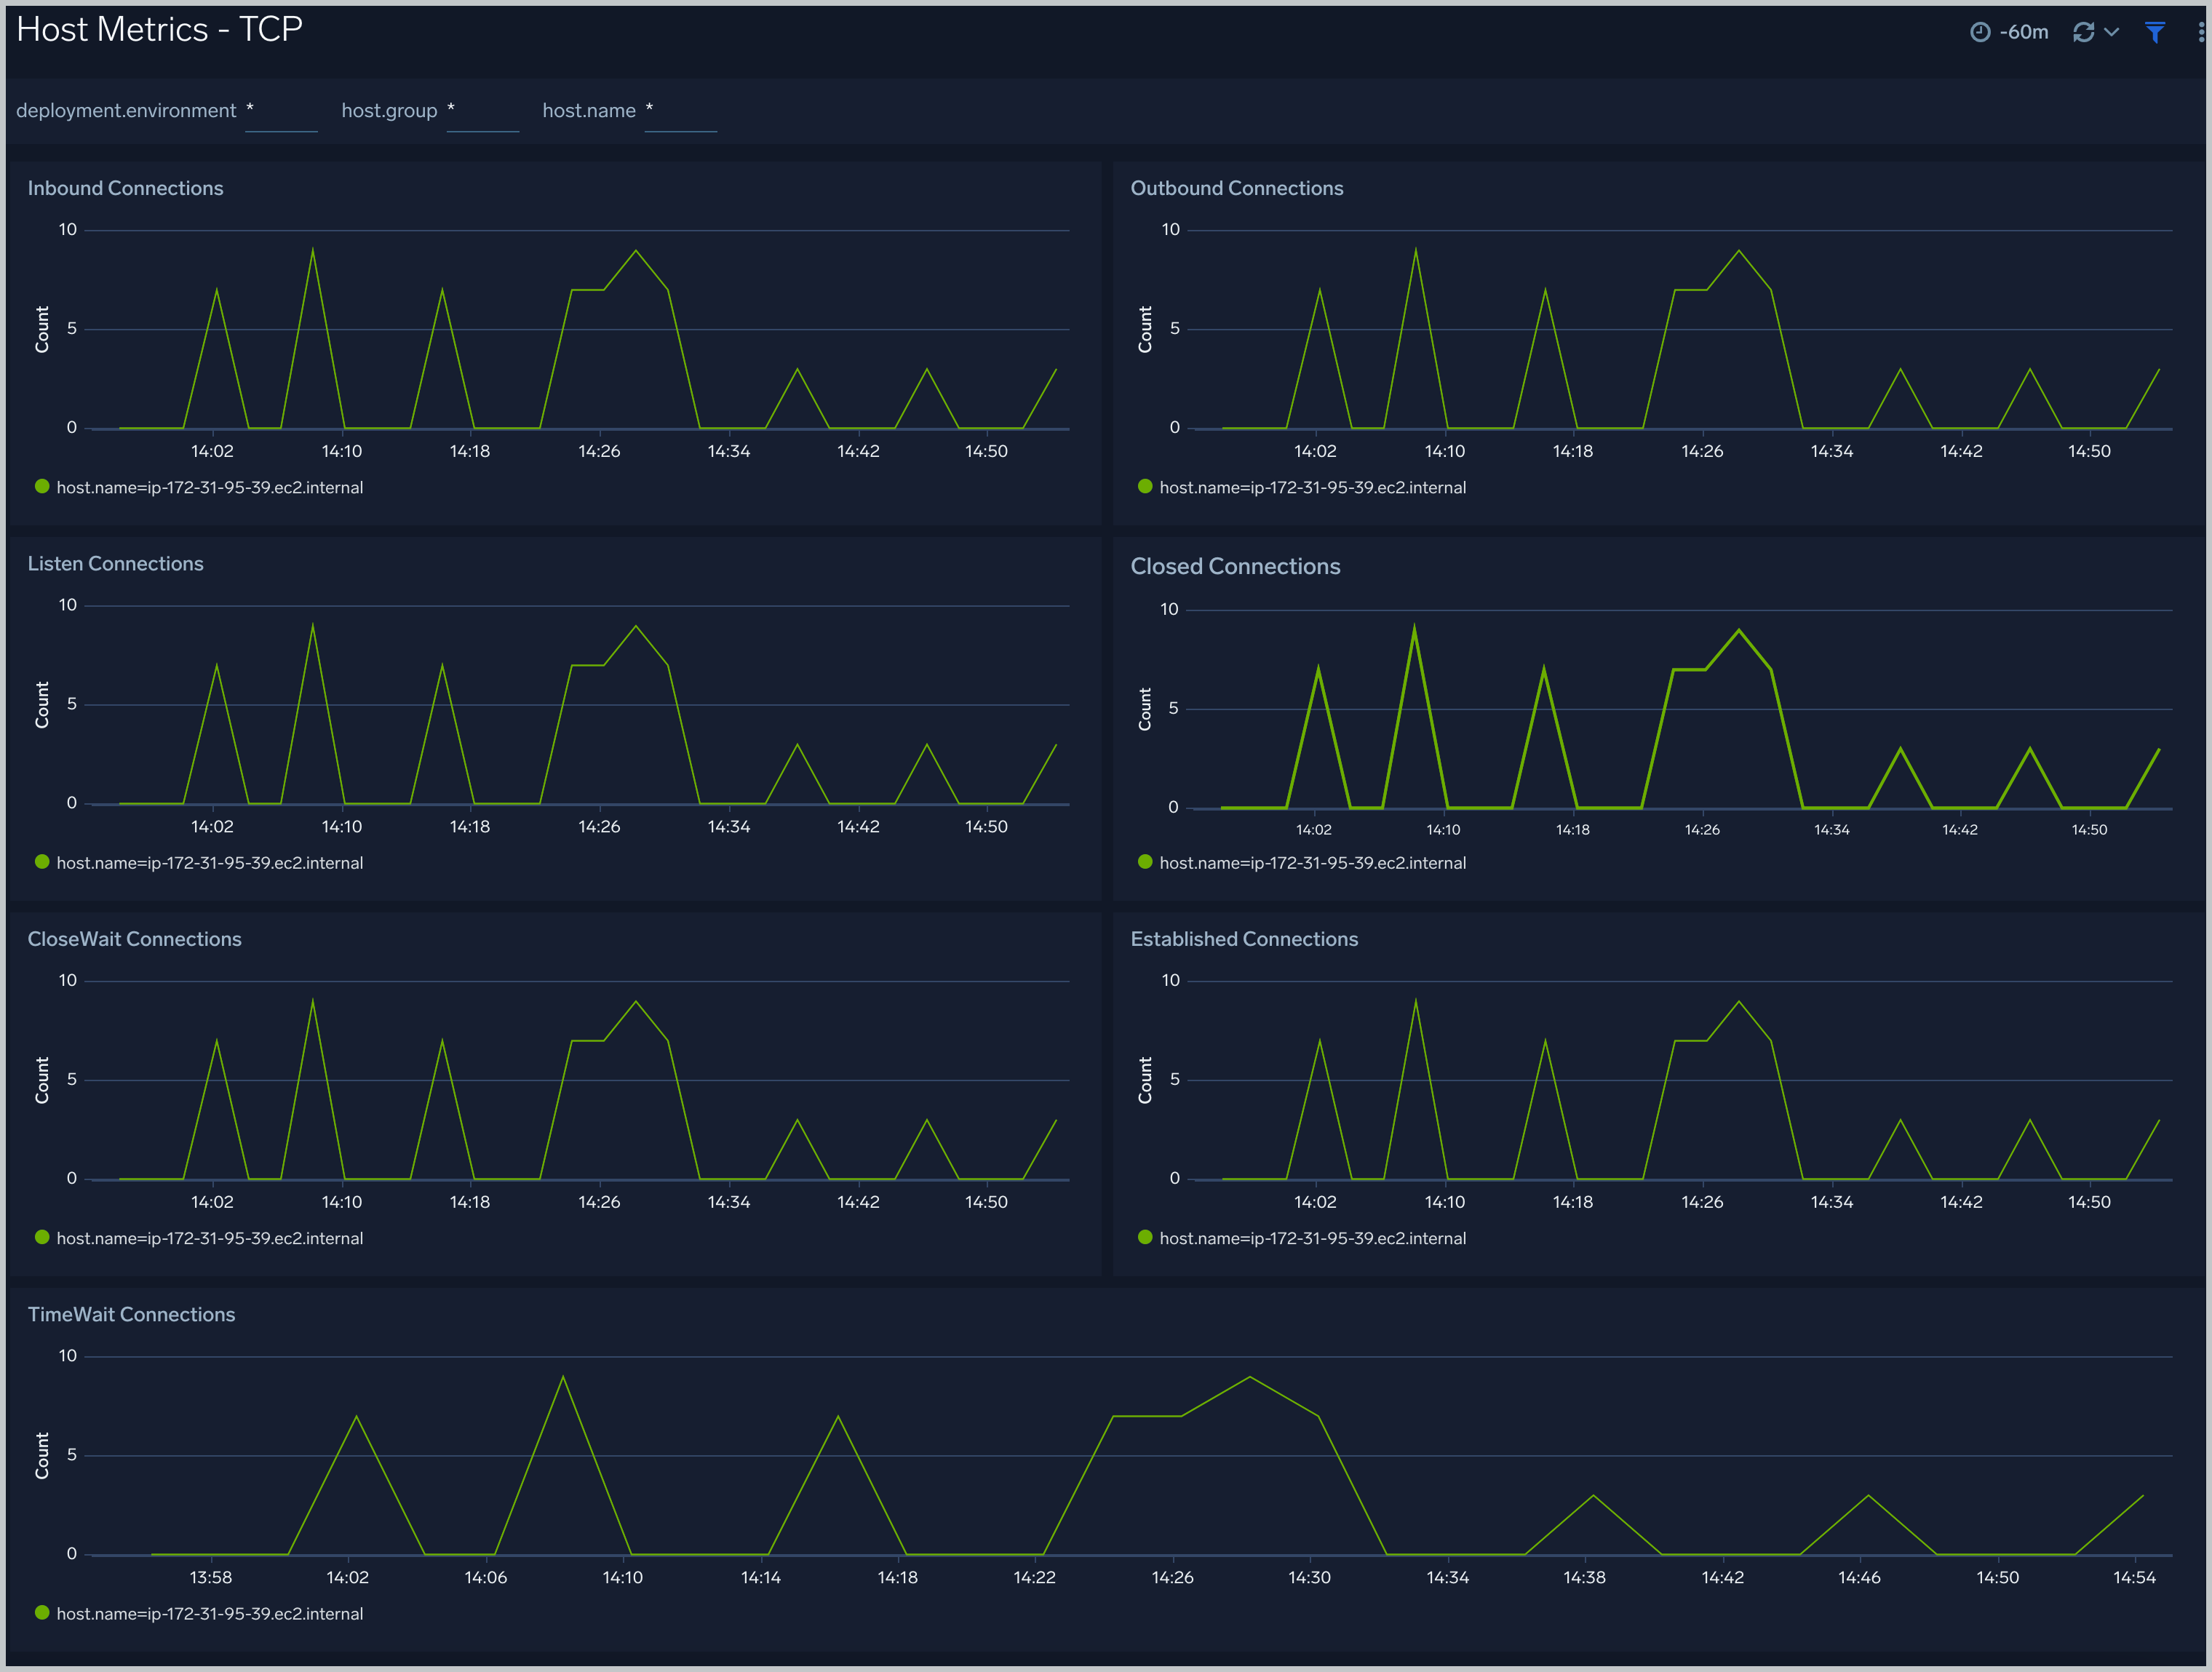
 ### Host Metrics - TCP
The **Host Metrics - TCP** dashboard provides detailed information around inbound, outbound, open, and established TCP connections. Use this dashboard to identify abnormal spikes in inbound, outbound, open, or established connections.
### Host Metrics - TCP
The **Host Metrics - TCP** dashboard provides detailed information around inbound, outbound, open, and established TCP connections. Use this dashboard to identify abnormal spikes in inbound, outbound, open, or established connections.
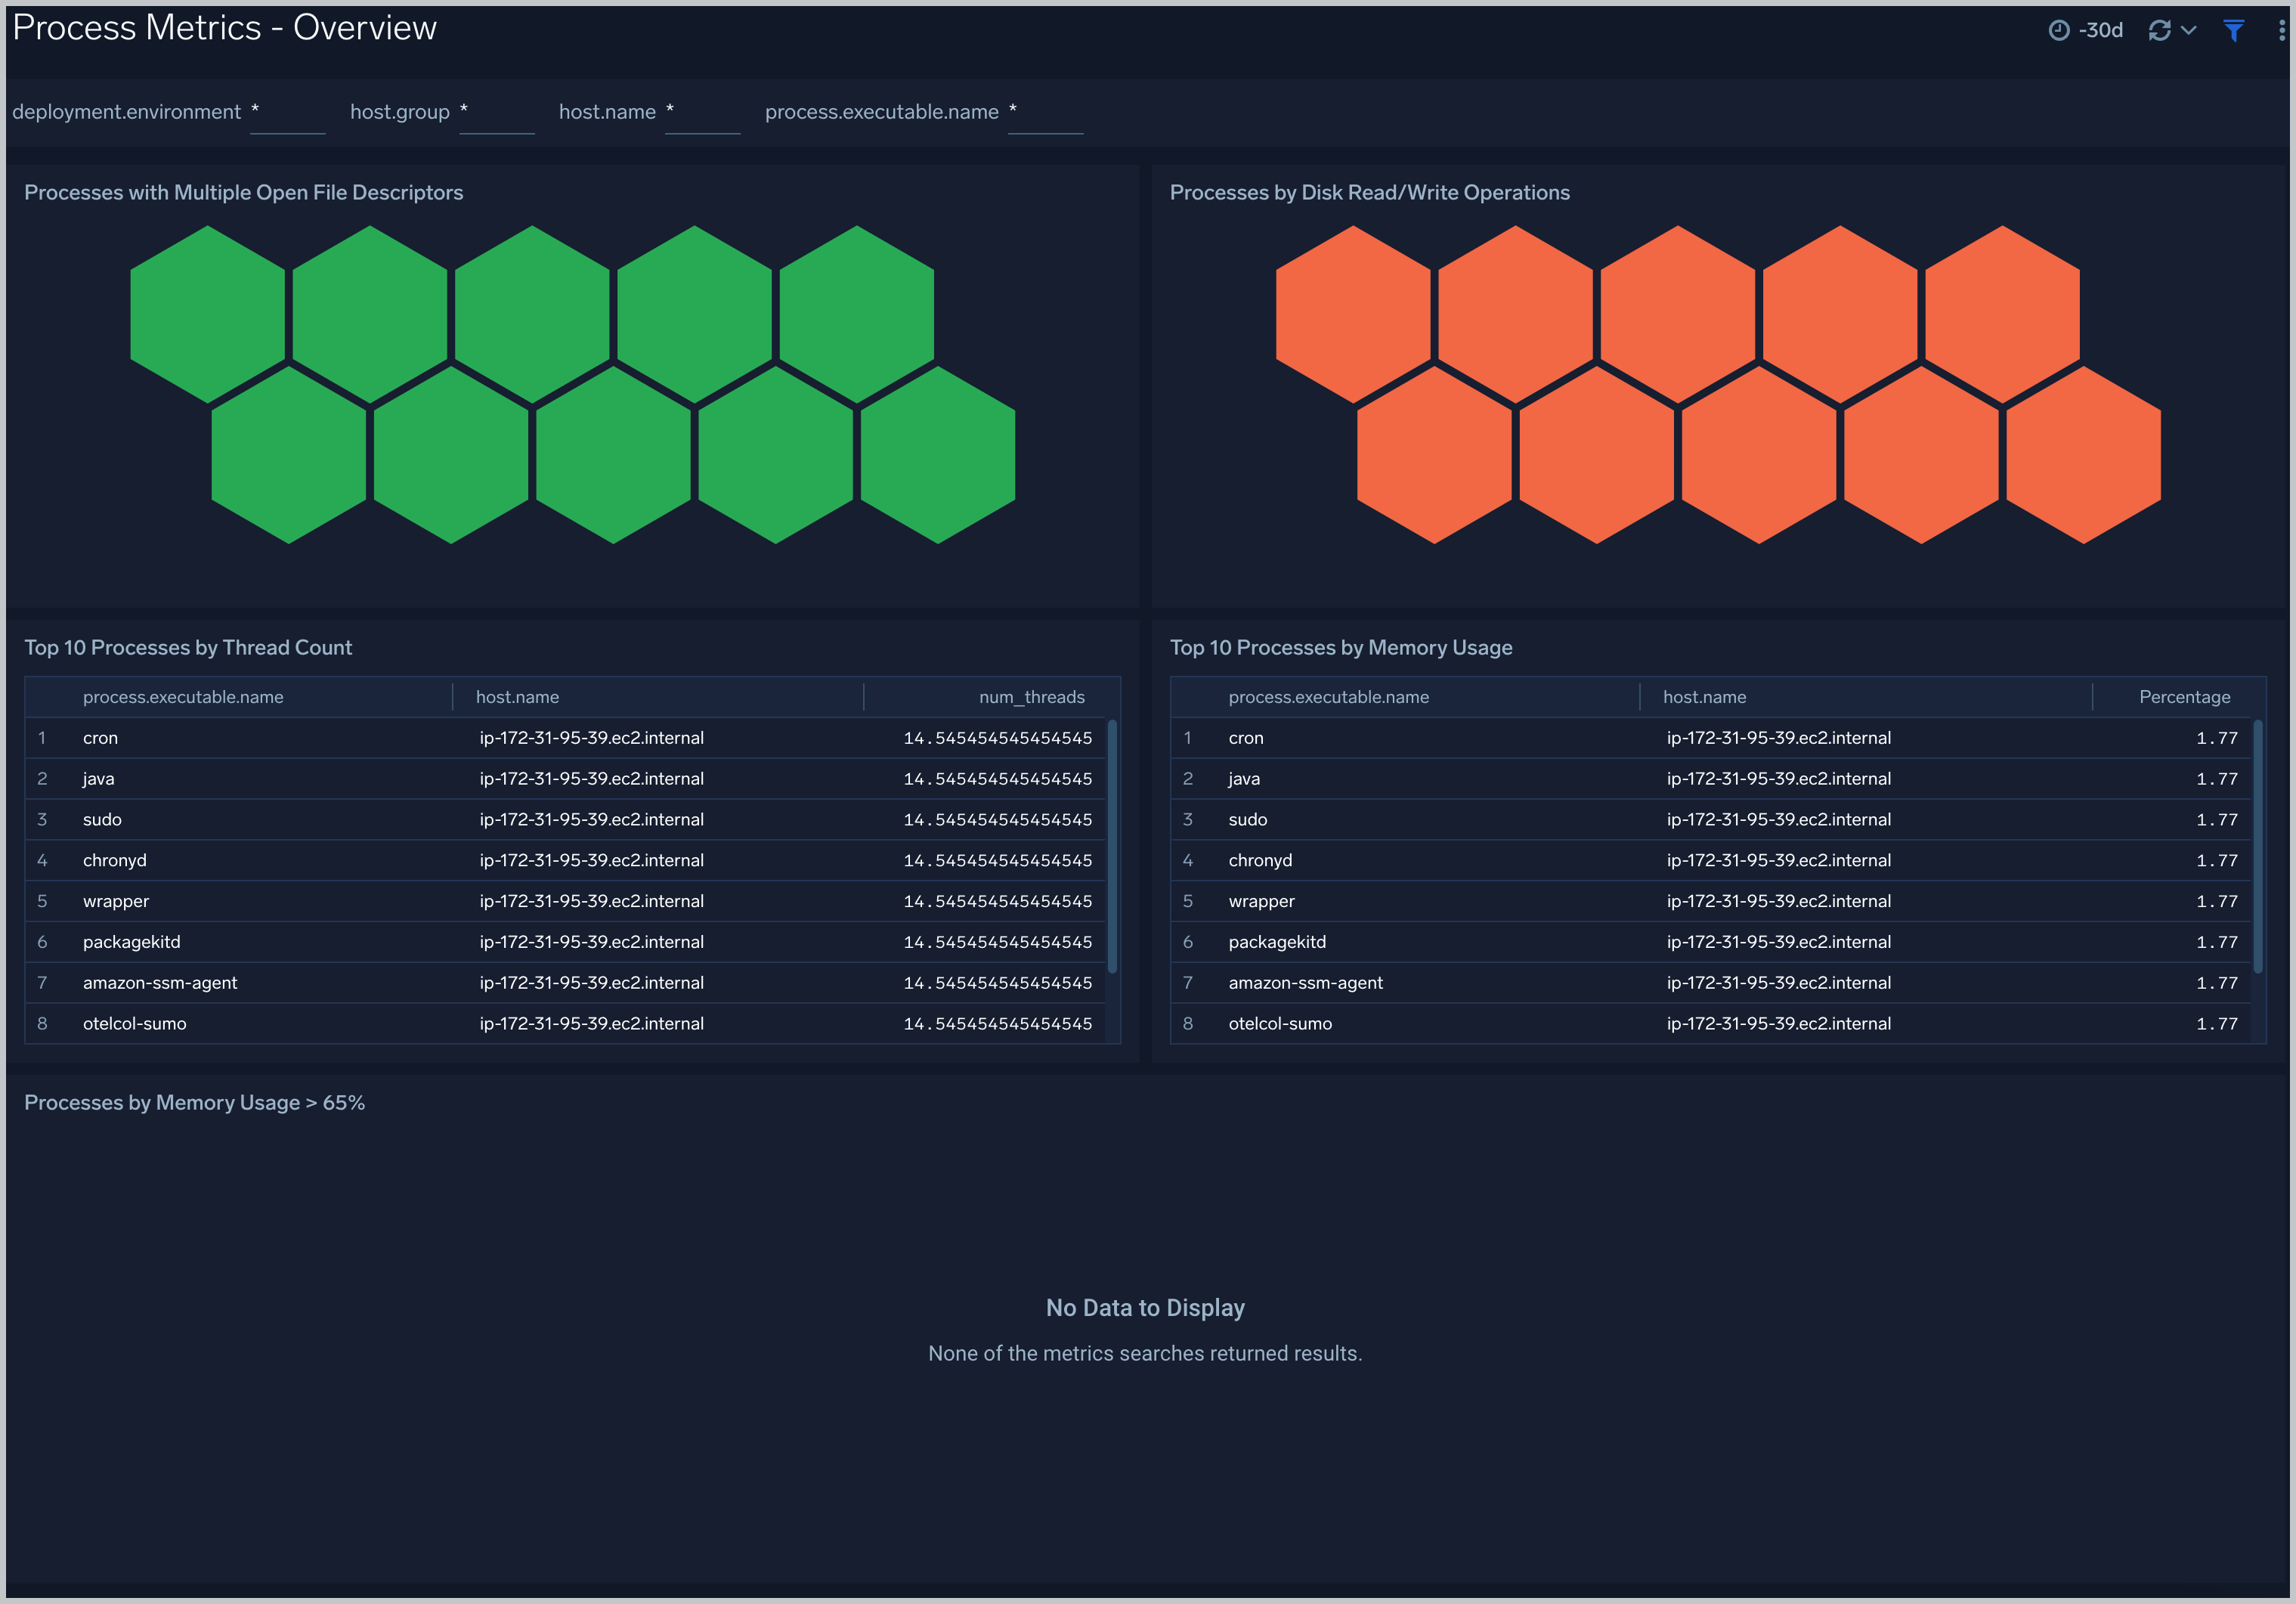
 ### Process Metrics - Overview
The **Process Metrics - Overview** dashboard gives you an at-a-glance view of all the processes by open file descriptors, CPU usage, memory usage, disk read/write operations and thread count.
User this dashboard to:
- Process wise distribution of CPU and memory usage.
- Process wise read/write operations.
### Process Metrics - Overview
The **Process Metrics - Overview** dashboard gives you an at-a-glance view of all the processes by open file descriptors, CPU usage, memory usage, disk read/write operations and thread count.
User this dashboard to:
- Process wise distribution of CPU and memory usage.
- Process wise read/write operations.
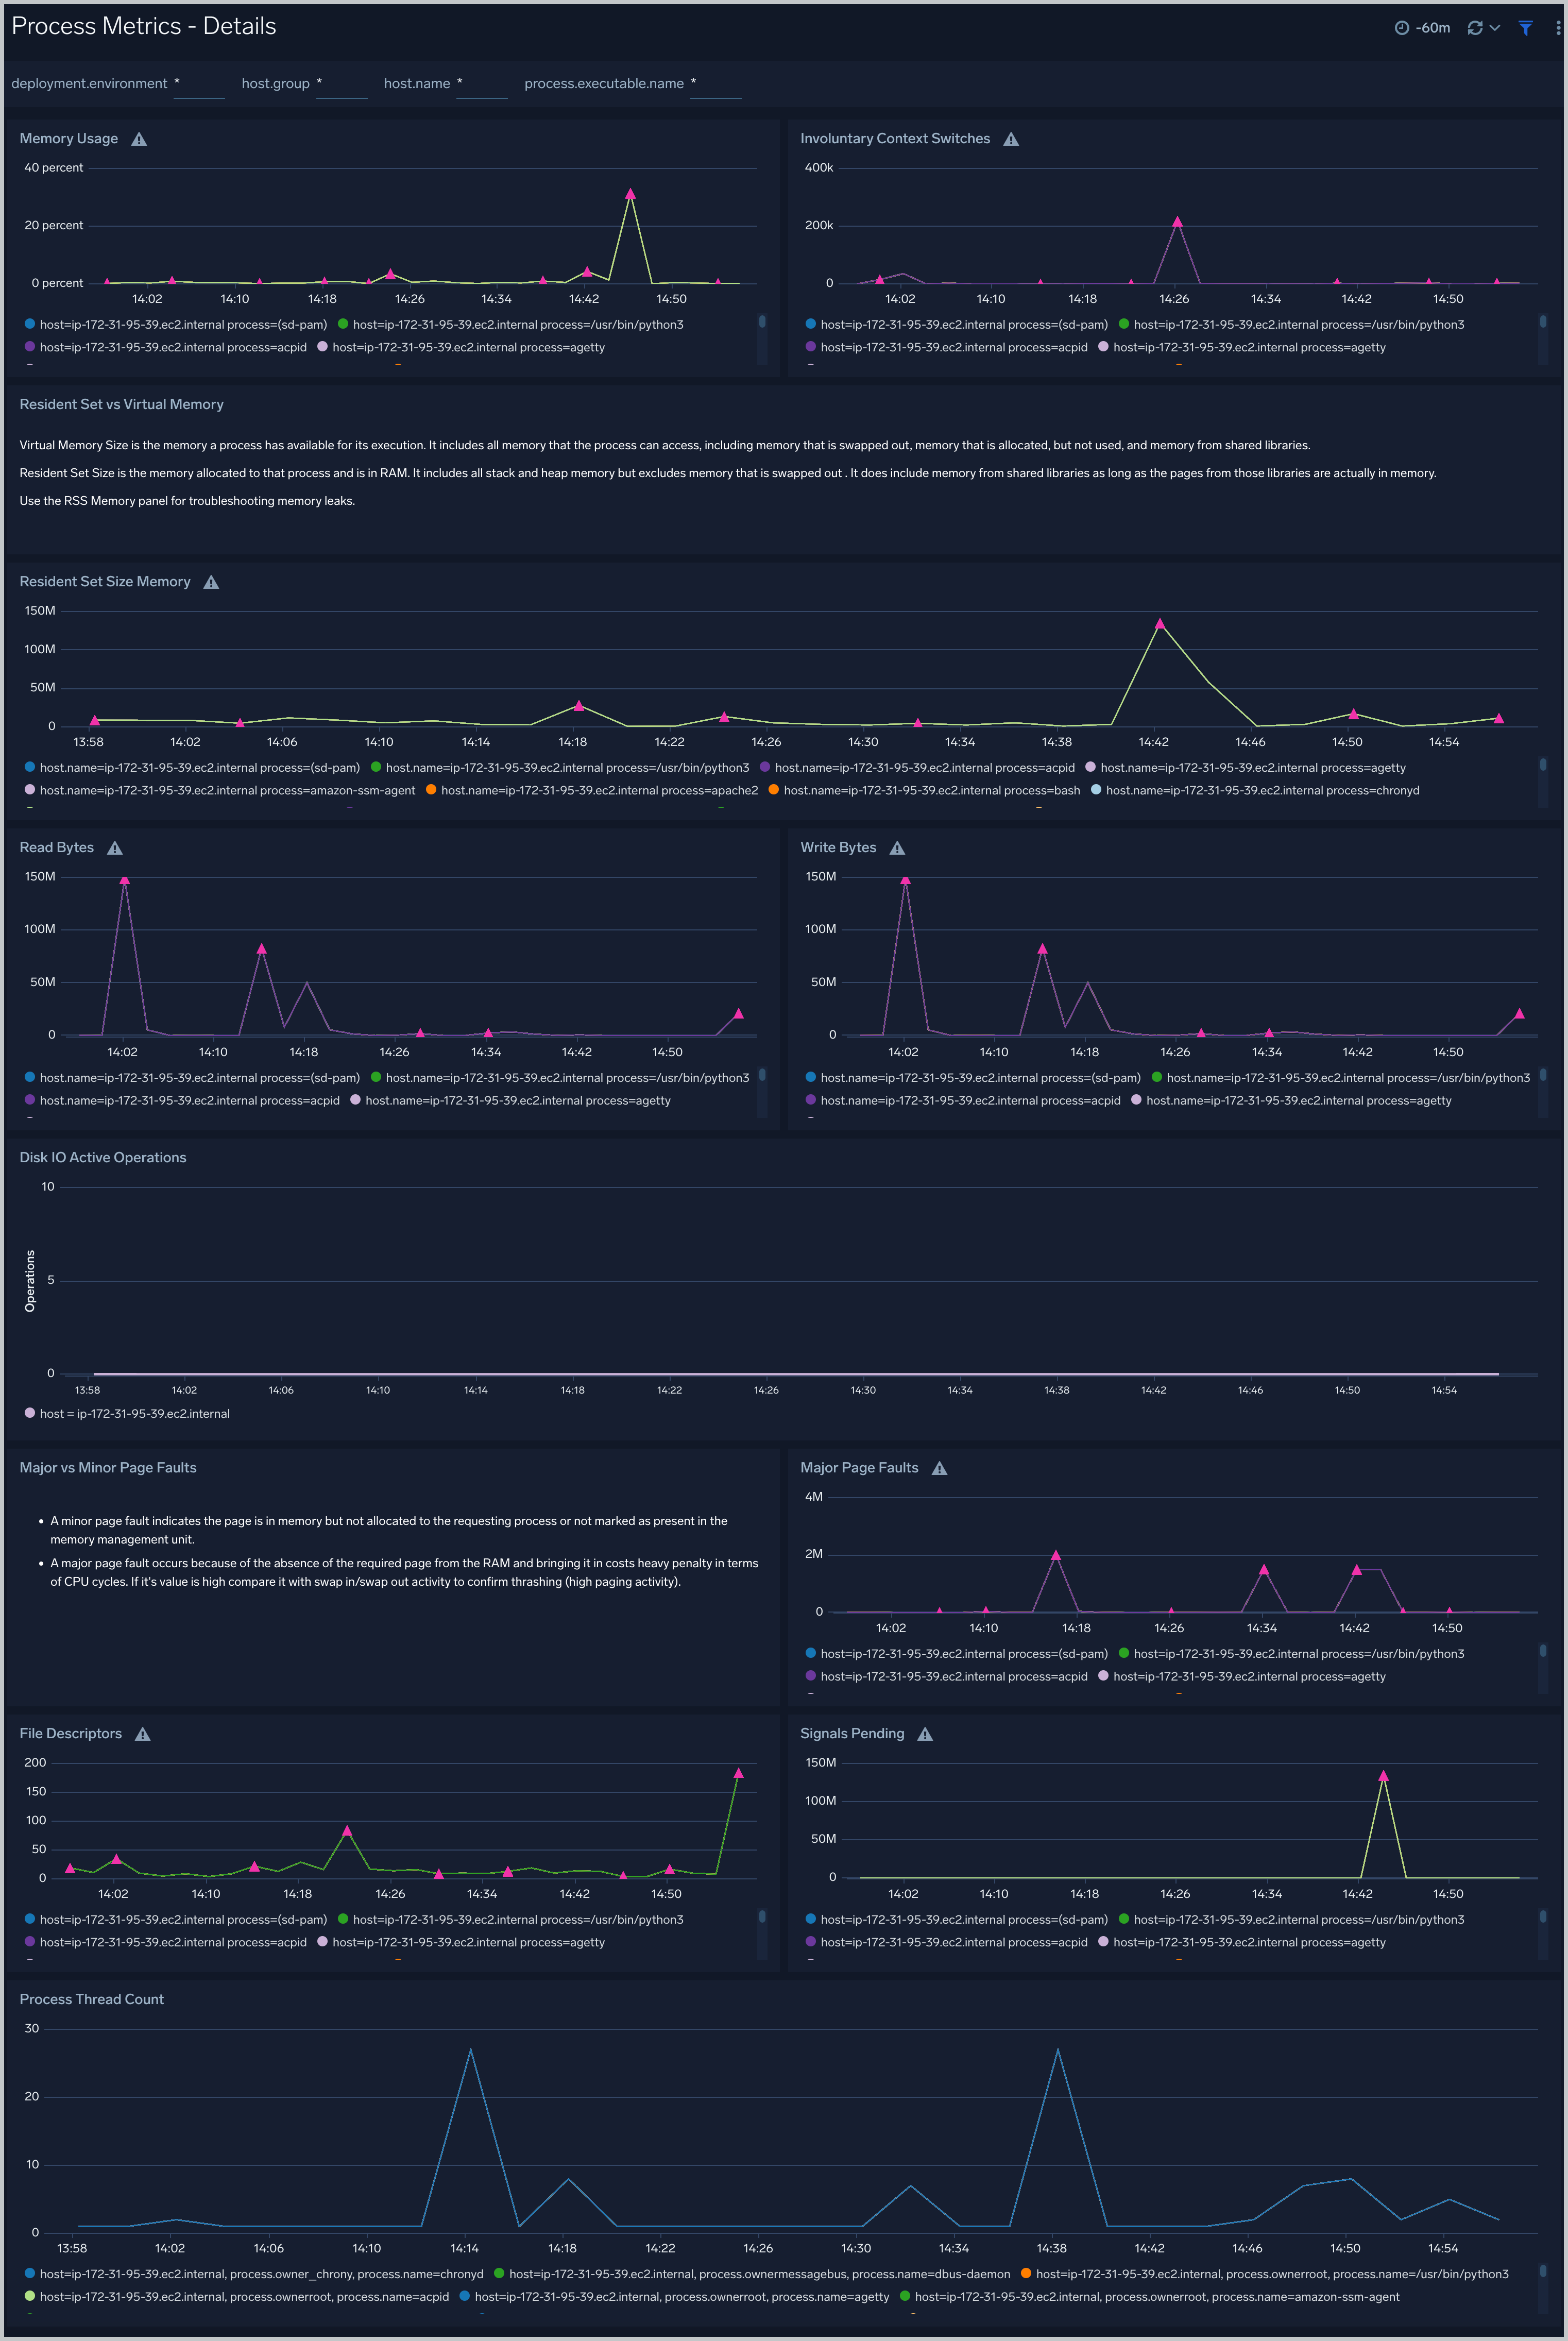
 ### Process Metrics - Details
The **Process Metrics - Details** dashboard gives you a detailed view of key process related metrics such as CPU and memory utilization, disk read/write throughput, and major/minor page faults.
Use this dashboard to:
- Determine the number of open file descriptors in all hosts. If the number of open file descriptors reaches the maximum file descriptor limits, it can cause IOException errors.
- Identify anomalies in CPU usage, memory usage, major/minor page faults and reads/writes over time.
- Troubleshoot memory leaks using the resident set memory trend chart.
### Process Metrics - Details
The **Process Metrics - Details** dashboard gives you a detailed view of key process related metrics such as CPU and memory utilization, disk read/write throughput, and major/minor page faults.
Use this dashboard to:
- Determine the number of open file descriptors in all hosts. If the number of open file descriptors reaches the maximum file descriptor limits, it can cause IOException errors.
- Identify anomalies in CPU usage, memory usage, major/minor page faults and reads/writes over time.
- Troubleshoot memory leaks using the resident set memory trend chart.
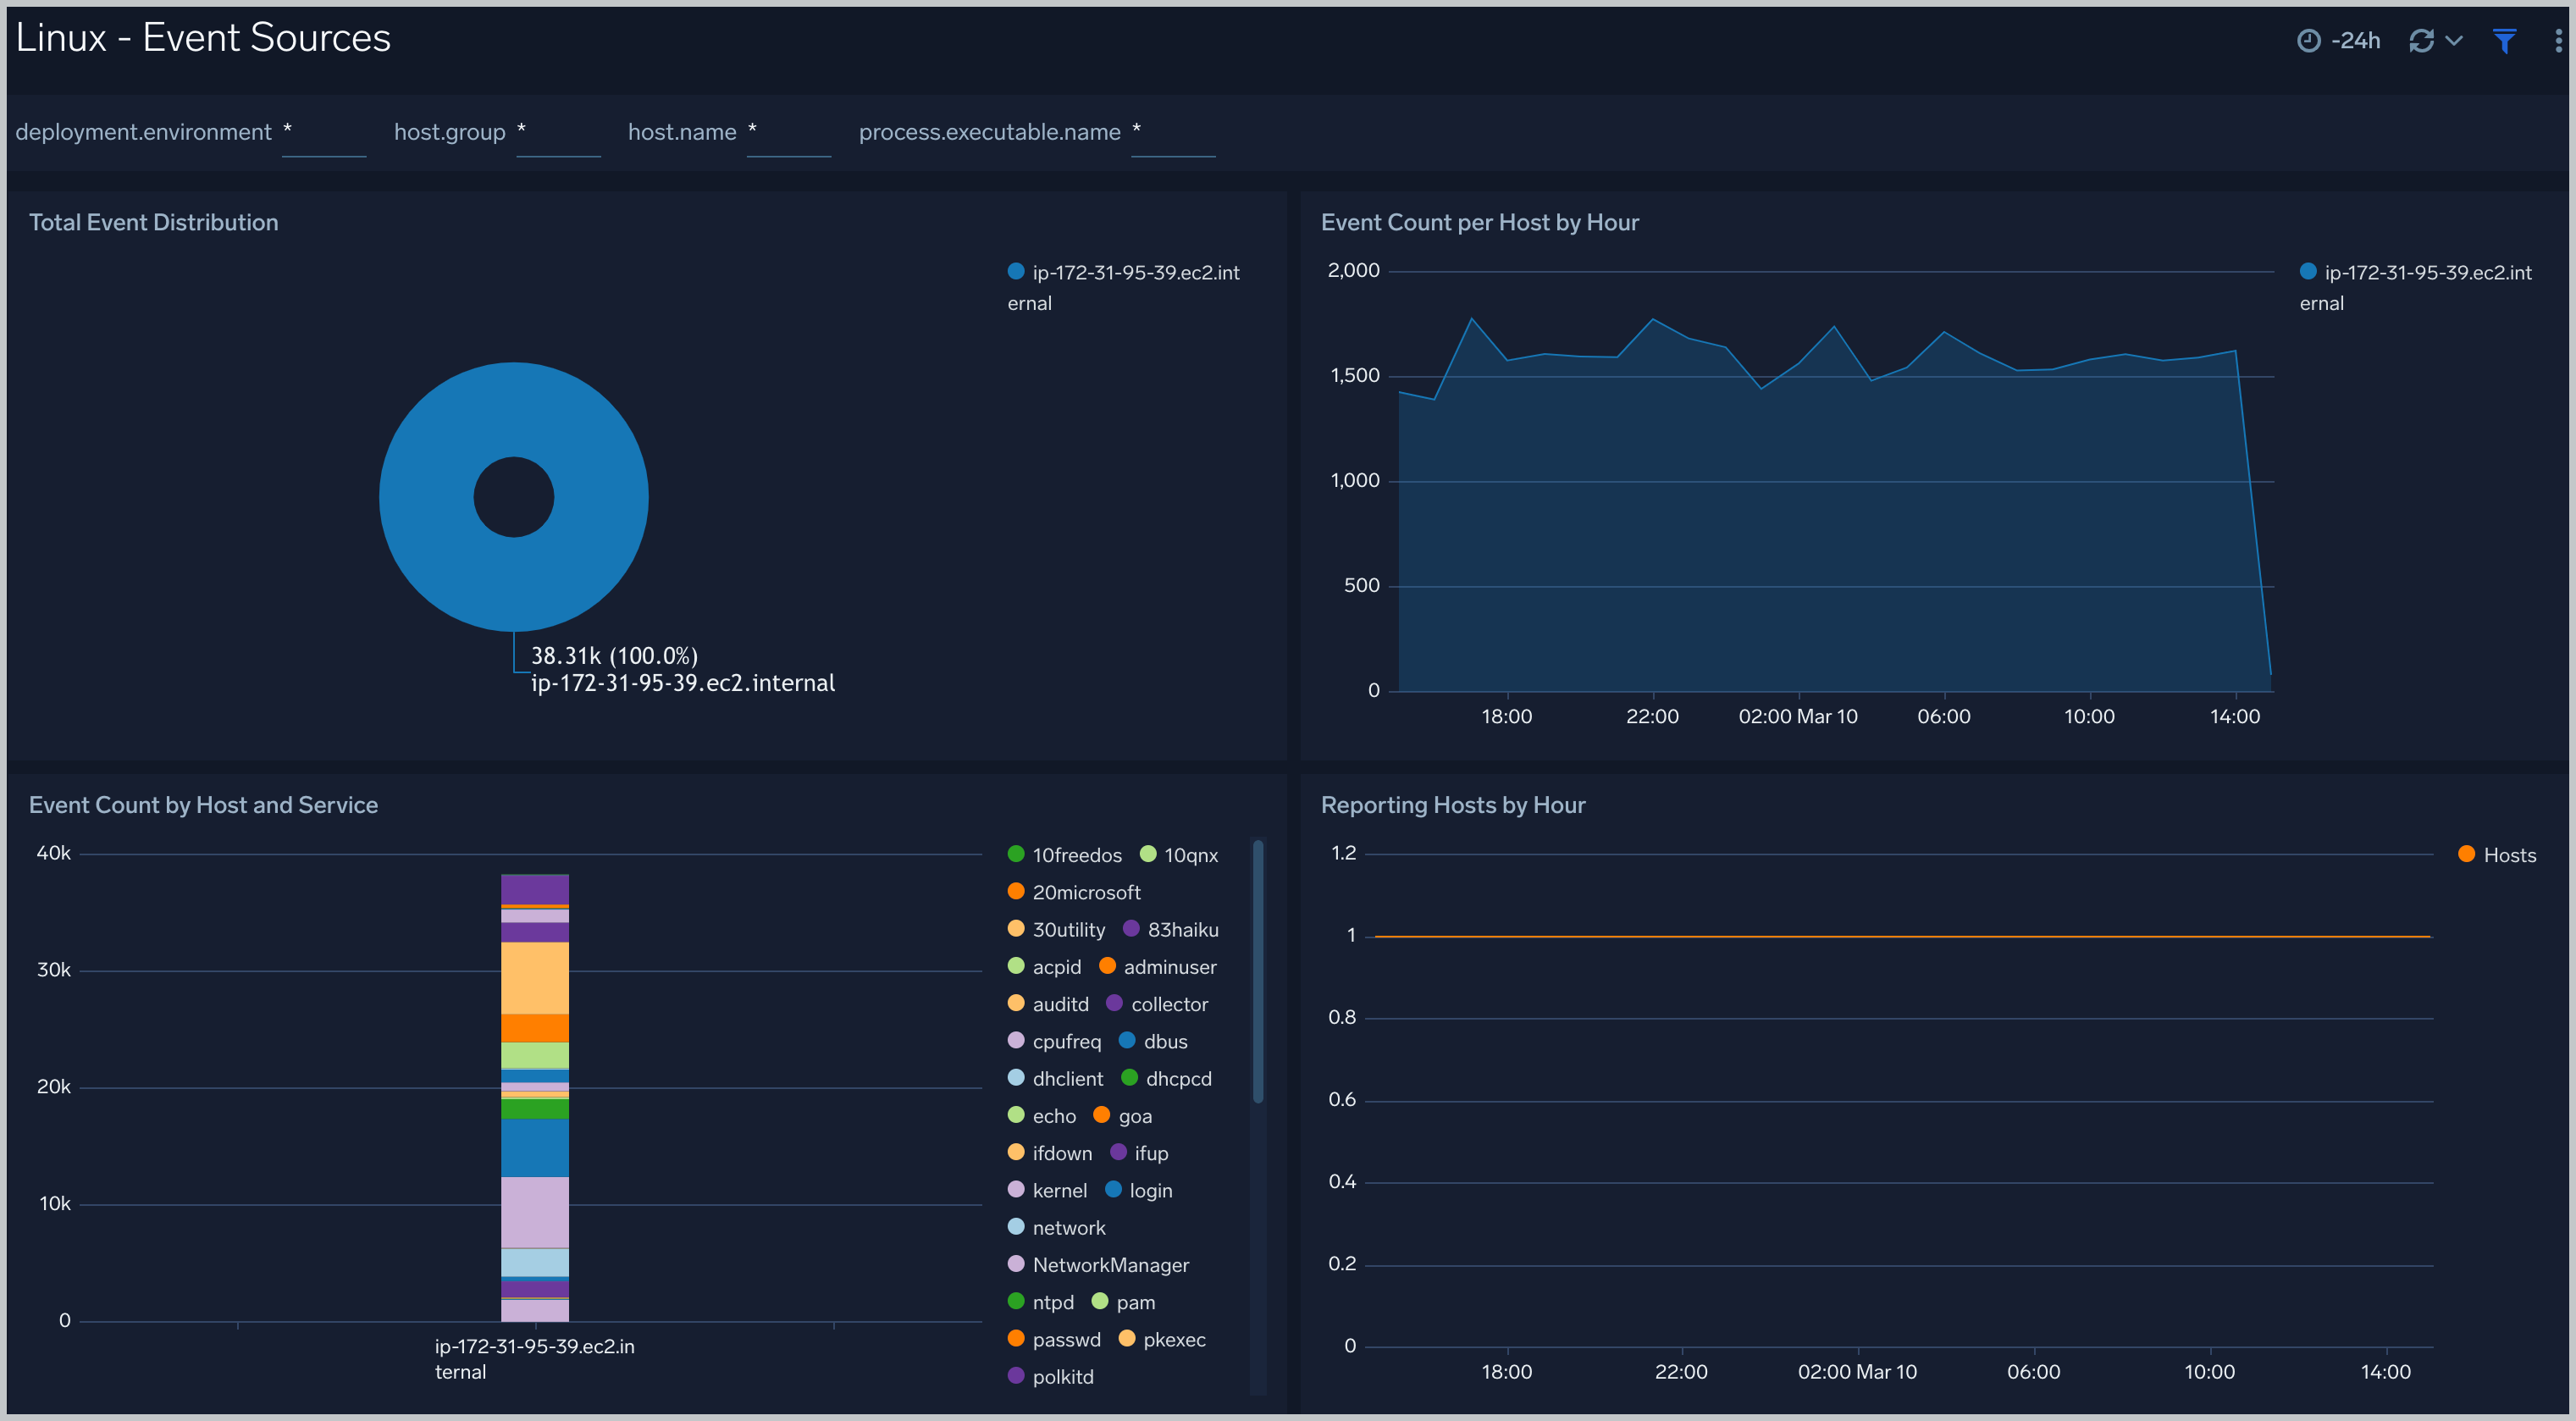
 ### Linux - Event Sources
The **Linux - Event Sources** dashboard provides information about system events, including their distribution across hosts, event counts per host by hour, and even counts by host and service.
### Linux - Event Sources
The **Linux - Event Sources** dashboard provides information about system events, including their distribution across hosts, event counts per host by hour, and even counts by host and service.
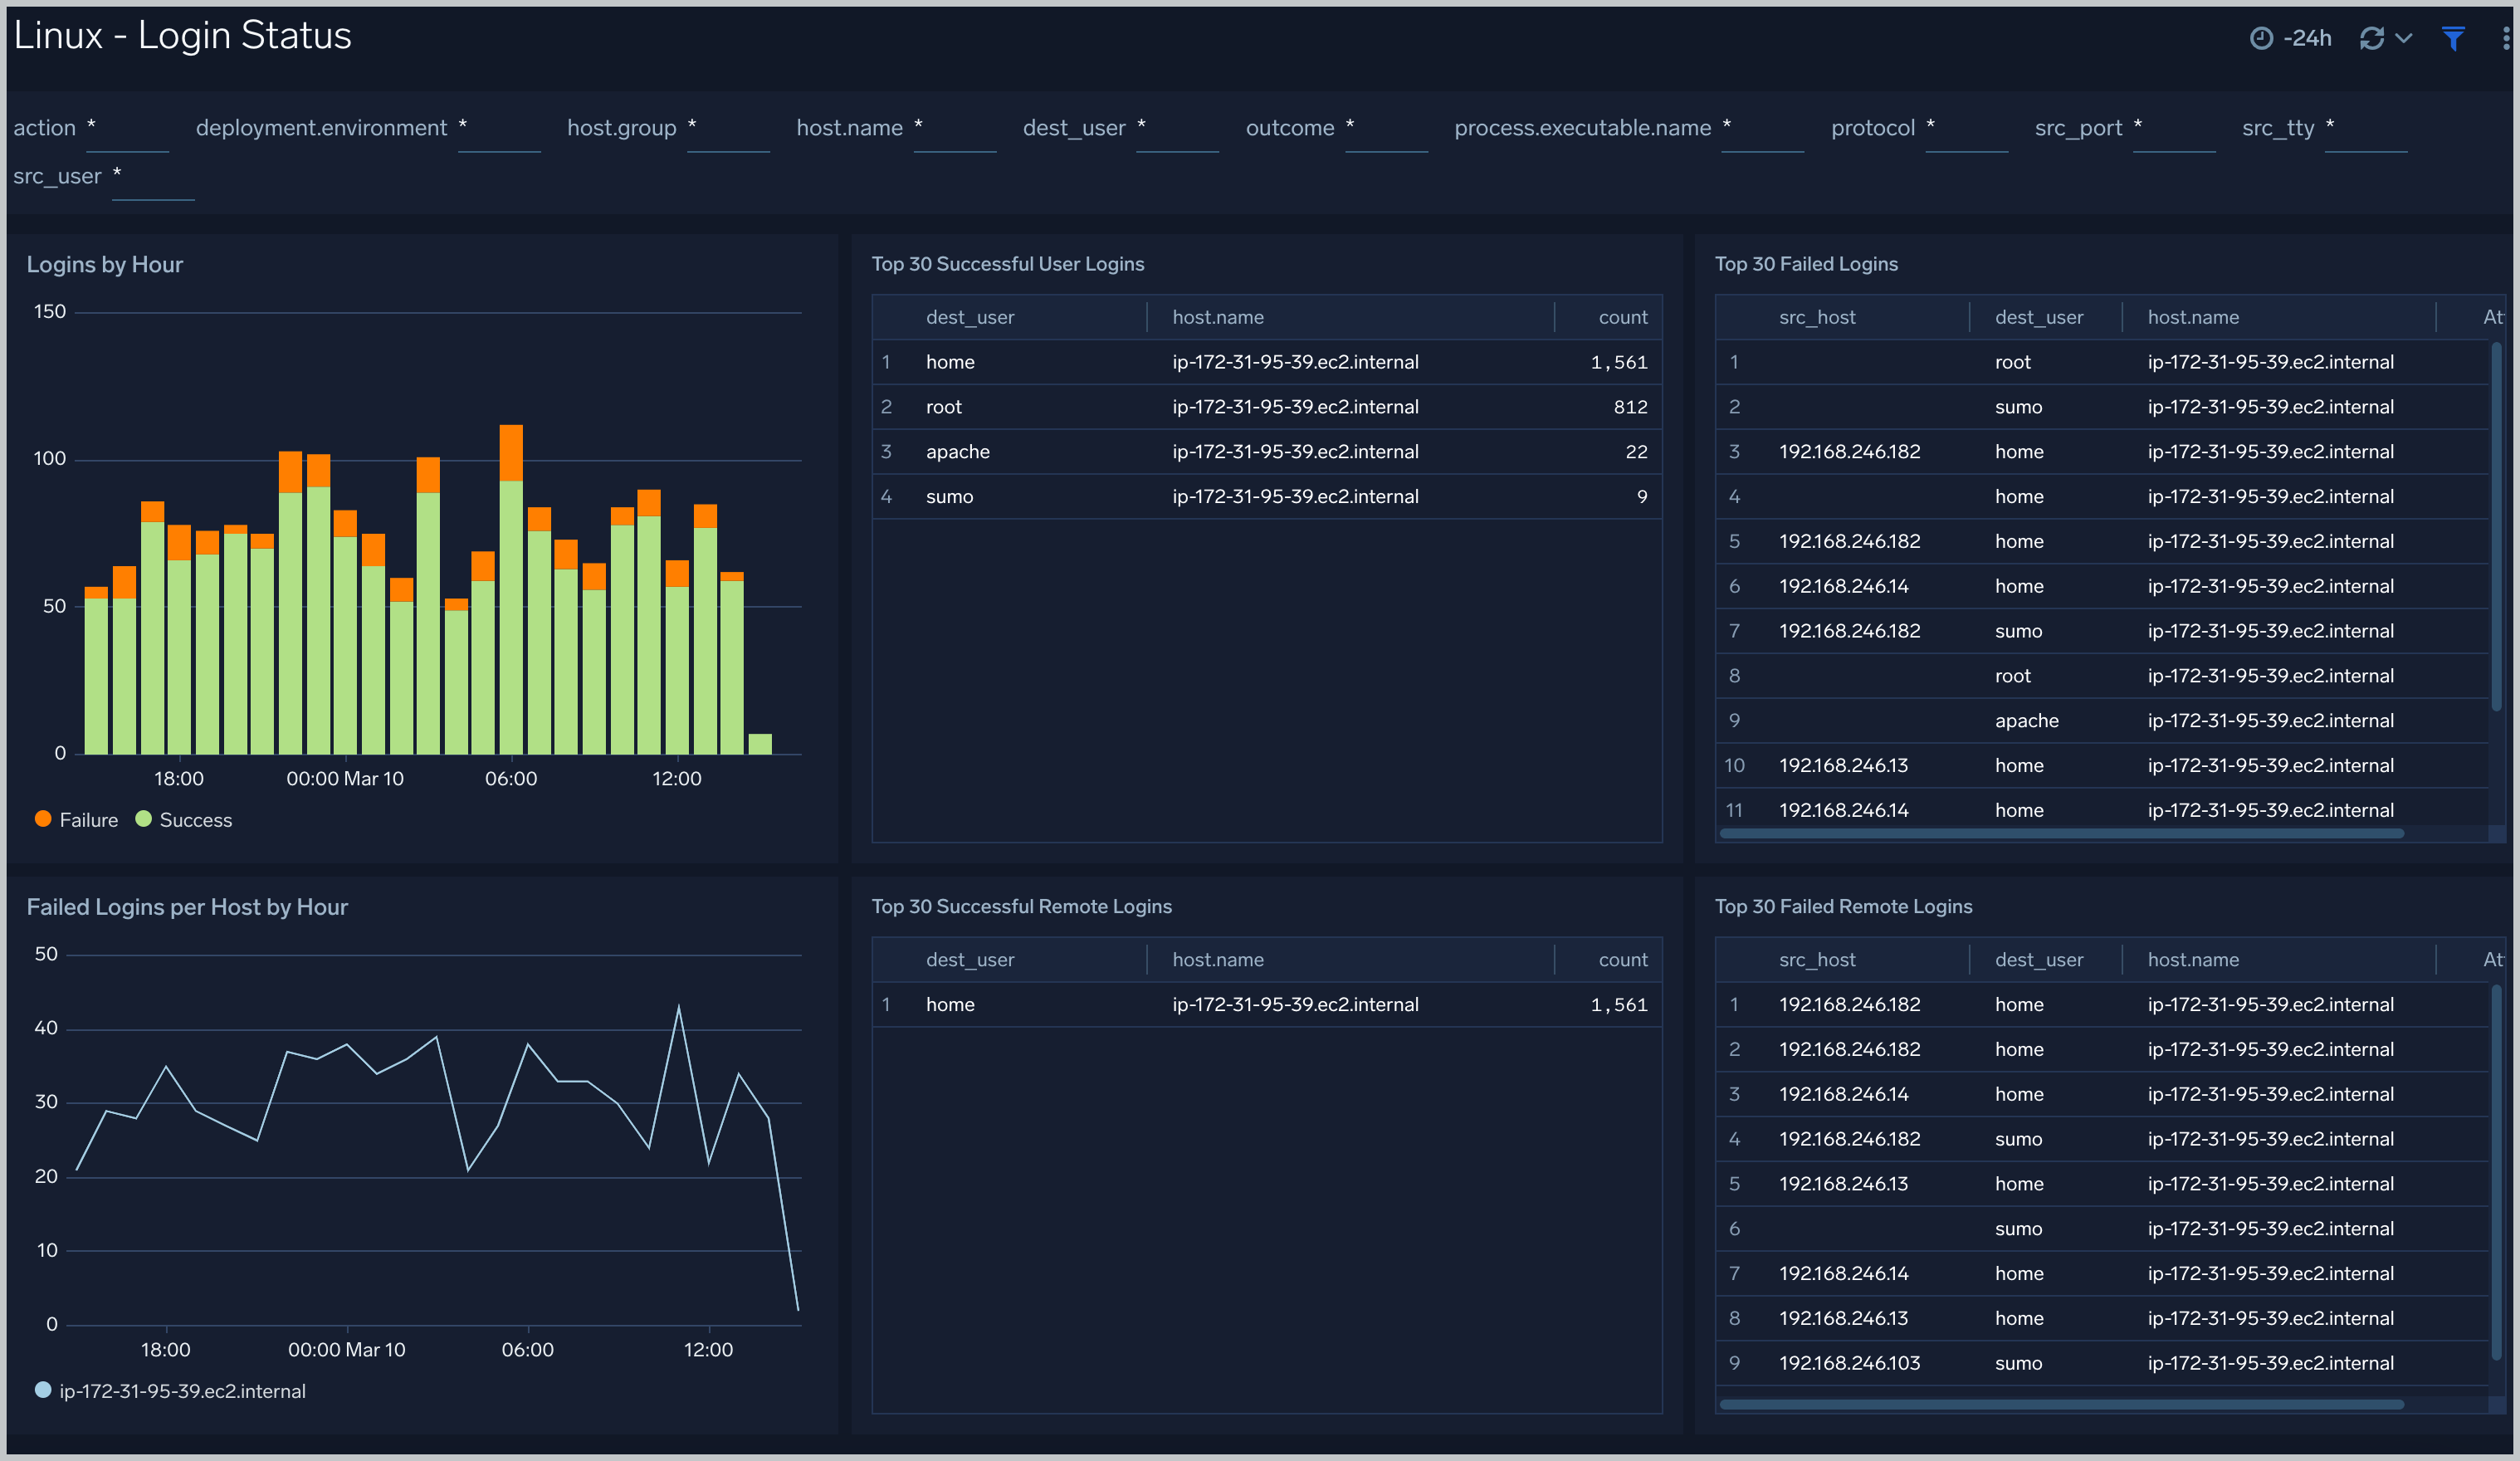
 ### Linux - Login Status
The **Linux - Login Status** dashboard provides information about logins to Linux hosts; including logins by hour; failed logins per host; the top 30 successful and failed logins; and the top 30 successful and failed remote logins.
### Linux - Login Status
The **Linux - Login Status** dashboard provides information about logins to Linux hosts; including logins by hour; failed logins per host; the top 30 successful and failed logins; and the top 30 successful and failed remote logins.
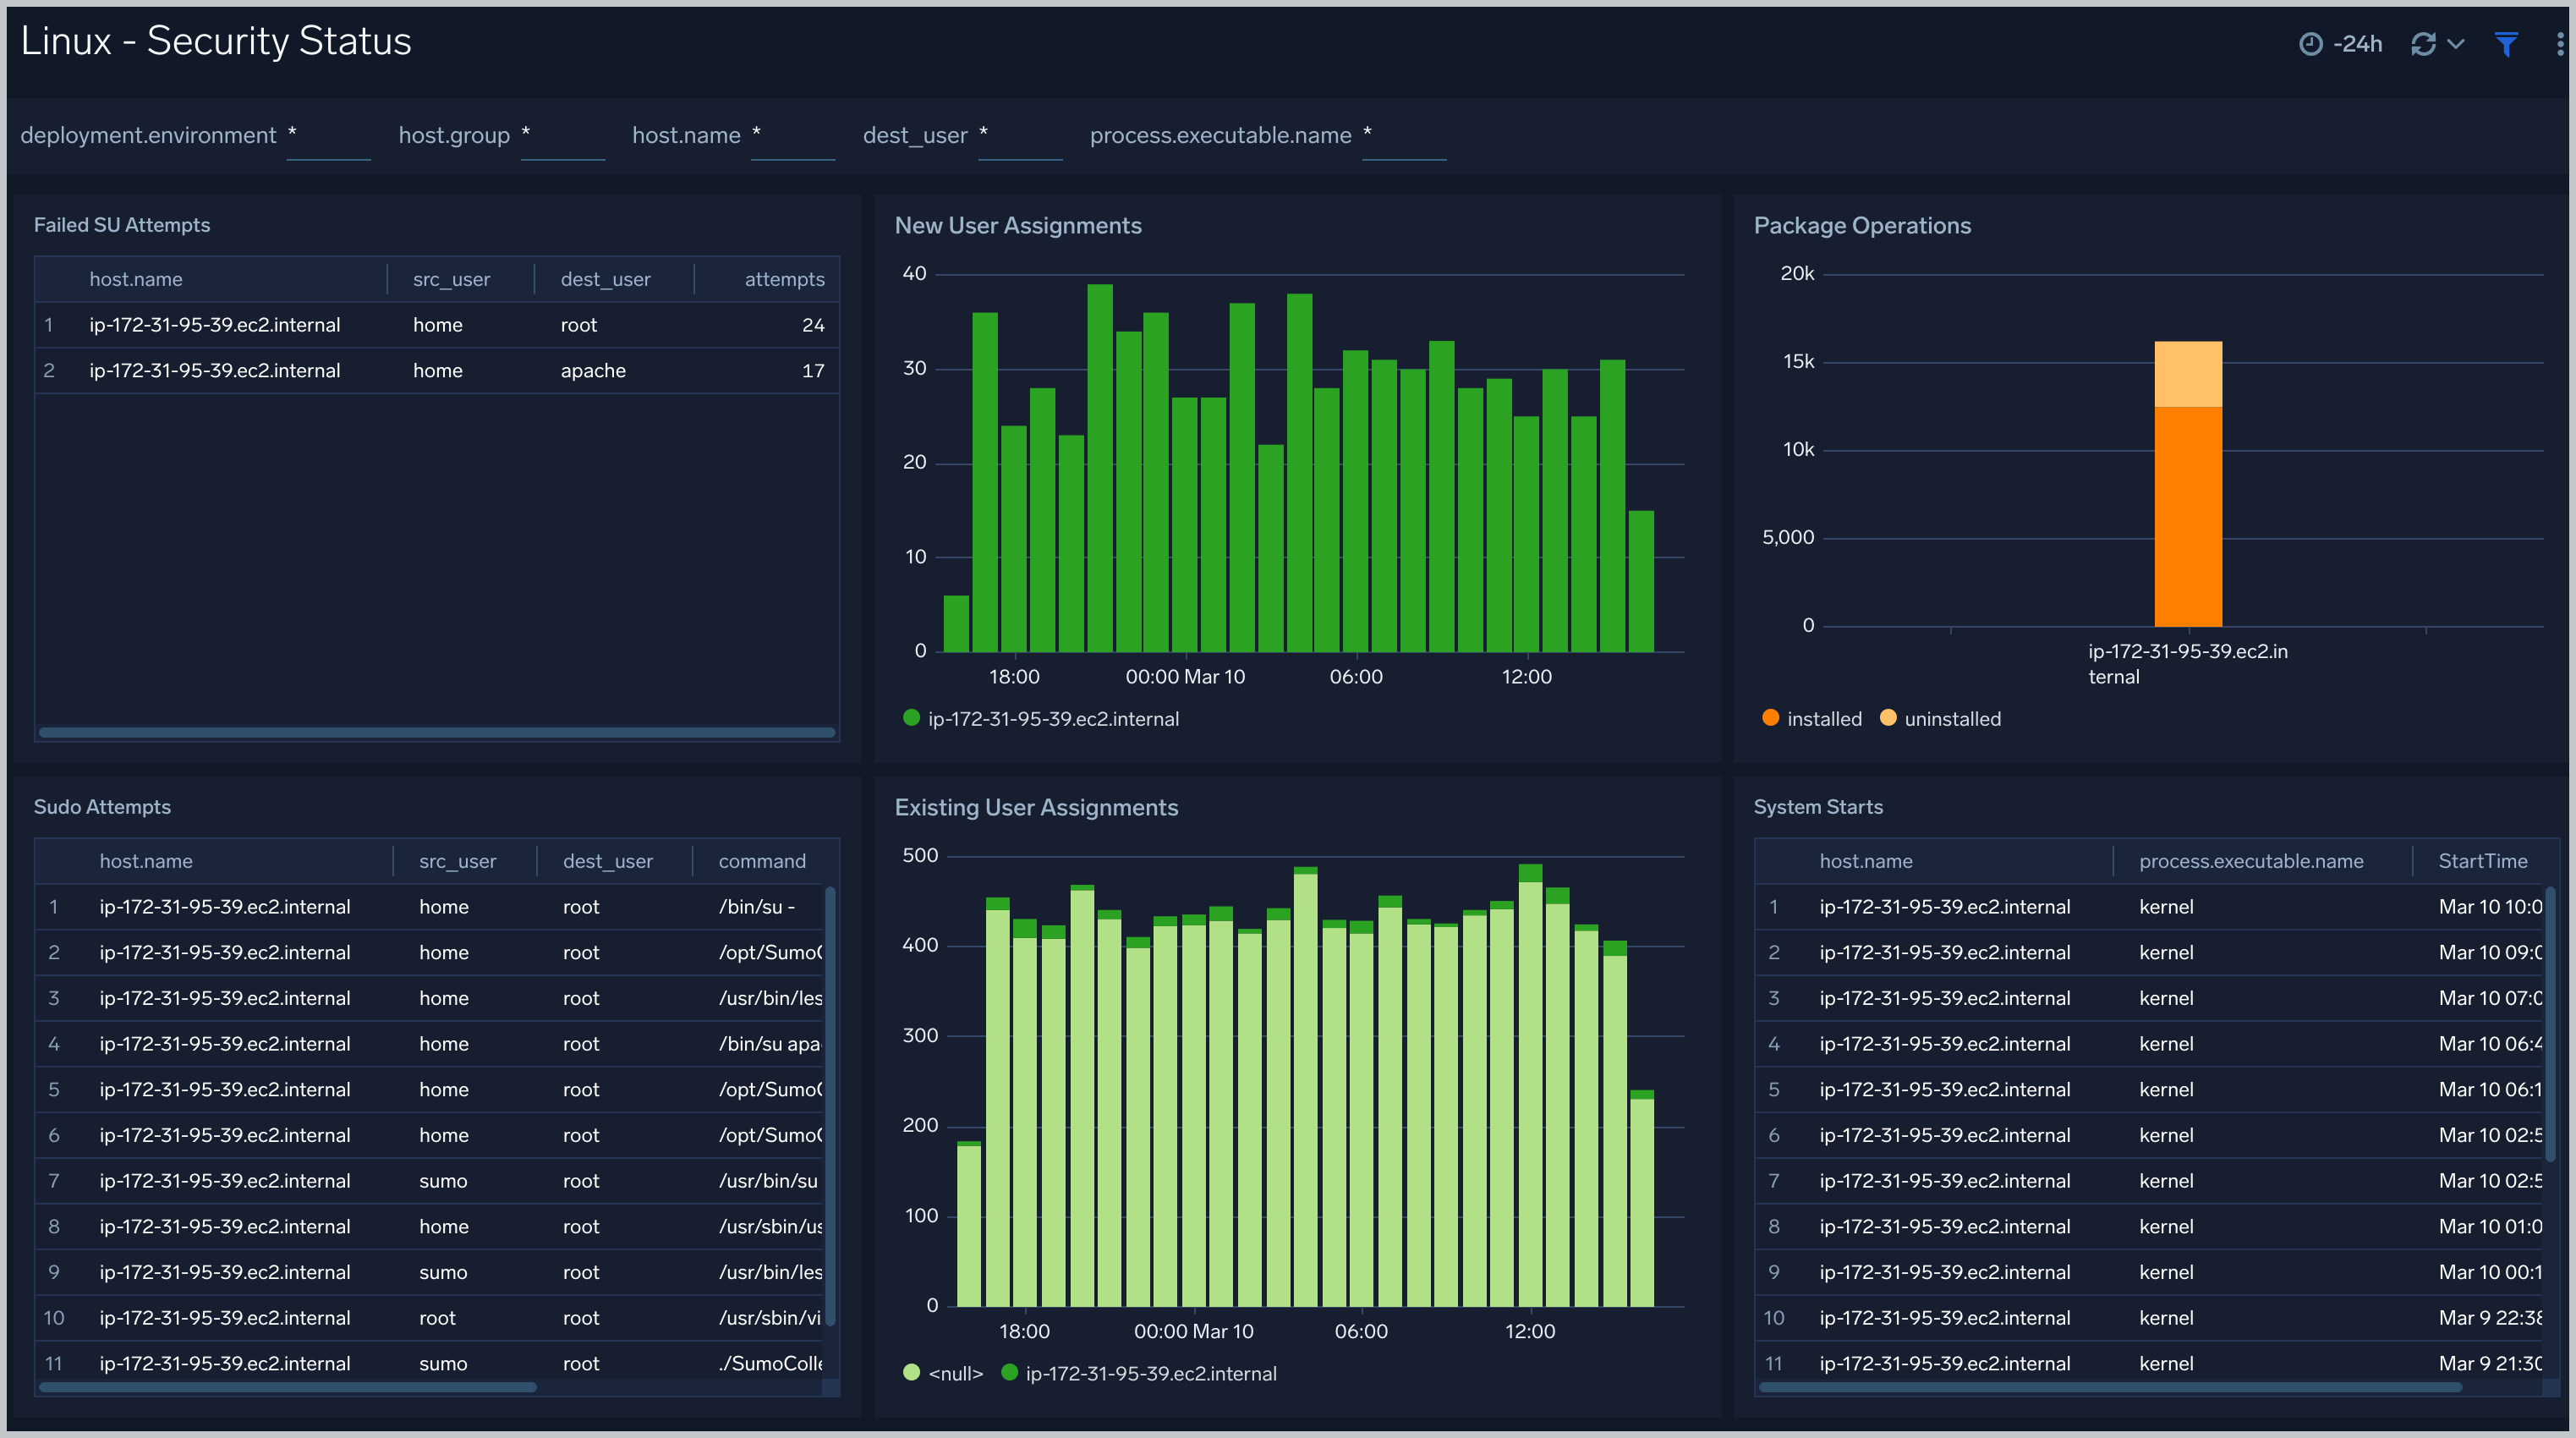
 ### Linux - Security Status
The **Linux - Security Status** dashboard provides information about security on Linux hosts, including su, sudo attempts, new and existing user assignments, package operations, and system start events.
### Linux - Security Status
The **Linux - Security Status** dashboard provides information about security on Linux hosts, including su, sudo attempts, new and existing user assignments, package operations, and system start events.
 ## Create monitors for Linux app
import CreateMonitors from '../../../reuse/apps/create-monitors.md';
### Linux alerts
| Alert Name | Alert Description and conditions | Alert Condition | Recover Condition |
|:--|:--|:--|:--|
| `Linux - High CPU Utilization Alert` | This alert gets triggered when CPU utilization exceeds threshold. | Count > 80 | Count < = 80 |
| `Linux - High FileSystem Utilization Alert` | This alert gets triggered when filesystem utilization exceeds threshold. | Count > 80 | Count < = 80 |
| `Linux - High Memory Utilization Alert` | This alert gets triggered when memory utilization exceeds threshold. | Count > 80 | Count < = 80 |
## Create monitors for Linux app
import CreateMonitors from '../../../reuse/apps/create-monitors.md';
### Linux alerts
| Alert Name | Alert Description and conditions | Alert Condition | Recover Condition |
|:--|:--|:--|:--|
| `Linux - High CPU Utilization Alert` | This alert gets triggered when CPU utilization exceeds threshold. | Count > 80 | Count < = 80 |
| `Linux - High FileSystem Utilization Alert` | This alert gets triggered when filesystem utilization exceeds threshold. | Count > 80 | Count < = 80 |
| `Linux - High Memory Utilization Alert` | This alert gets triggered when memory utilization exceeds threshold. | Count > 80 | Count < = 80 |