---
id: macos-opentelemetry
title: macOS - OpenTelemetry Collector
sidebar_label: macOS - OTel Collector
description: Learn about the Sumo Logic OpenTelemetry app for MacOS.
slug: /help/docs/integrations/hosts-operating-systems/opentelemetry/macos-opentelemetry/
canonical: https://www.sumologic.com/help/docs/integrations/hosts-operating-systems/opentelemetry/macos-opentelemetry/
---
import useBaseUrl from '@docusaurus/useBaseUrl';
import Tabs from '@theme/Tabs';
import TabItem from '@theme/TabItem';
})
}) The Sumo Logic app for macOS allows you to monitor the performance and resource utilization of hosts and processes that your mission-critical applications are dependent upon.
The app consists of predefined searches and dashboards that provide visibility into your environment for real-time or historical analysis. Our dashboards provide insight into CPU load, memory, network, file descriptors, page faults, and TCP connectors. This app uses OpenTelemetry, an open-source collector for metrics.
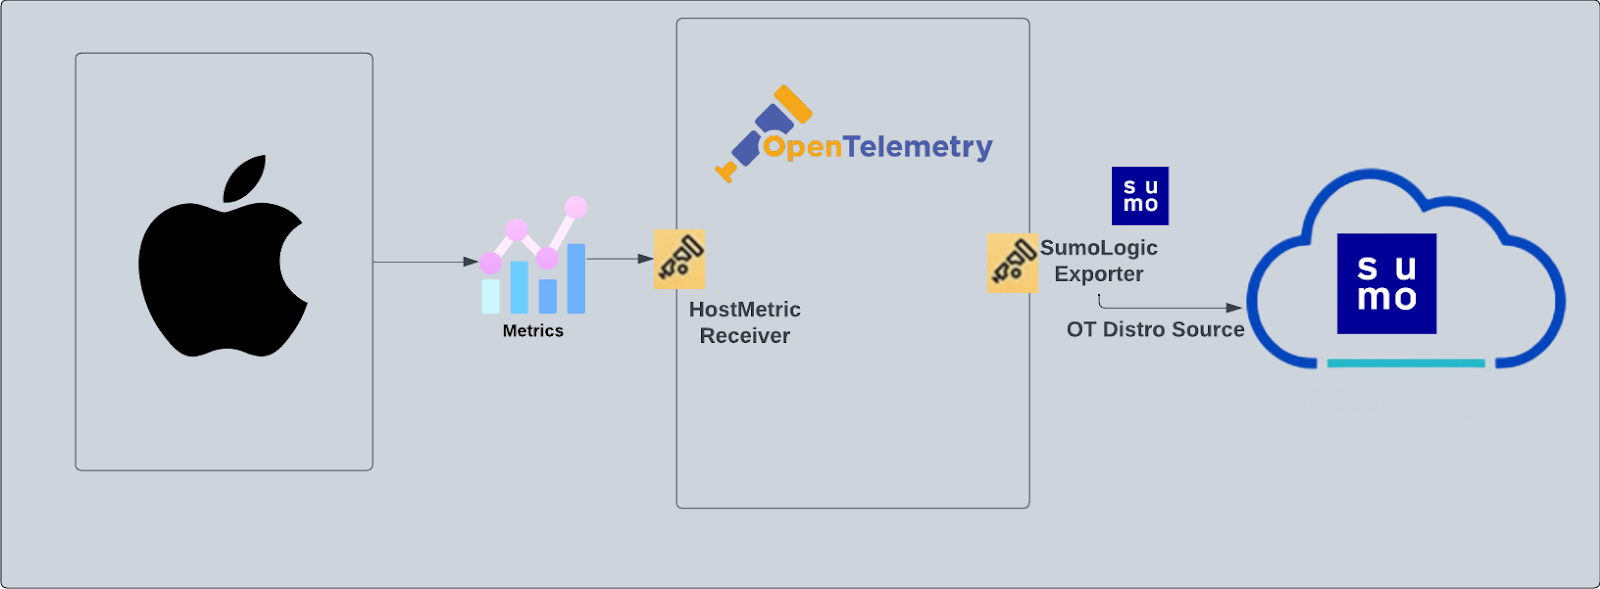
We use the Sumo Logic Distribution for OpenTelemetry Collector for metrics collection.
The OpenTelemetry collector runs on the macOS machine, and uses the [Host Metrics Receiver](https://github.com/open-telemetry/opentelemetry-collector-contrib/tree/main/receiver/hostmetricsreceiver) to obtain host and process metrics, and the [Sumo Logic OpenTelemetry Exporter](https://github.com/open-telemetry/opentelemetry-collector-contrib/tree/main/exporter/sumologicexporter) to send the metrics to Sumo Logic.
The Sumo Logic app for macOS allows you to monitor the performance and resource utilization of hosts and processes that your mission-critical applications are dependent upon.
The app consists of predefined searches and dashboards that provide visibility into your environment for real-time or historical analysis. Our dashboards provide insight into CPU load, memory, network, file descriptors, page faults, and TCP connectors. This app uses OpenTelemetry, an open-source collector for metrics.
We use the Sumo Logic Distribution for OpenTelemetry Collector for metrics collection.
The OpenTelemetry collector runs on the macOS machine, and uses the [Host Metrics Receiver](https://github.com/open-telemetry/opentelemetry-collector-contrib/tree/main/receiver/hostmetricsreceiver) to obtain host and process metrics, and the [Sumo Logic OpenTelemetry Exporter](https://github.com/open-telemetry/opentelemetry-collector-contrib/tree/main/exporter/sumologicexporter) to send the metrics to Sumo Logic.
 :::info
This app includes [built-in monitors](#macos-alerts). For details on creating custom monitors, refer to [Create monitors for macOS app](#create-monitors-for-macos-app).
:::
## Fields Created in Sumo Logic for macOS
Following are the [fields](/docs/manage/fields/) which will be created as part of the macOS app install, if not already present.
- **`sumo.datasource`**. Has a fixed value of `mac`.
- **`deployment.environment`**. This is a collector level field and is user configured (at the time of collector installation). Through this, the mac host cluster is identified by the environment where it resides. For example: `dev`, `prod`, or `qa`.
- **`host.group`**. This is a collector level field and is user configured (at the time of collector installation). Through this, the mac host cluster is identified.
- **`host.name`**. This is tagged through the `resourcedetection` processor. It holds the value of the host name where the OTel collector is installed.
## Collection configuration and app installation
Follow these steps to set up and deploy the source template to collect data in Sumo Logic from a remotely managed OpenTelemetry collector.
### Step 1: Set up remotely managed OpenTelemetry collector
import OtelCollectorInstallation from '../../../reuse/apps/opentelemetry/otel-collector-installation.md';
:::note
If you want to configure your source locally, you can do so by downloading the YAML file. For details, see [Configure OpenTelemetry collectors locally](/docs/integrations/sumo-apps/opentelemetry-collector-insights/#configure-opentelemetry-collectors-locally).
:::
### Step 2: Configure the source template
import MacConfigureSourceTemplate from '../../../reuse/send-data/mac-configure-source-template.md';
### Step 3: Push the source template to the desired remotely managed collectors
import DataConfiguration from '../../../reuse/apps/opentelemetry/data-configuration.md';
## Sample metrics
```json
{
"queryId":"A",
"_source":"sumo-mac-dc8d7942-8038-46f0-af33-9a3a06a73f72",
"state":"LAST_ACK",
"_sourceName":"sumomacsyslog",
"host":"sumo-mac",
"os.type":"darwin",
"sumo.datasource":"mac",
"_sourceCategory":"sumo/mac/sys/logs",
"metric":"system.network.connections",
"_collectorId":"000000000CAADE8D",
"_sourceId":"0000000000000000",
"unit":"{connections}",
"_sourceHost":"sumo-mac",
"_collector":"sumo-mac-dc8d7942-8038-46f0-af33-9a3a06a73f72",
"protocol":"tcp",
"max":0,
"min":0,
"avg":0,
"sum":0,
"latest":0,
"count":14
}
```
## Sample queries
Metrics query from the File System Utilization panel.
```sh
sumo.datasource=mac host.name=* device=* metric=system.filesystem.utilization | sum by host.name, device, type, mountpoint
```
## Viewing macOS dashboards
All dashboards have a set of filters that you can apply to the entire dashboard. Use these filters to drill down and examine the data to a granular level.
- You can change the time range for a dashboard or panel by selecting a predefined interval from a drop-down list, choosing a recently used time range, or specifying custom dates and times. [Learn more](/docs/dashboards/set-custom-time-ranges/).
- You can use template variables to drill down and examine the data on a granular level. For more information, see [Filtering Dashboards with Template Variables](/docs/dashboards/filter-template-variables/).
### Host Metrics - Overview
The **Host Metrics - Overview** dashboard gives you an at-a-glance view of the key metrics like CPU load, memory, network, and TCP connections of all your macOS hosts. Use this dashboard to identify hosts with high CPU load, memory utilization, and identify anomalies over time.
:::info
This app includes [built-in monitors](#macos-alerts). For details on creating custom monitors, refer to [Create monitors for macOS app](#create-monitors-for-macos-app).
:::
## Fields Created in Sumo Logic for macOS
Following are the [fields](/docs/manage/fields/) which will be created as part of the macOS app install, if not already present.
- **`sumo.datasource`**. Has a fixed value of `mac`.
- **`deployment.environment`**. This is a collector level field and is user configured (at the time of collector installation). Through this, the mac host cluster is identified by the environment where it resides. For example: `dev`, `prod`, or `qa`.
- **`host.group`**. This is a collector level field and is user configured (at the time of collector installation). Through this, the mac host cluster is identified.
- **`host.name`**. This is tagged through the `resourcedetection` processor. It holds the value of the host name where the OTel collector is installed.
## Collection configuration and app installation
Follow these steps to set up and deploy the source template to collect data in Sumo Logic from a remotely managed OpenTelemetry collector.
### Step 1: Set up remotely managed OpenTelemetry collector
import OtelCollectorInstallation from '../../../reuse/apps/opentelemetry/otel-collector-installation.md';
:::note
If you want to configure your source locally, you can do so by downloading the YAML file. For details, see [Configure OpenTelemetry collectors locally](/docs/integrations/sumo-apps/opentelemetry-collector-insights/#configure-opentelemetry-collectors-locally).
:::
### Step 2: Configure the source template
import MacConfigureSourceTemplate from '../../../reuse/send-data/mac-configure-source-template.md';
### Step 3: Push the source template to the desired remotely managed collectors
import DataConfiguration from '../../../reuse/apps/opentelemetry/data-configuration.md';
## Sample metrics
```json
{
"queryId":"A",
"_source":"sumo-mac-dc8d7942-8038-46f0-af33-9a3a06a73f72",
"state":"LAST_ACK",
"_sourceName":"sumomacsyslog",
"host":"sumo-mac",
"os.type":"darwin",
"sumo.datasource":"mac",
"_sourceCategory":"sumo/mac/sys/logs",
"metric":"system.network.connections",
"_collectorId":"000000000CAADE8D",
"_sourceId":"0000000000000000",
"unit":"{connections}",
"_sourceHost":"sumo-mac",
"_collector":"sumo-mac-dc8d7942-8038-46f0-af33-9a3a06a73f72",
"protocol":"tcp",
"max":0,
"min":0,
"avg":0,
"sum":0,
"latest":0,
"count":14
}
```
## Sample queries
Metrics query from the File System Utilization panel.
```sh
sumo.datasource=mac host.name=* device=* metric=system.filesystem.utilization | sum by host.name, device, type, mountpoint
```
## Viewing macOS dashboards
All dashboards have a set of filters that you can apply to the entire dashboard. Use these filters to drill down and examine the data to a granular level.
- You can change the time range for a dashboard or panel by selecting a predefined interval from a drop-down list, choosing a recently used time range, or specifying custom dates and times. [Learn more](/docs/dashboards/set-custom-time-ranges/).
- You can use template variables to drill down and examine the data on a granular level. For more information, see [Filtering Dashboards with Template Variables](/docs/dashboards/filter-template-variables/).
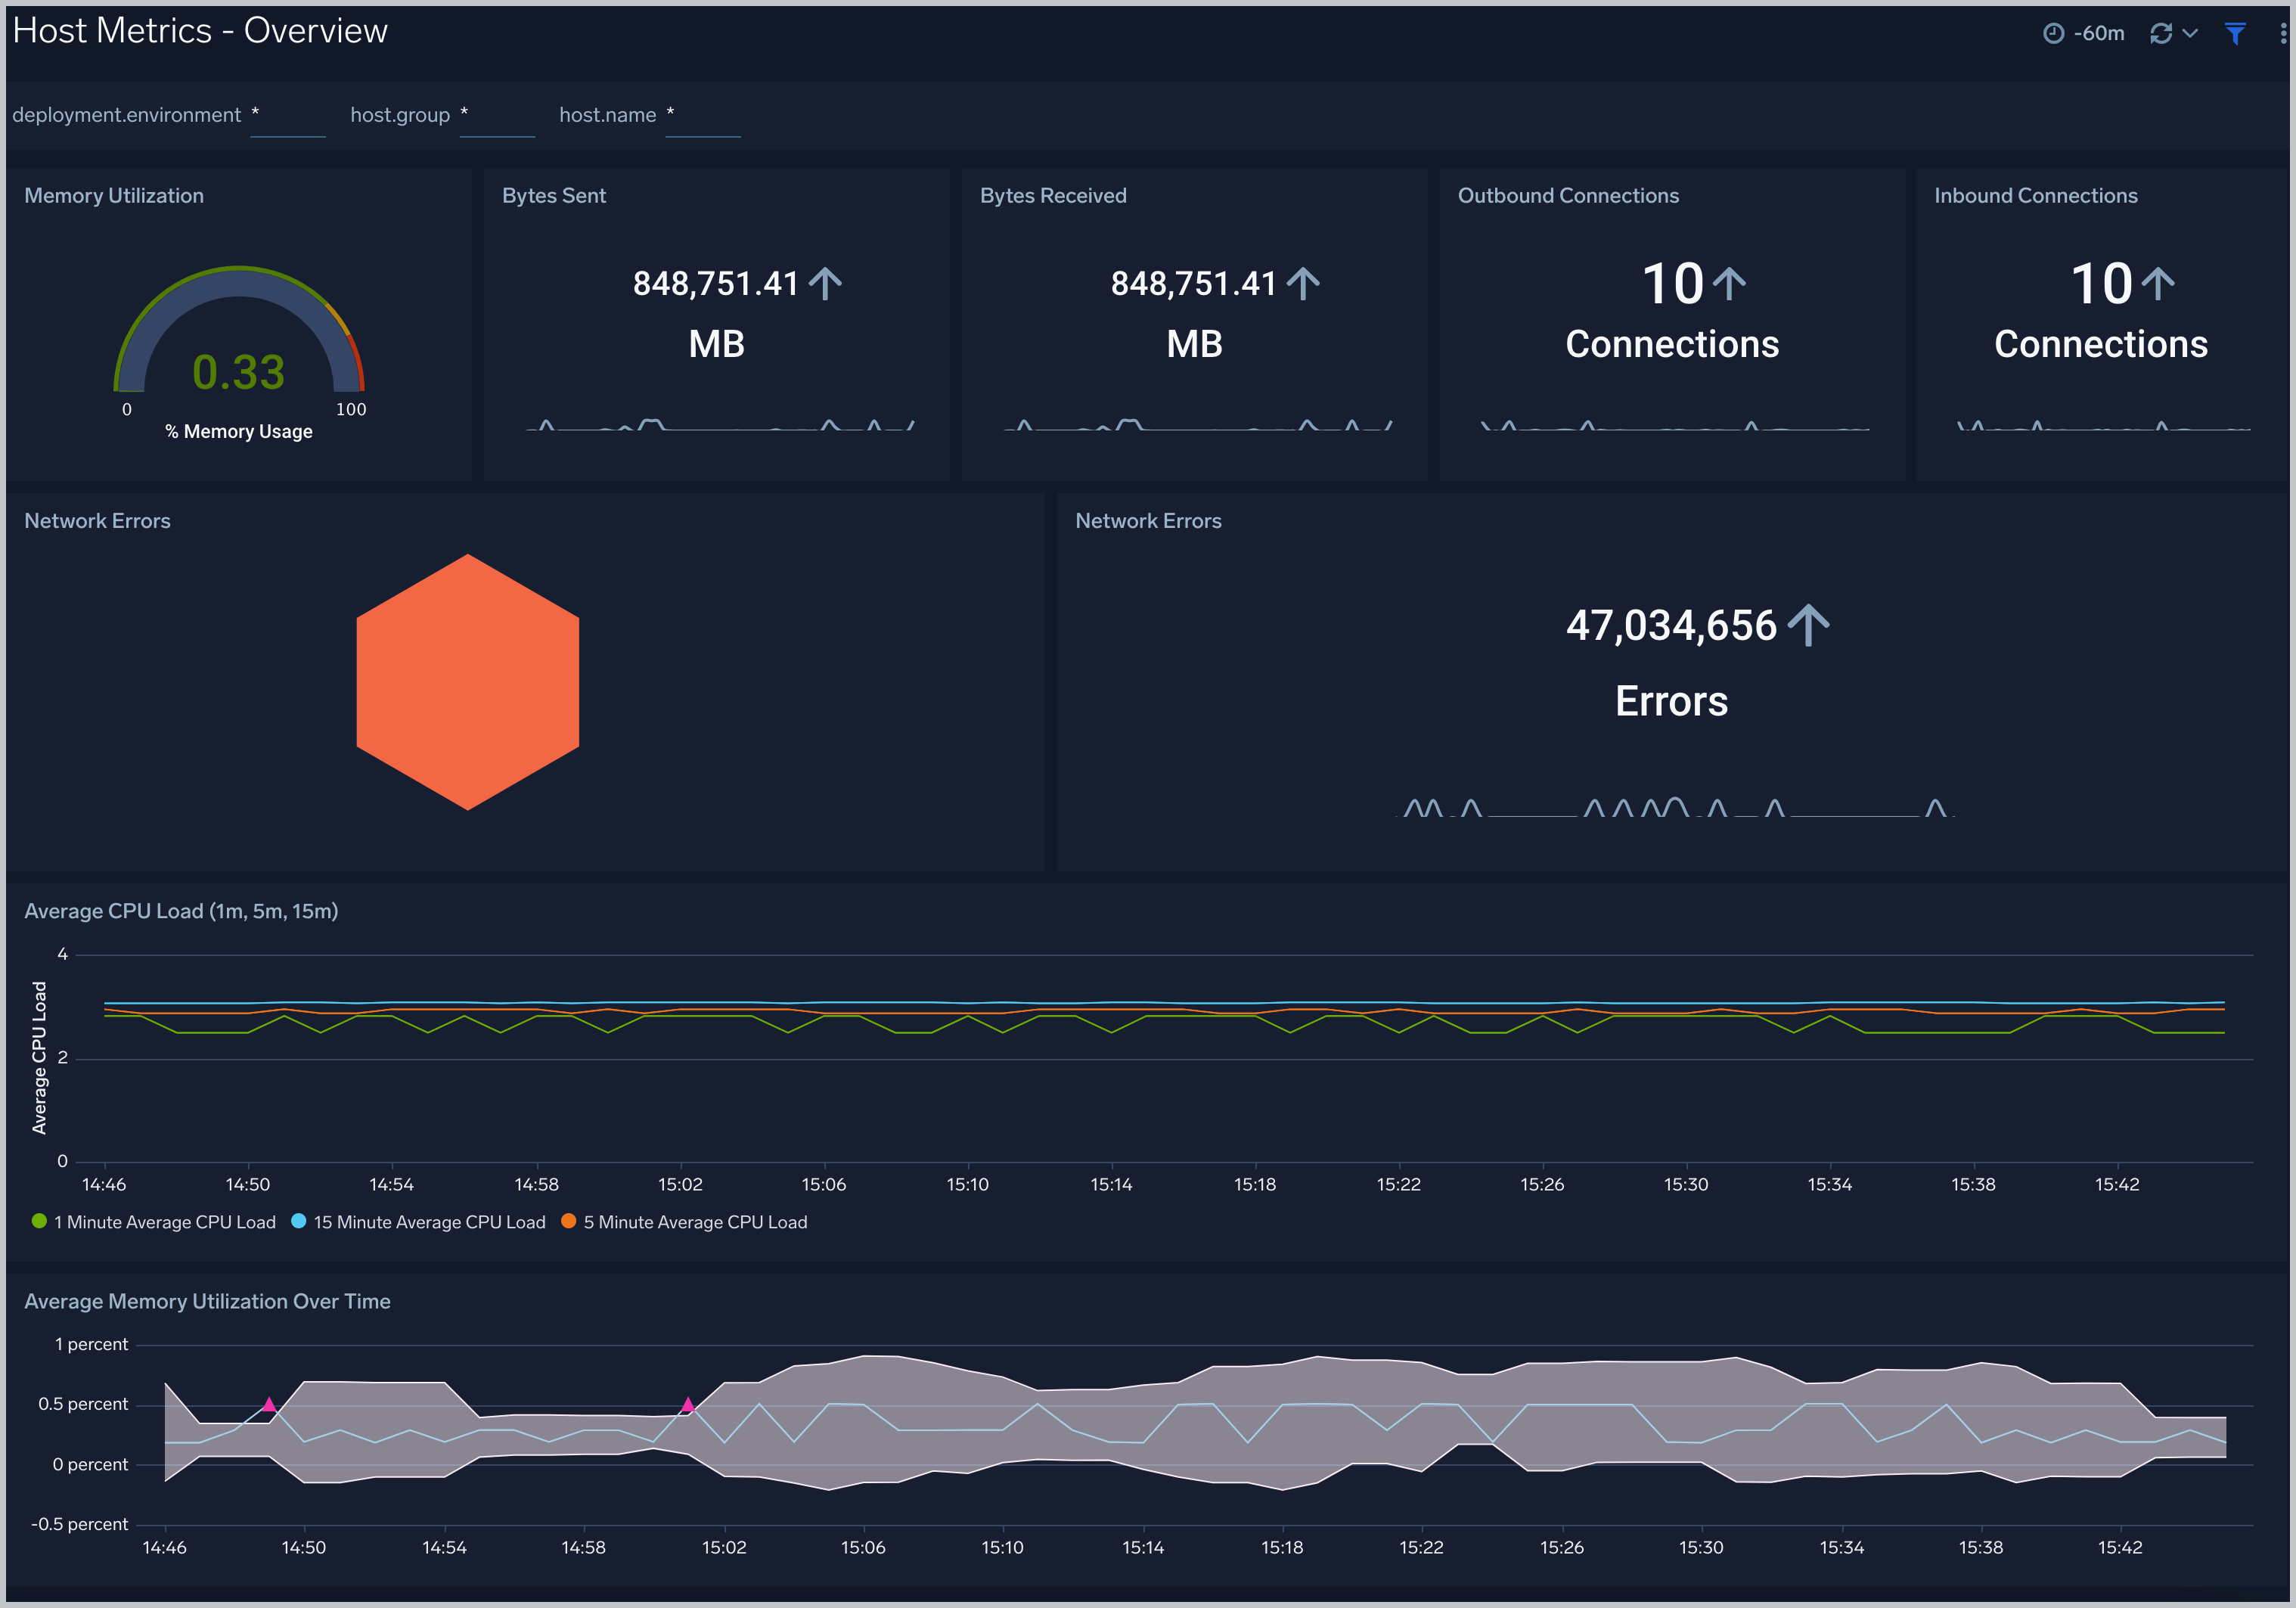
### Host Metrics - Overview
The **Host Metrics - Overview** dashboard gives you an at-a-glance view of the key metrics like CPU load, memory, network, and TCP connections of all your macOS hosts. Use this dashboard to identify hosts with high CPU load, memory utilization, and identify anomalies over time.
 ### Host Metrics - CPU
The **Host Metrics - CPU** dashboard provides the metric over time for CPU load. Use this dashboard to identify hosts and processes with high CPU utilization.
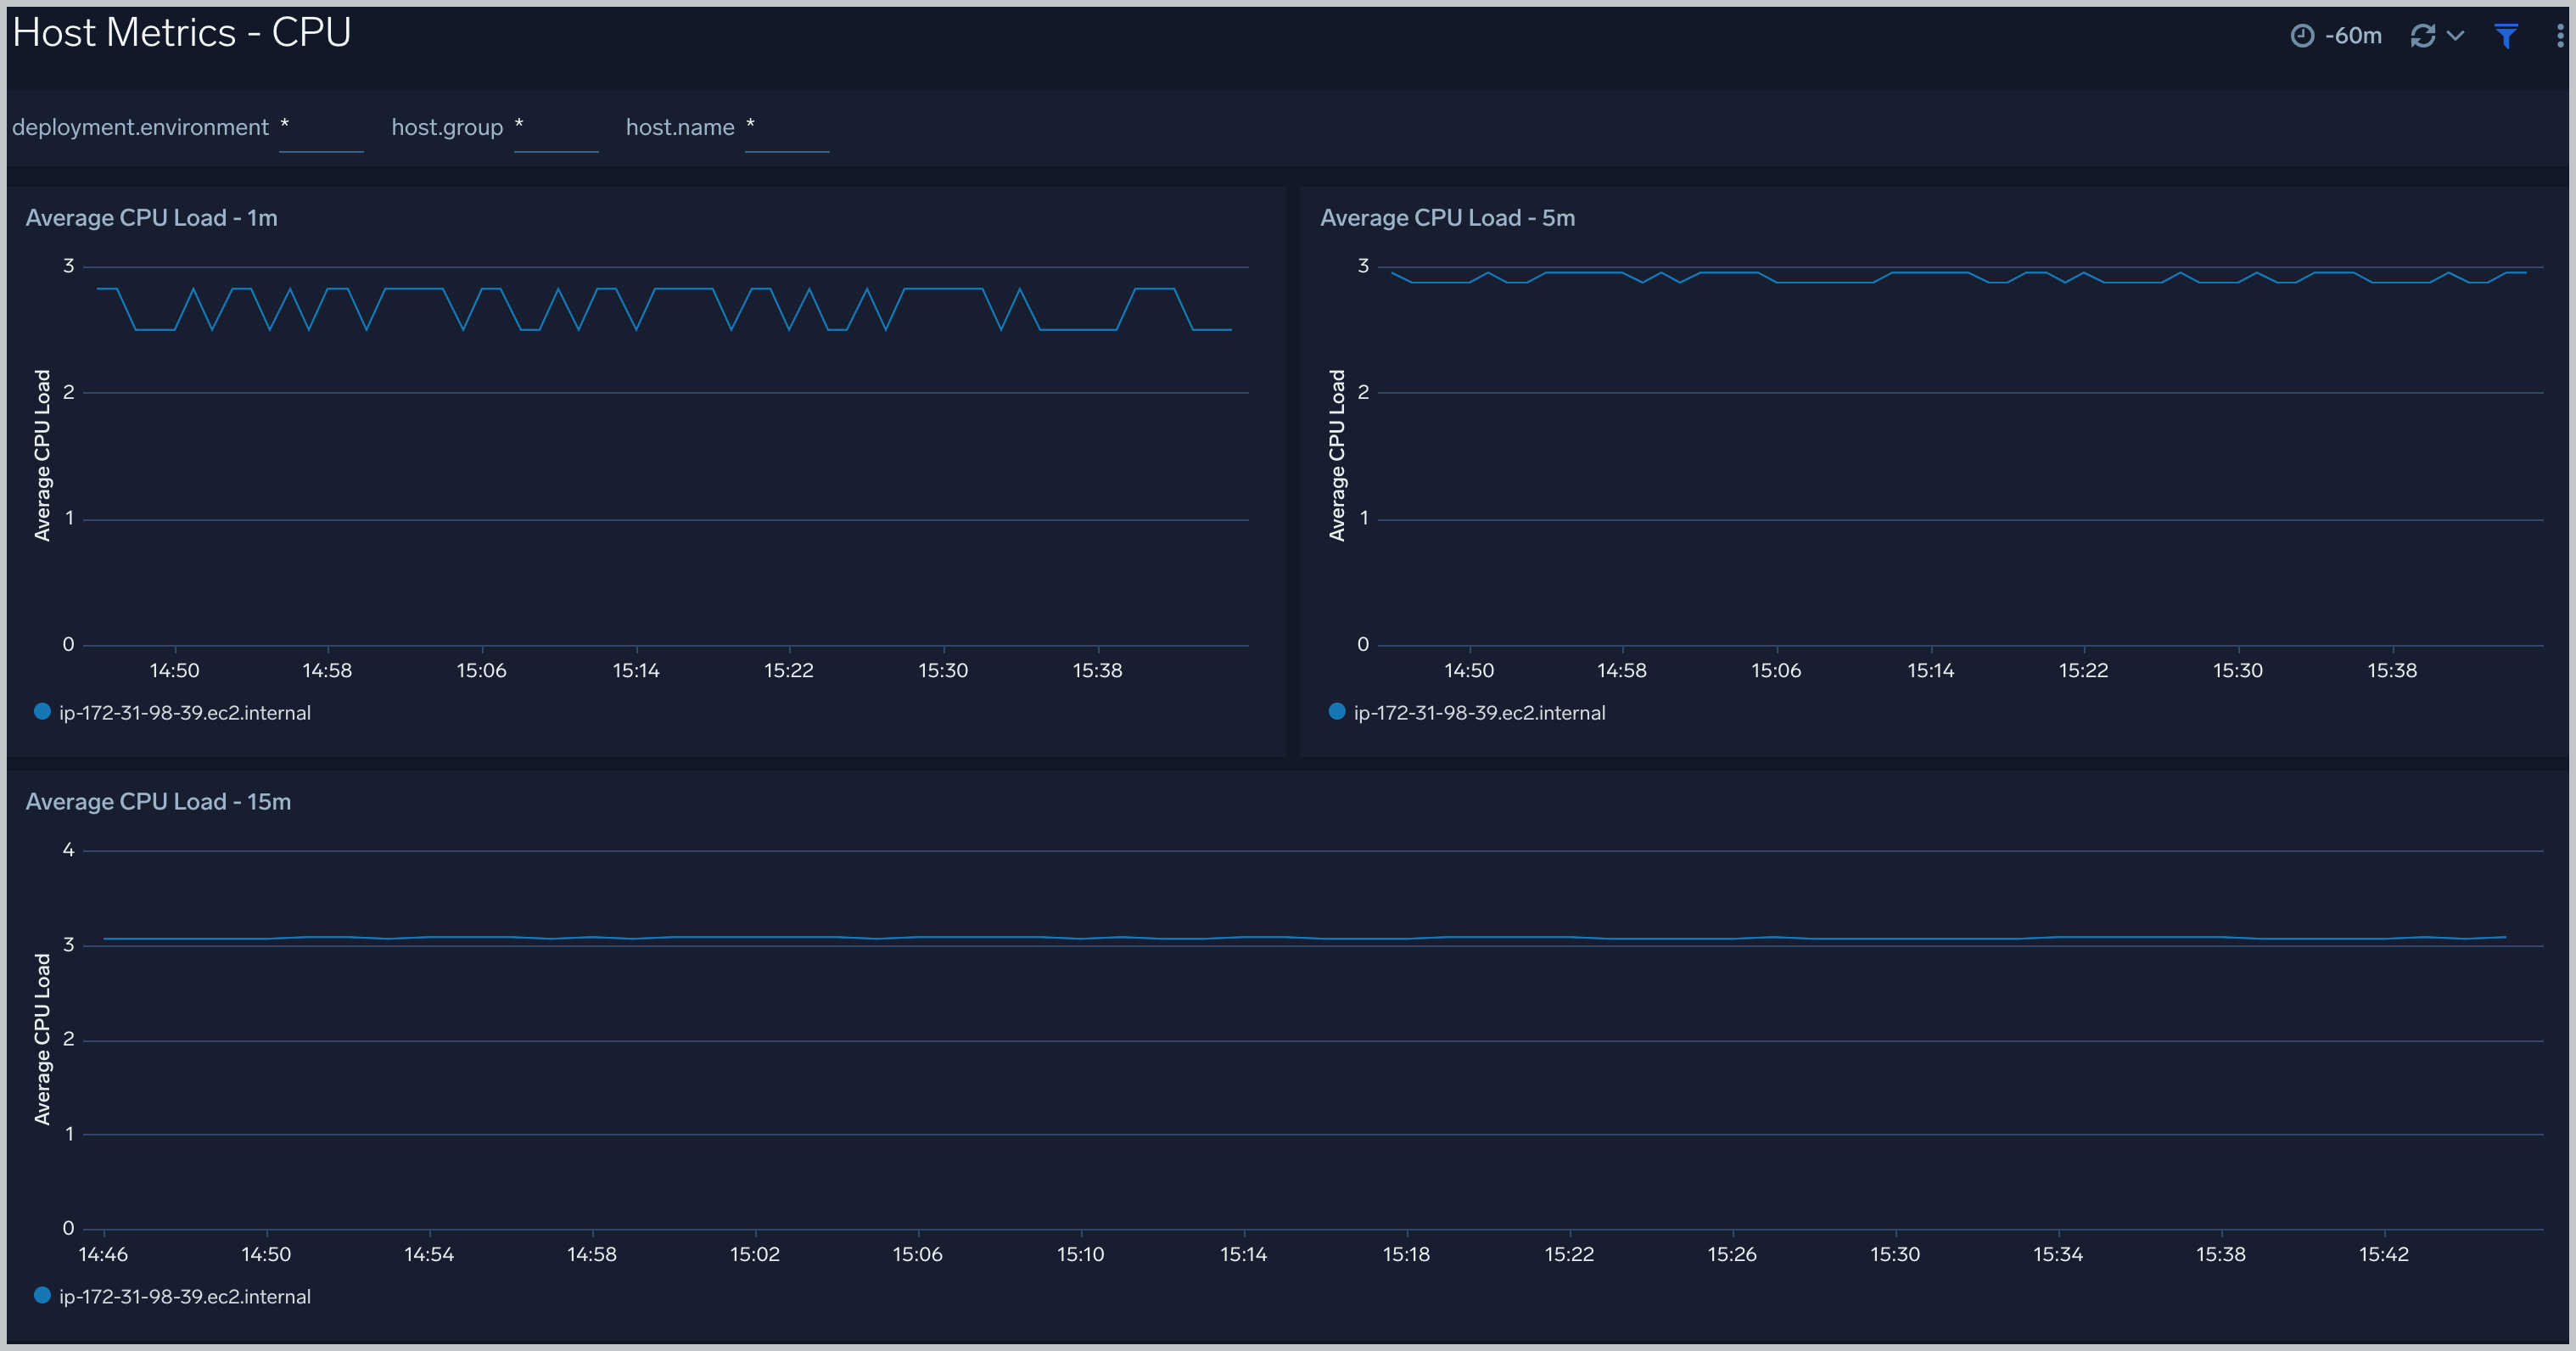
### Host Metrics - CPU
The **Host Metrics - CPU** dashboard provides the metric over time for CPU load. Use this dashboard to identify hosts and processes with high CPU utilization.
 ### Host Metrics - Disk
The **Host Metrics - Disk** dashboard provides detailed information about file system metrics.
Use this dashboard to view:
- File system utilization over time.
- Devices by file system usage.
- Disk used by host.
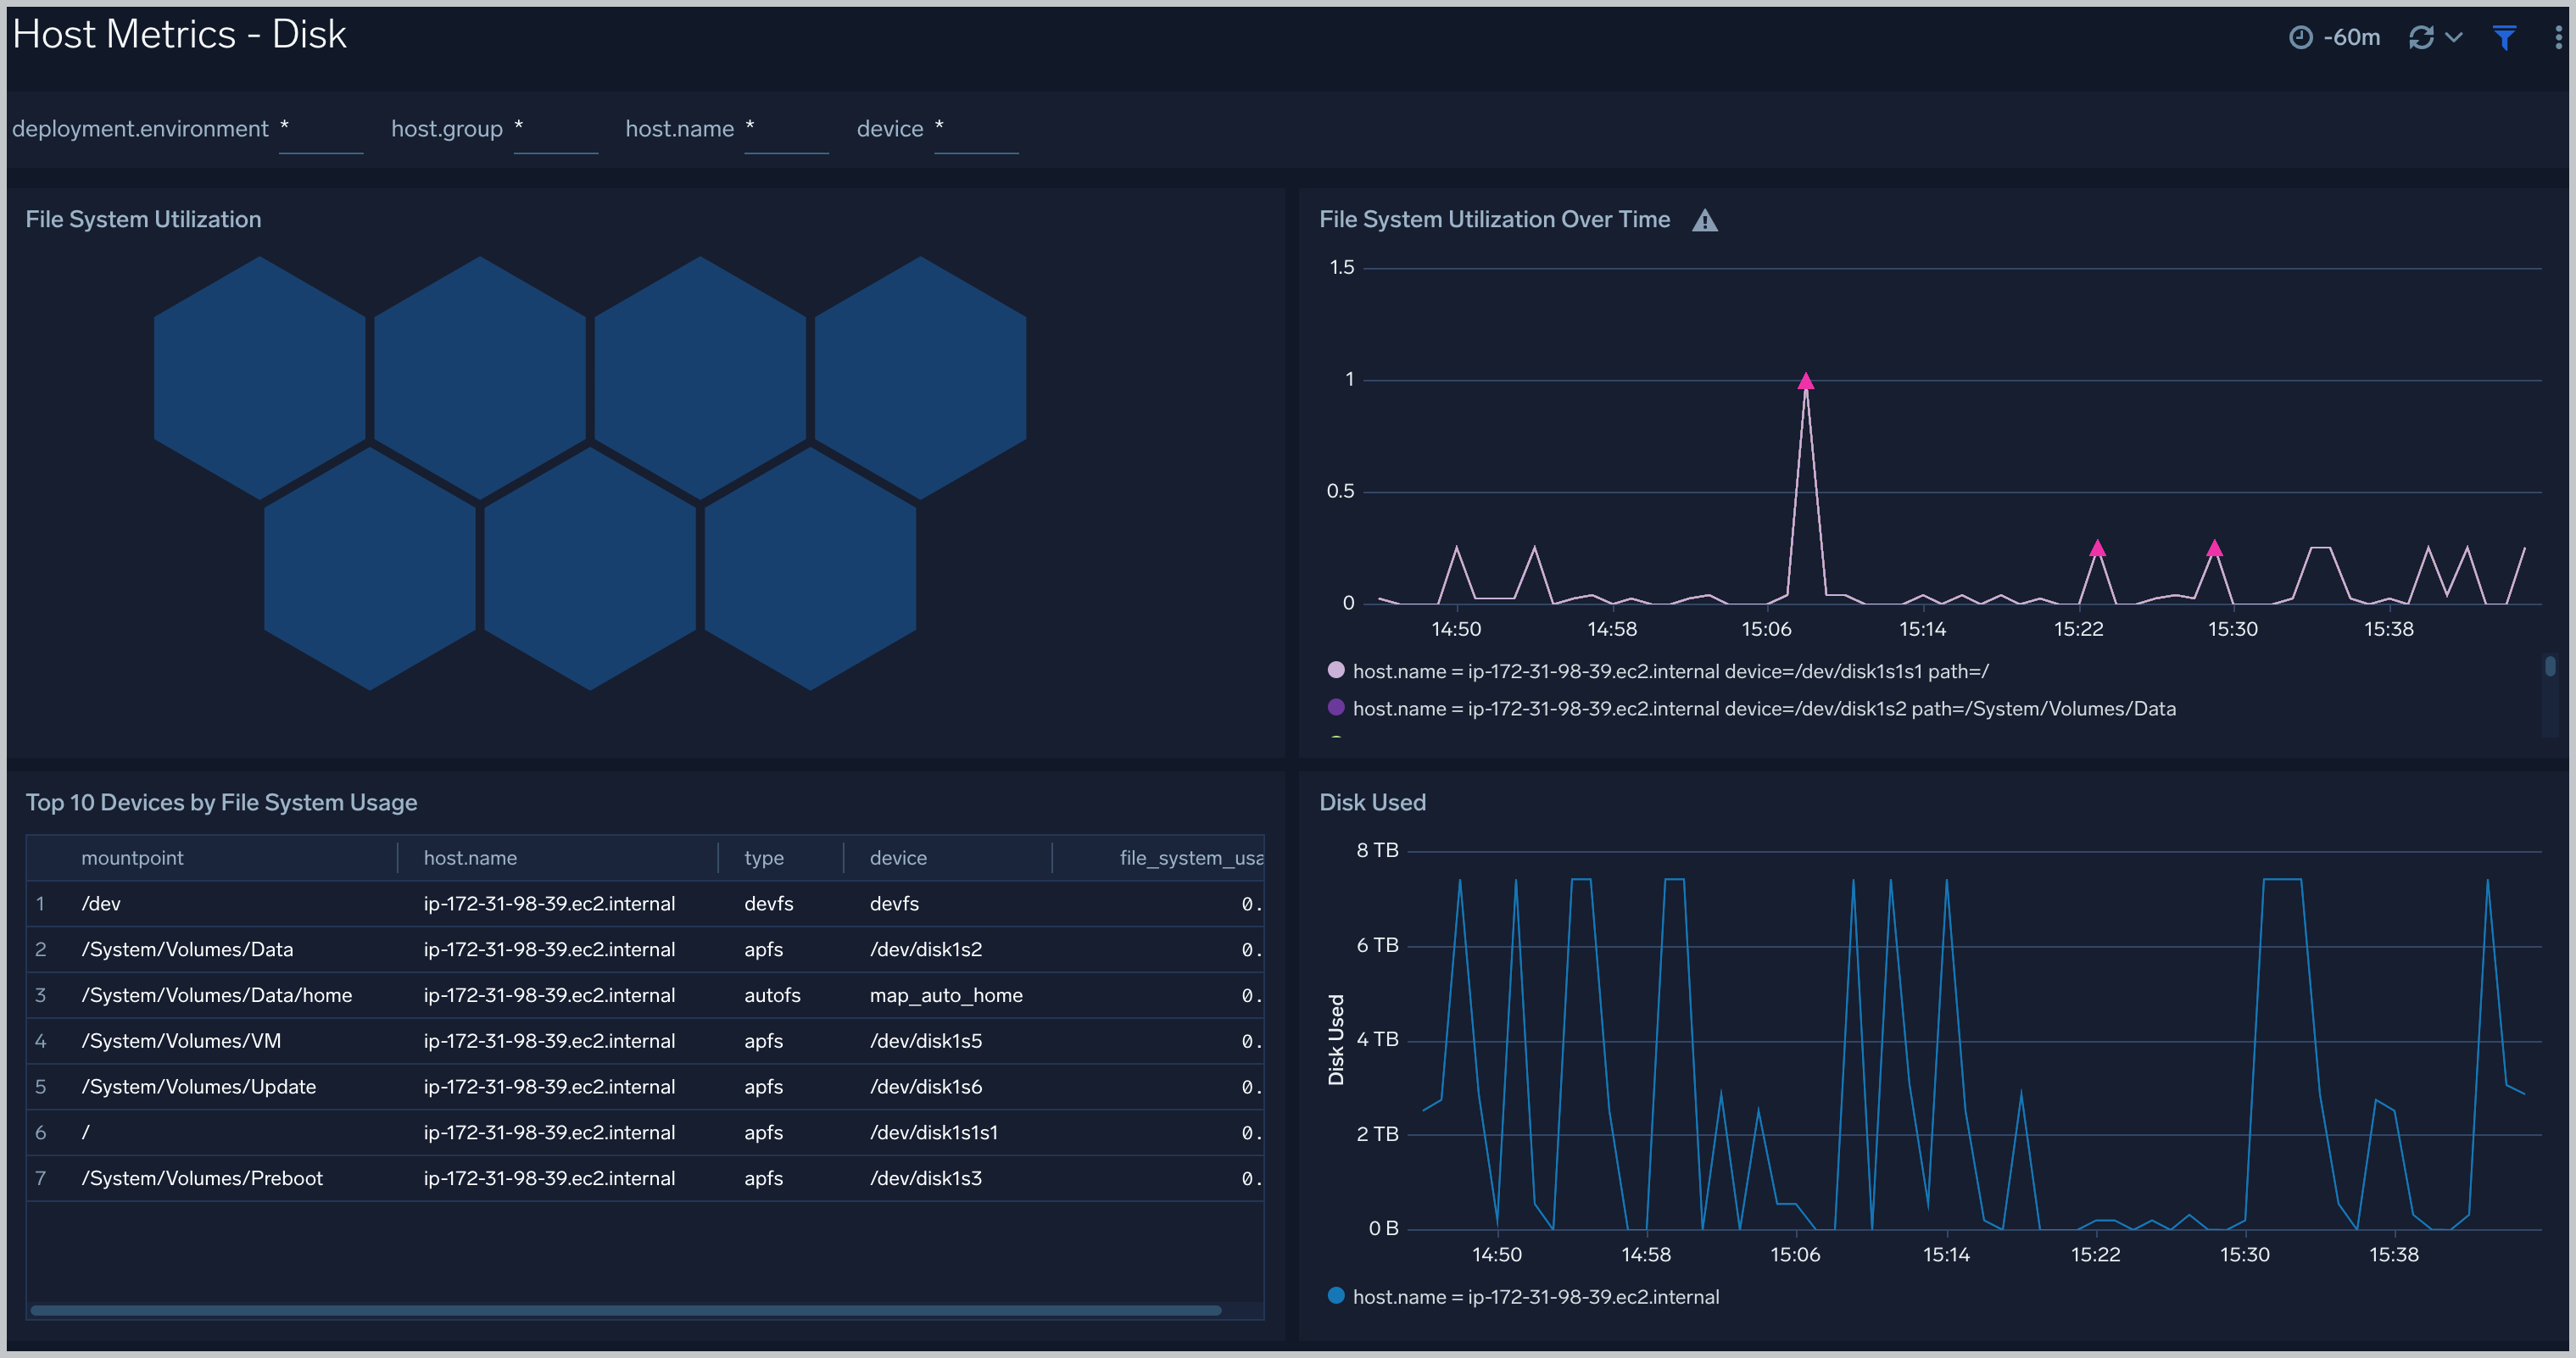
### Host Metrics - Disk
The **Host Metrics - Disk** dashboard provides detailed information about file system metrics.
Use this dashboard to view:
- File system utilization over time.
- Devices by file system usage.
- Disk used by host.
 ### Host Metrics - Memory
The **Host Metrics - Memory** dashboard provides detailed information on host memory usage, memory distribution, and used free and Inactive memory.
Use this dashboard to:
- Identify hosts with high memory utilization.
- Examine memory distribution (free, used) for a given host.
- Total free used and inactive memory.
### Host Metrics - Memory
The **Host Metrics - Memory** dashboard provides detailed information on host memory usage, memory distribution, and used free and Inactive memory.
Use this dashboard to:
- Identify hosts with high memory utilization.
- Examine memory distribution (free, used) for a given host.
- Total free used and inactive memory.
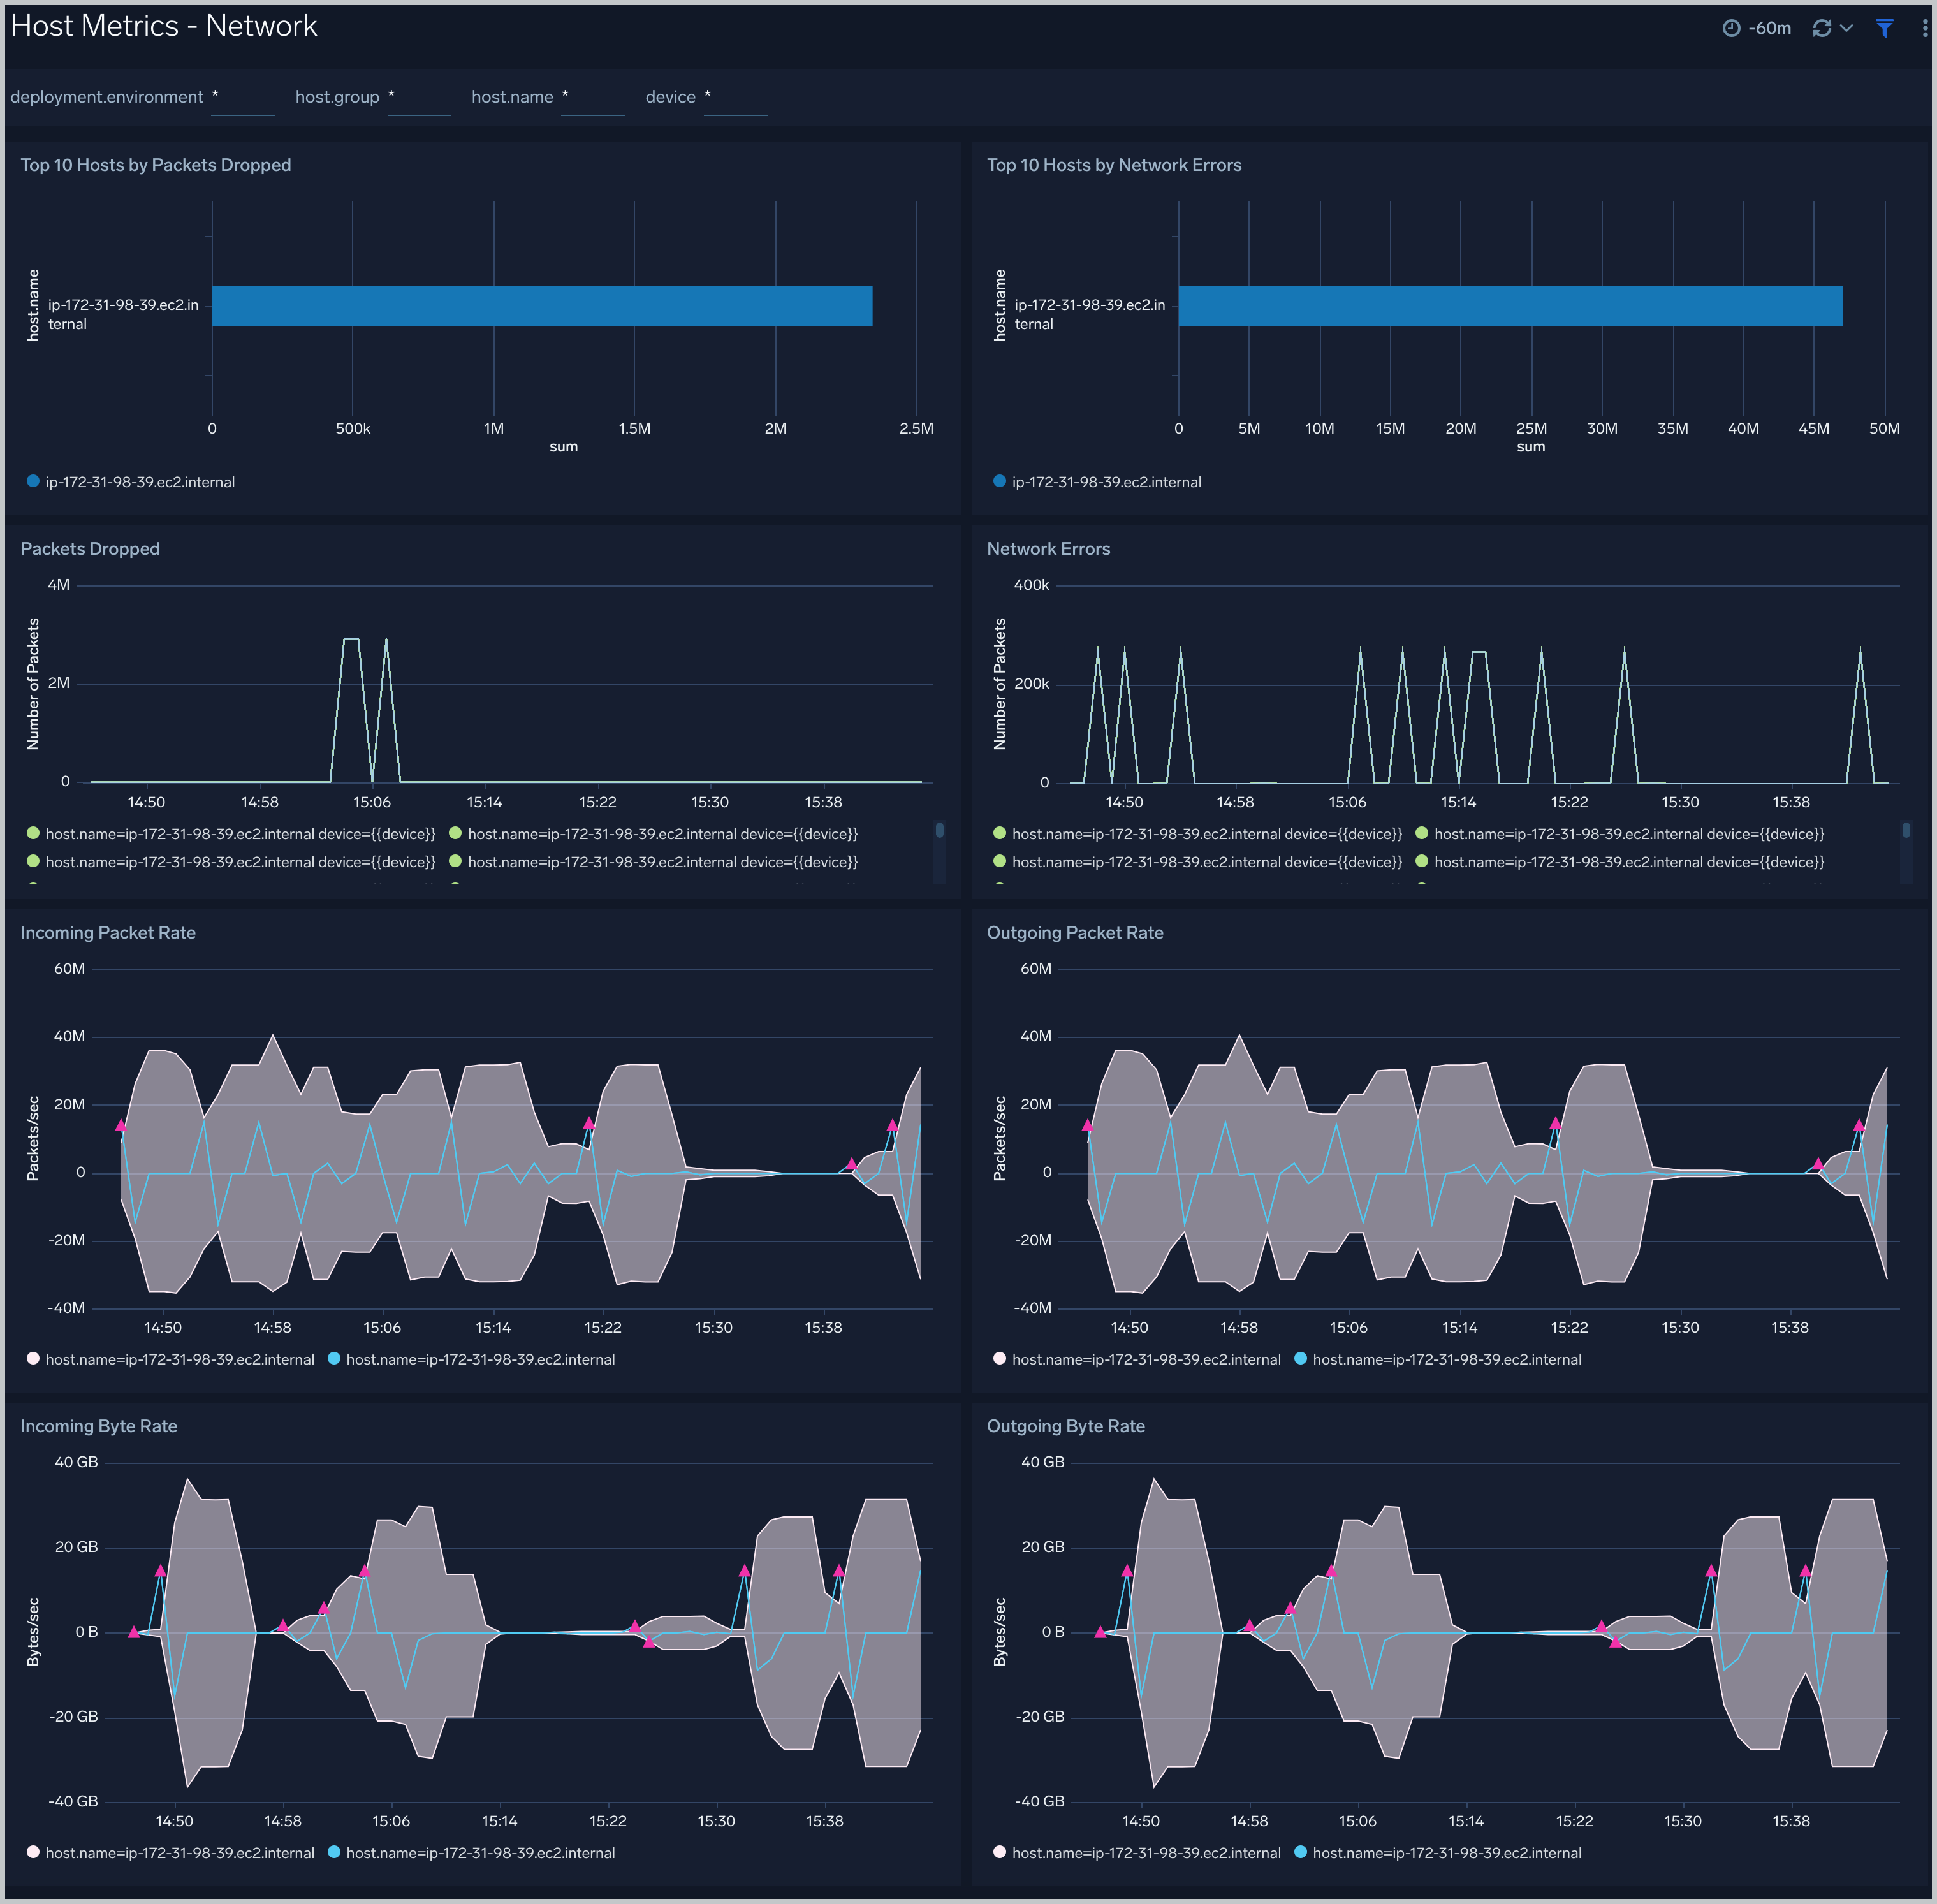 ### Host Metrics - Network
The **Host Metrics - Network** dashboard provides detailed information on host network errors, throughput, and packets sent and received.
Use this dashboard to:
- Determine top hosts with network errors and dropped packets.
- Monitor abnormal spikes in incoming/outgoing packets and bytes sent and received.
- Use dashboard filters to compare throughput across the interface of a host.
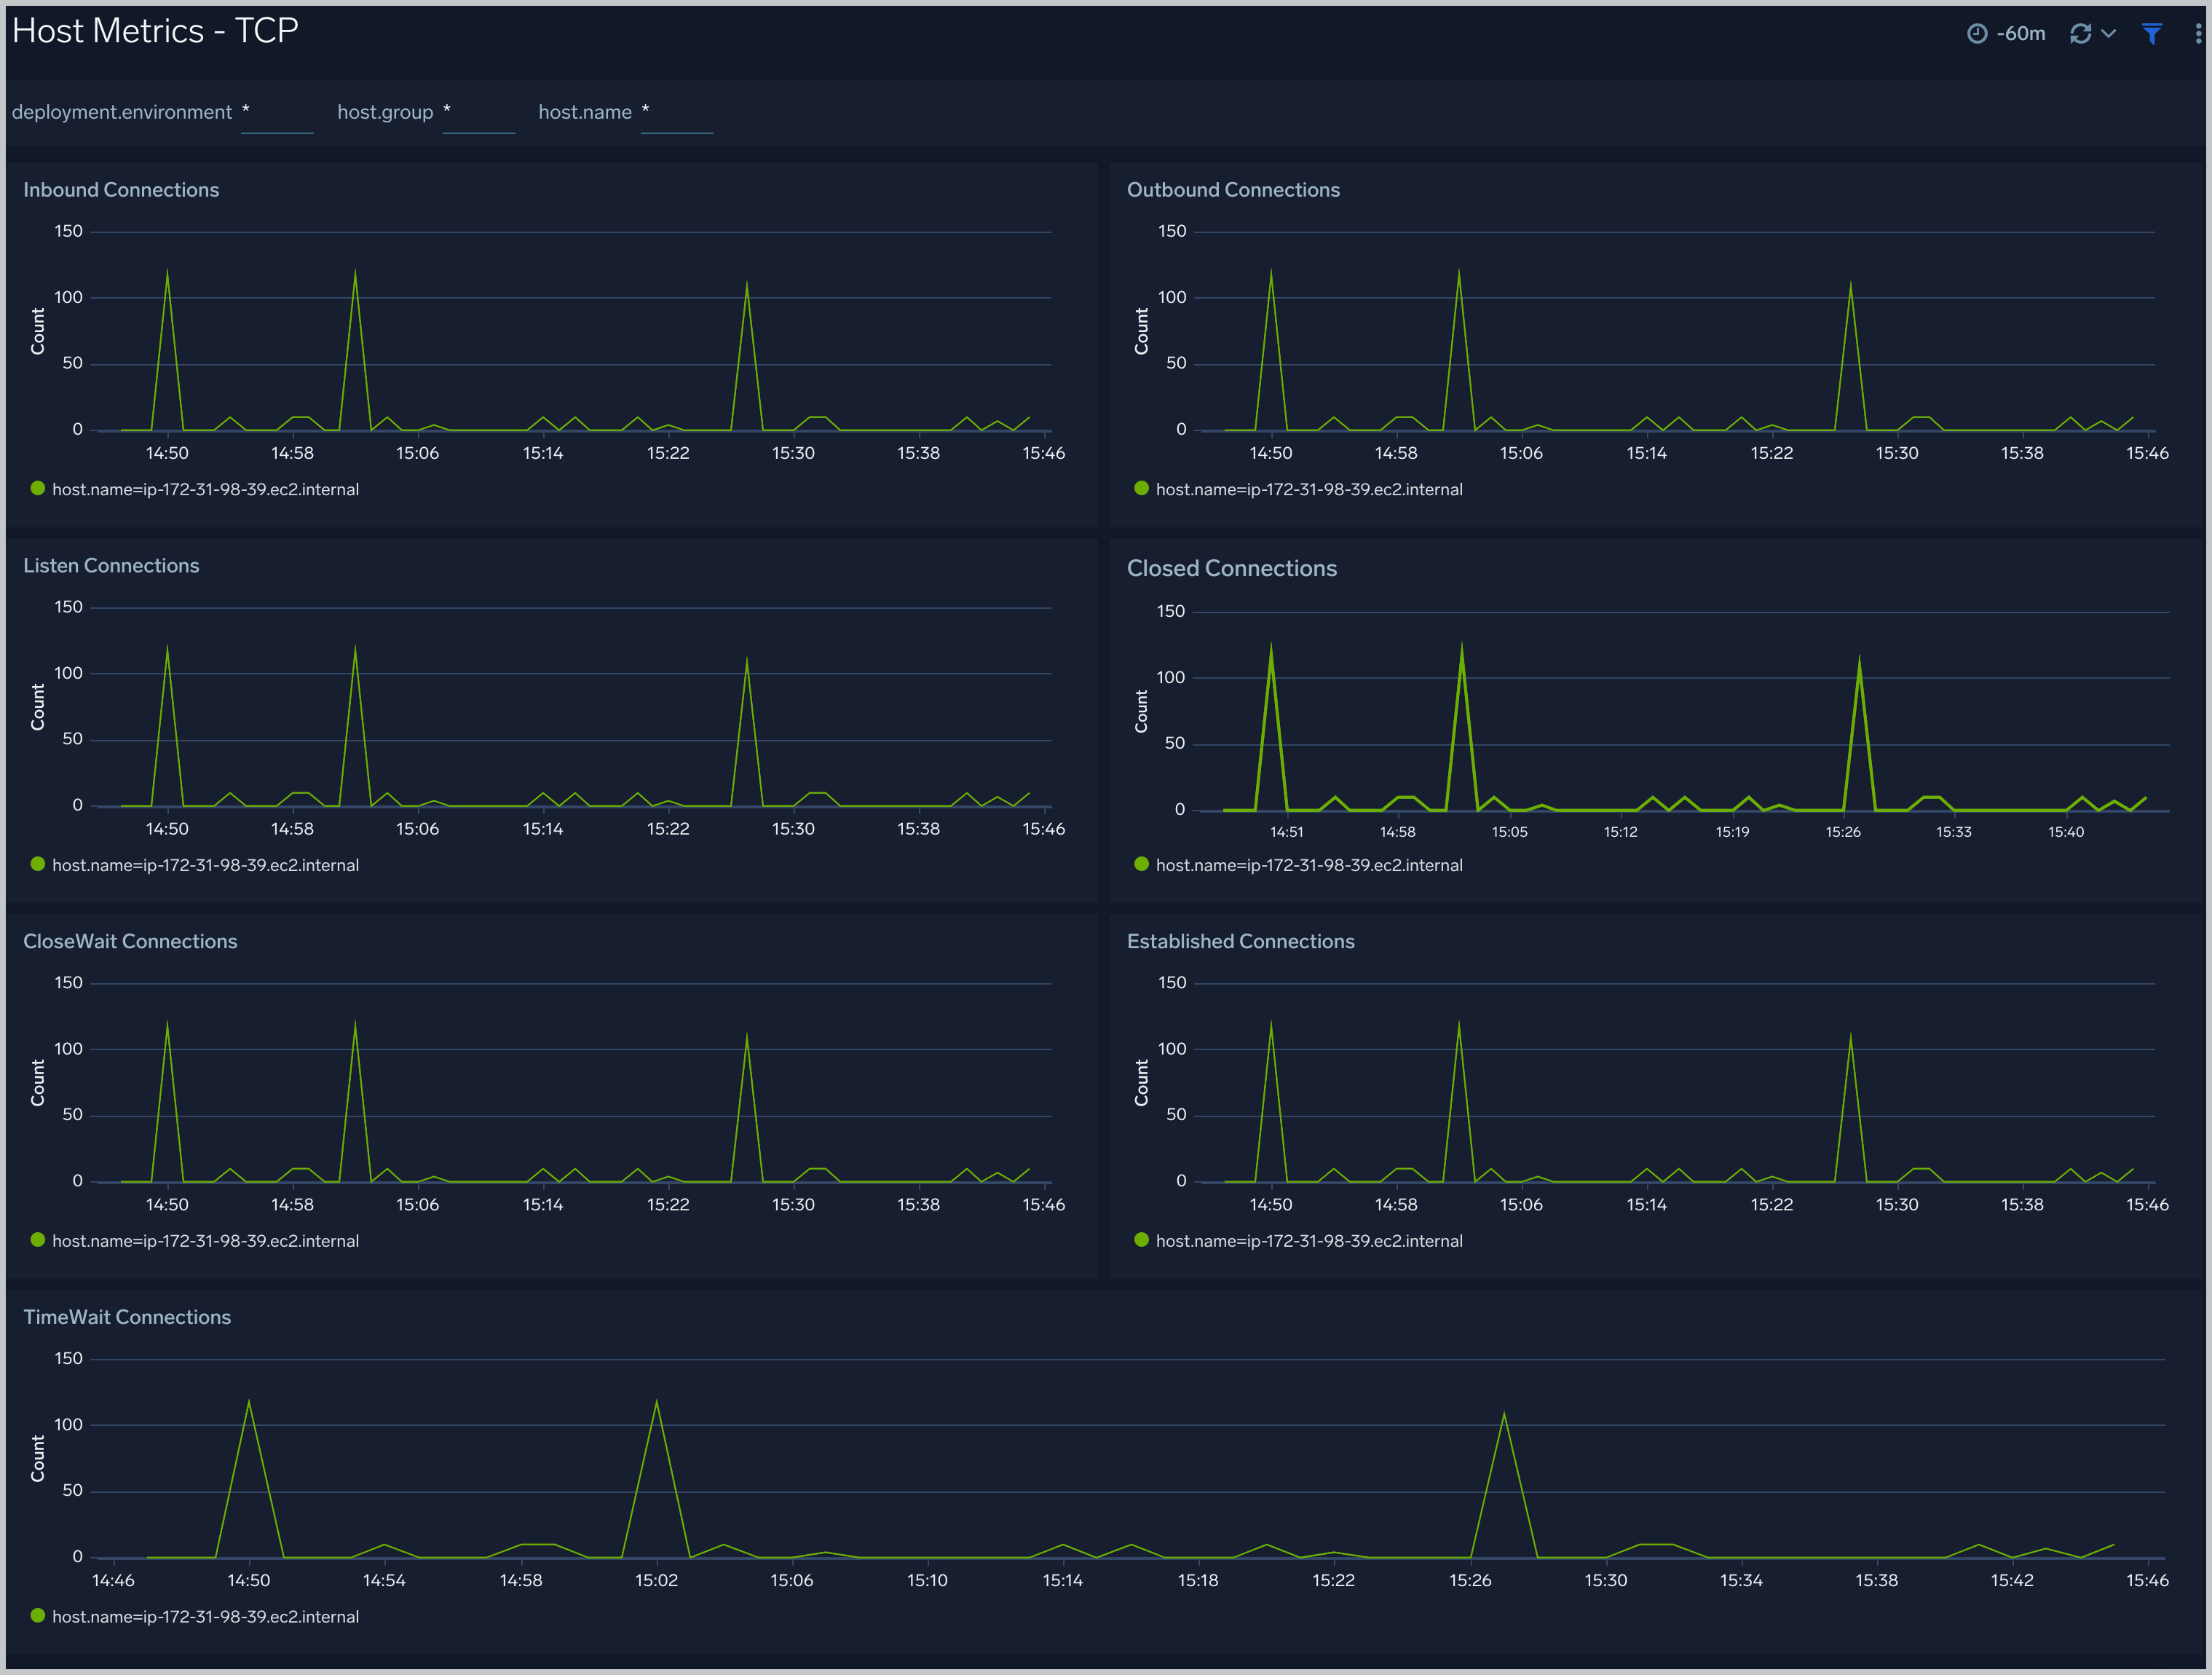
### Host Metrics - TCP
The **Host Metrics - TCP** dashboard provides detailed information about inbound, outbound, open, and established TCP connections.
Use this dashboard to:
- Identify abnormal spikes in inbound, outbound, open, or established connections.
### Host Metrics - Network
The **Host Metrics - Network** dashboard provides detailed information on host network errors, throughput, and packets sent and received.
Use this dashboard to:
- Determine top hosts with network errors and dropped packets.
- Monitor abnormal spikes in incoming/outgoing packets and bytes sent and received.
- Use dashboard filters to compare throughput across the interface of a host.
### Host Metrics - TCP
The **Host Metrics - TCP** dashboard provides detailed information about inbound, outbound, open, and established TCP connections.
Use this dashboard to:
- Identify abnormal spikes in inbound, outbound, open, or established connections.
 ## Create monitors for macOS app
import CreateMonitors from '../../../reuse/apps/create-monitors.md';
### macOS alerts
| Alert Name | Alert Description and conditions | Alert Condition | Recover Condition |
|:--|:--|:--|:--|
| `Metrics Mac - High FileSystem Utilization Alert` | This alert gets triggered when filesystem utilization exceeds threshold. | Count > 80 | Count < = 80 |
| `Mac - High Memory Utilization Alert` | This alert gets triggered when memory utilization exceeds threshold. | Count > 80 | Count < = 80 |
## Create monitors for macOS app
import CreateMonitors from '../../../reuse/apps/create-monitors.md';
### macOS alerts
| Alert Name | Alert Description and conditions | Alert Condition | Recover Condition |
|:--|:--|:--|:--|
| `Metrics Mac - High FileSystem Utilization Alert` | This alert gets triggered when filesystem utilization exceeds threshold. | Count > 80 | Count < = 80 |
| `Mac - High Memory Utilization Alert` | This alert gets triggered when memory utilization exceeds threshold. | Count > 80 | Count < = 80 |