---
id: active-directory-json-opentelemetry
title: Active Directory JSON - OpenTelemetry Collector
sidebar_label: Active Directory JSON - OTel Collector
description: Learn about the Sumo Logic OpenTelemetry app for Active Directory JSON.
slug: /help/docs/integrations/microsoft-azure/opentelemetry/active-directory-json-opentelemetry/
canonical: https://www.sumologic.com/help/docs/integrations/microsoft-azure/opentelemetry/active-directory-json-opentelemetry/
---
import useBaseUrl from '@docusaurus/useBaseUrl';
import Tabs from '@theme/Tabs';
import TabItem from '@theme/TabItem';
})
}) The [Active Directory](https://learn.microsoft.com/en-us/windows-server/identity/ad-ds/get-started/virtual-dc/active-directory-domain-services-overview) JSON app helps you monitor your Windows Active Directory deployment by analyzing Active Directory logs in the JSON-based event log format. The app includes predefined searches and dashboards that provide user activity in your environment for real-time analysis of overall usage.
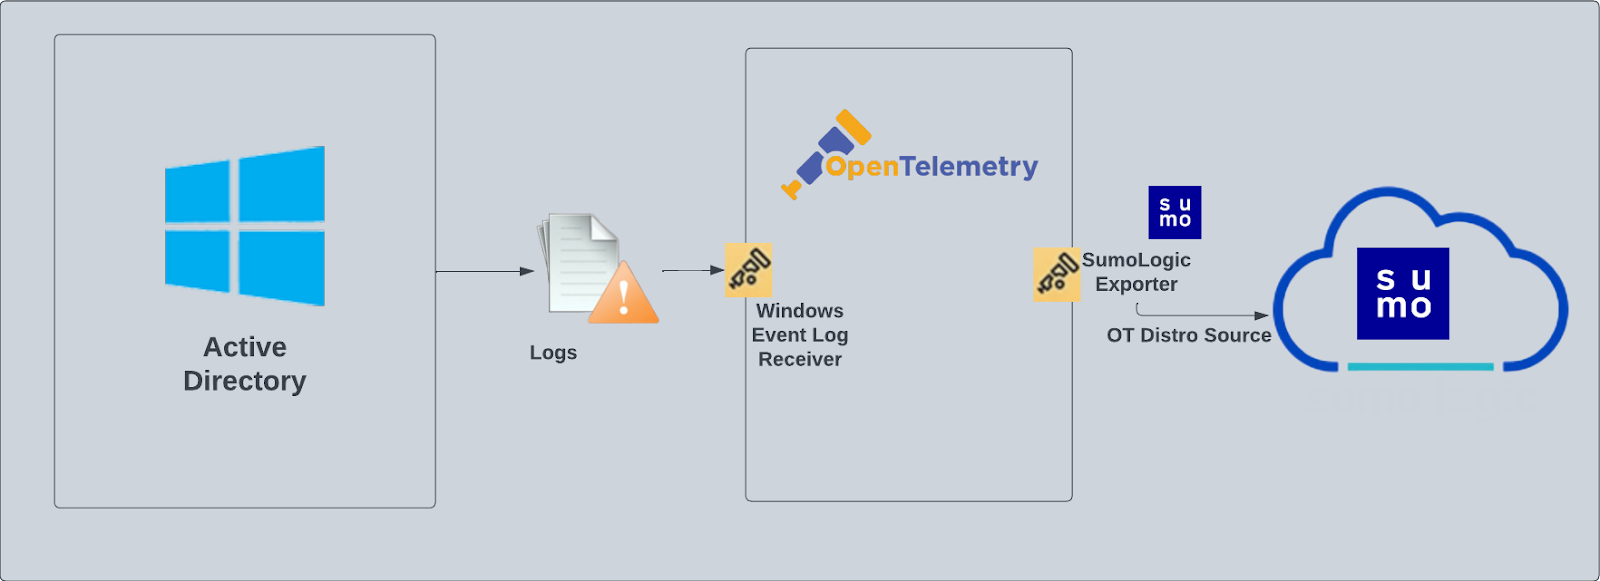
We recommend using the Active Directory JSON app in combination with the Windows JSON app. Active Directory logs are sent to Sumo Logic through OpenTelemetry [windowseventlogreceiver](https://github.com/open-telemetry/opentelemetry-collector-contrib/tree/main/receiver/windowseventlogreceiver).
The [Active Directory](https://learn.microsoft.com/en-us/windows-server/identity/ad-ds/get-started/virtual-dc/active-directory-domain-services-overview) JSON app helps you monitor your Windows Active Directory deployment by analyzing Active Directory logs in the JSON-based event log format. The app includes predefined searches and dashboards that provide user activity in your environment for real-time analysis of overall usage.
We recommend using the Active Directory JSON app in combination with the Windows JSON app. Active Directory logs are sent to Sumo Logic through OpenTelemetry [windowseventlogreceiver](https://github.com/open-telemetry/opentelemetry-collector-contrib/tree/main/receiver/windowseventlogreceiver).
 :::info
This app includes [built-in monitors](#active-directory-alerts). For details on creating custom monitors, refer to the [Create monitors for Active Directory app](#create-monitors-for-active-directory-app).
:::
## Fields creation in Sumo Logic for Active Directory
The following are the [fields](/docs/manage/fields/) which will be created as part of the Active Directory App install if not already present.
**`sumo.datasource`** - Has fixed value of **activeDirectory**.
### Event logs used by Active Directory app
This section provides instructions for configuring log collection for Active Directory running on a non-Kubernetes environment for the Sumo Logic app for Active Directory. Tails and parses logs from Windows event log API are collected using the [opentelemetry-log-collection](https://github.com/open-telemetry/opentelemetry-log-collection) library.
#### Log types
Standard Windows event channels include:
- **Security**
- **System**
- **Application**
## Collection configuration and app installation
:::note
You can skip this section if you have already set up the logs collection through [Windows PCI](/docs/integrations/pci-compliance/opentelemetry/windows-json-opentelemetry), [Windows - Cloud Security Monitoring and Analytics](/docs/integrations/cloud-security-monitoring-analytics/opentelemetry/windows-opentelemetry), or [Windows](/docs/integrations/hosts-operating-systems/opentelemetry/windows-opentelemetry) app installation. Additional collection is not required as the logs used by this app are already ingested into Sumo Logic.
:::
import ConfigAppInstall from '../../../reuse/apps/opentelemetry/config-app-install.md';
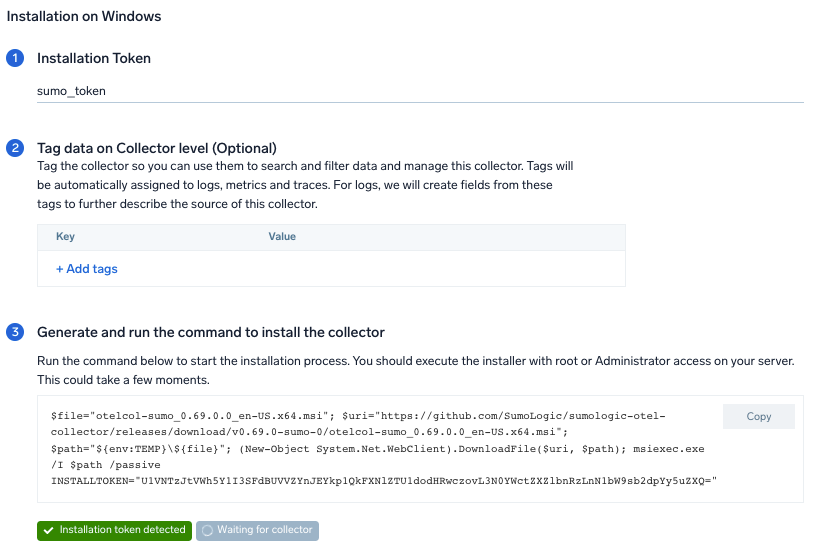
### Step 1: Set up Collector
import SetupColl from '../../../reuse/apps/opentelemetry/set-up-collector.md';
:::info
This app includes [built-in monitors](#active-directory-alerts). For details on creating custom monitors, refer to the [Create monitors for Active Directory app](#create-monitors-for-active-directory-app).
:::
## Fields creation in Sumo Logic for Active Directory
The following are the [fields](/docs/manage/fields/) which will be created as part of the Active Directory App install if not already present.
**`sumo.datasource`** - Has fixed value of **activeDirectory**.
### Event logs used by Active Directory app
This section provides instructions for configuring log collection for Active Directory running on a non-Kubernetes environment for the Sumo Logic app for Active Directory. Tails and parses logs from Windows event log API are collected using the [opentelemetry-log-collection](https://github.com/open-telemetry/opentelemetry-log-collection) library.
#### Log types
Standard Windows event channels include:
- **Security**
- **System**
- **Application**
## Collection configuration and app installation
:::note
You can skip this section if you have already set up the logs collection through [Windows PCI](/docs/integrations/pci-compliance/opentelemetry/windows-json-opentelemetry), [Windows - Cloud Security Monitoring and Analytics](/docs/integrations/cloud-security-monitoring-analytics/opentelemetry/windows-opentelemetry), or [Windows](/docs/integrations/hosts-operating-systems/opentelemetry/windows-opentelemetry) app installation. Additional collection is not required as the logs used by this app are already ingested into Sumo Logic.
:::
import ConfigAppInstall from '../../../reuse/apps/opentelemetry/config-app-install.md';
### Step 1: Set up Collector
import SetupColl from '../../../reuse/apps/opentelemetry/set-up-collector.md';
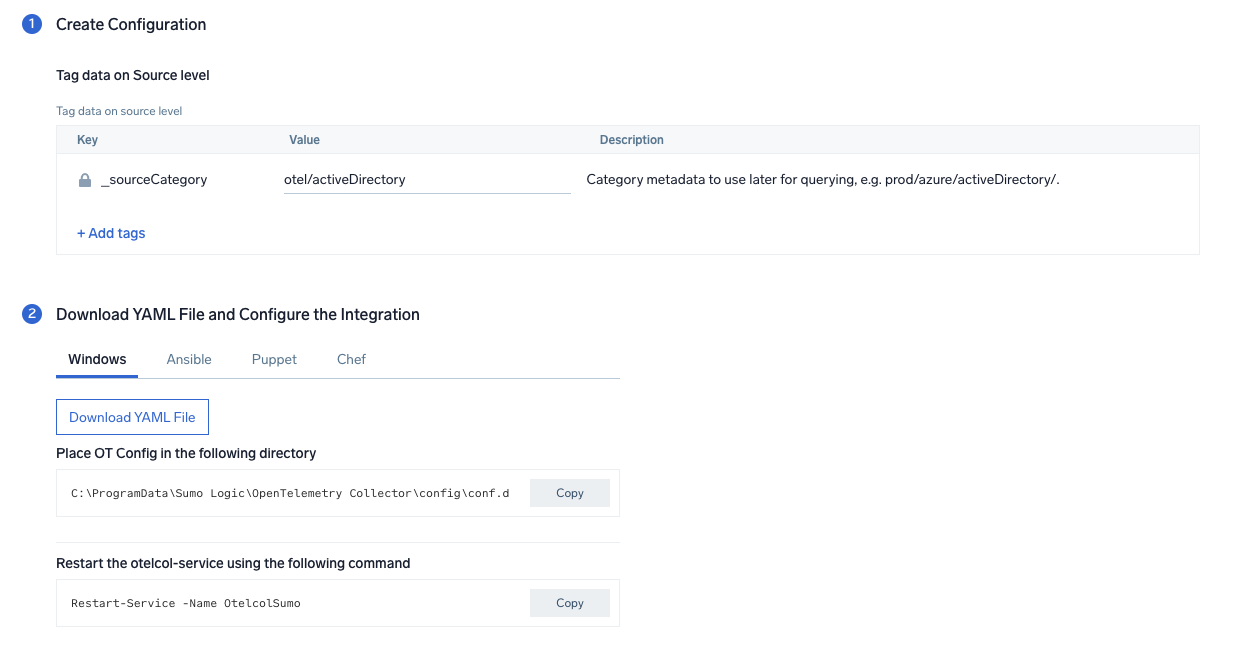
 ### Step 2: Configure Integration
In this step, we will configure the YAML required for Active Directory Collection.
You can add any custom fields that you want to tag along with the data ingested in Sumo.
Click on the **Download YAML File** button to get the YAML file.
import CollectorVersionNote from '../../../reuse/apps/opentelemetry/collector-version-note.md';
### Step 2: Configure Integration
In this step, we will configure the YAML required for Active Directory Collection.
You can add any custom fields that you want to tag along with the data ingested in Sumo.
Click on the **Download YAML File** button to get the YAML file.
import CollectorVersionNote from '../../../reuse/apps/opentelemetry/collector-version-note.md';
 ### Step 3: Send logs to Sumo Logic
import LogsIntro from '../../../reuse/apps/opentelemetry/send-logs-intro.md';
1. Copy the YAML at `C:\ProgramData\Sumo Logic\OpenTelemetry Collector\config\conf.d` folder in the machine that needs to be monitored.
2. Restart the collector using the command `Restart-Service -Name`.
import ChefNoEnv from '../../../reuse/apps/opentelemetry/chef-without-env.md';
import AnsibleNoEnv from '../../../reuse/apps/opentelemetry/ansible-without-env.md';
import PuppetNoEnv from '../../../reuse/apps/opentelemetry/puppet-without-env.md';
import LogsOutro from '../../../reuse/apps/opentelemetry/send-logs-outro.md';
## Sample log messages
```sql
{
record_id:"121139",
channel:"Security",
event_data:"S-1-0-0
-
-
0x0
S-1-0-0
TS
0xc000006d
%%2313
0xc0000064
3
NtLmSsp
NTLM
-
-
-
0
0x0
-
9.204.254.156\
0",
task:"Logon",
provider:"{\"event_source\":\"\",\"name\":\"Microsoft-Windows-Security-Auditing\",\"guid\":\"{54849625-5478-4994-a5ba-3e3b0328c30d}\"}",
system_time:"2023-01-16T08:53:57+0000664Z",
computer:"EC2AMAZ-T30T53R",
opcode:"Info",
keywords:"Audit Failure",
details:"{\"Account For Which Logon Failed\":\"\",\"Network Information\":\"\",\"Failure Information\":\"\",\"Detailed Authentication Information\":\"\",\"Subject\":\"\",\"Process Information\":\"\",\"Logon Type\":\"3\",\"Additional Context\":\"\"}",
message:"An account failed to log on.",
event_id:"{\"qualifiers\":\"0\",\"id\":\"4625\"}",
level:"Information"
}
```
## Sample queries
This sample Query is from the Active Directory - Active Directory Service Activity > Top 10 Messages panel.
```sumo
%"sumo.datasource"=activeDirectory
| json "event_id", "computer", "message" as event_id, host, msg_summary nodrop
| parse regex field=msg_summary "(?.*\.*)" nodrop
| where host matches "*"
| count by msg_summary
| top 10 msg_summary by _count
```
## Viewing Active Directory dashboards
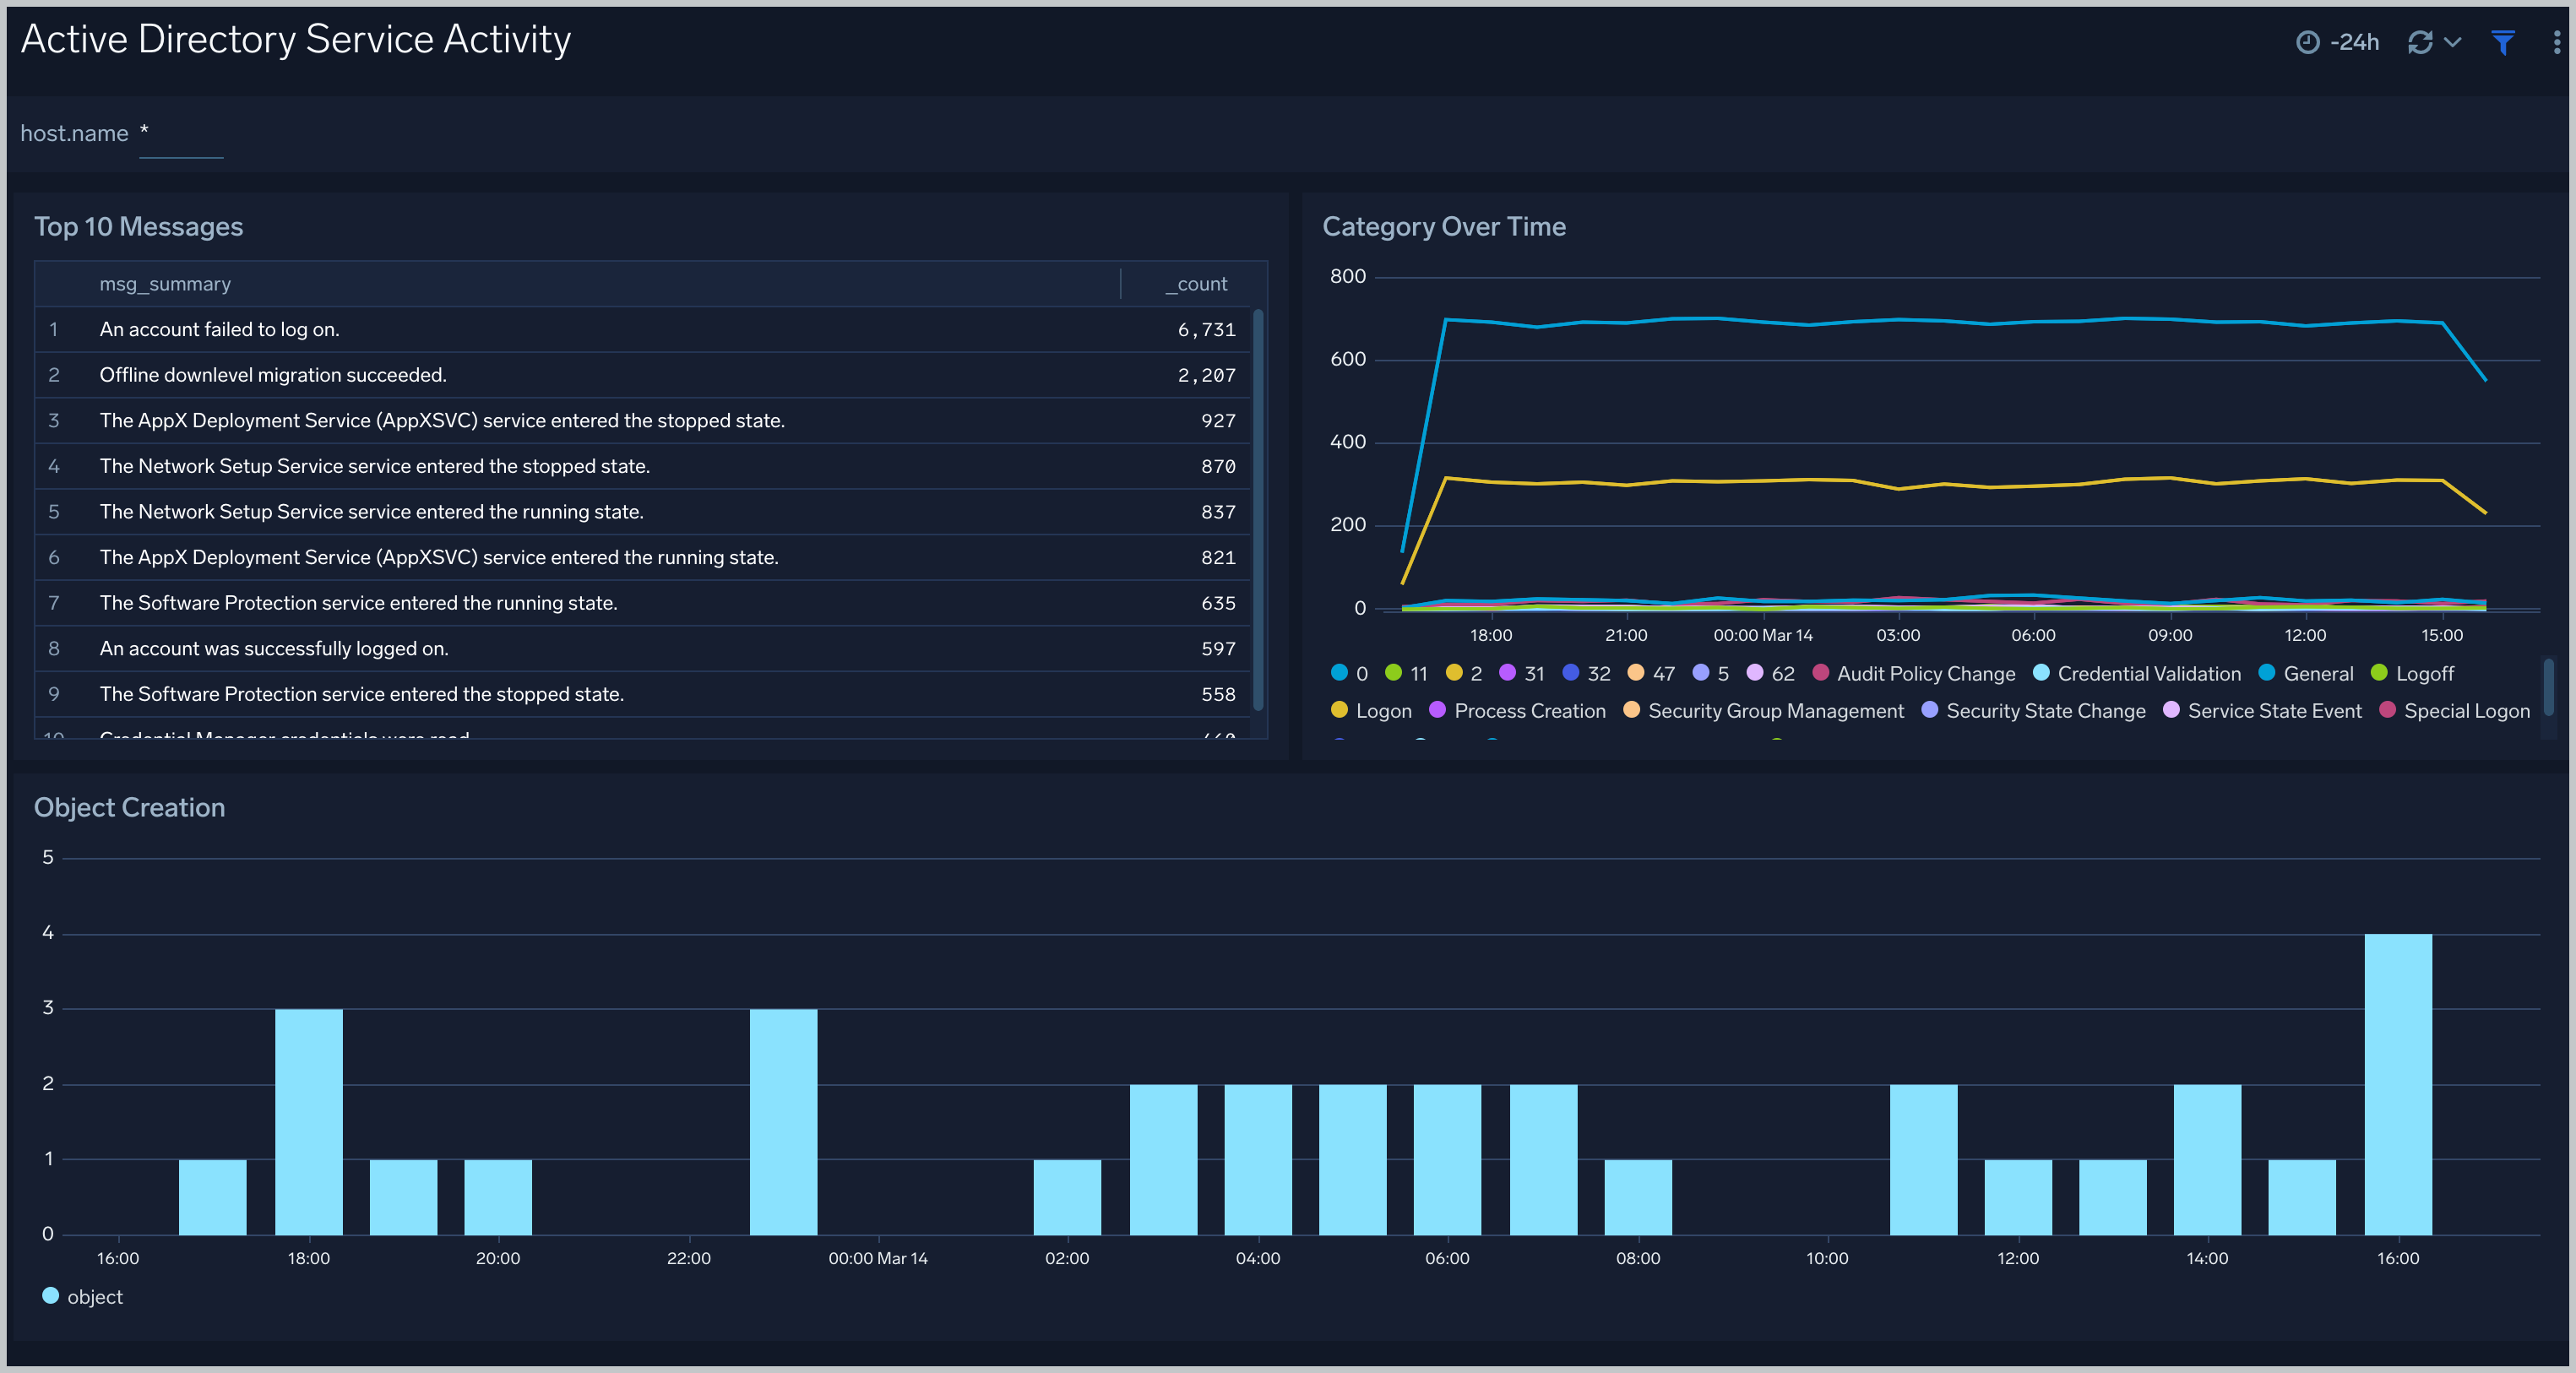
### Service Activity
The **Active Directory - Service Activity** dashboard provides insights into overall active directory services, like Category overtime, object creation, and top 10 messages.
### Step 3: Send logs to Sumo Logic
import LogsIntro from '../../../reuse/apps/opentelemetry/send-logs-intro.md';
1. Copy the YAML at `C:\ProgramData\Sumo Logic\OpenTelemetry Collector\config\conf.d` folder in the machine that needs to be monitored.
2. Restart the collector using the command `Restart-Service -Name`.
import ChefNoEnv from '../../../reuse/apps/opentelemetry/chef-without-env.md';
import AnsibleNoEnv from '../../../reuse/apps/opentelemetry/ansible-without-env.md';
import PuppetNoEnv from '../../../reuse/apps/opentelemetry/puppet-without-env.md';
import LogsOutro from '../../../reuse/apps/opentelemetry/send-logs-outro.md';
## Sample log messages
```sql
{
record_id:"121139",
channel:"Security",
event_data:"S-1-0-0
-
-
0x0
S-1-0-0
TS
0xc000006d
%%2313
0xc0000064
3
NtLmSsp
NTLM
-
-
-
0
0x0
-
9.204.254.156\
0",
task:"Logon",
provider:"{\"event_source\":\"\",\"name\":\"Microsoft-Windows-Security-Auditing\",\"guid\":\"{54849625-5478-4994-a5ba-3e3b0328c30d}\"}",
system_time:"2023-01-16T08:53:57+0000664Z",
computer:"EC2AMAZ-T30T53R",
opcode:"Info",
keywords:"Audit Failure",
details:"{\"Account For Which Logon Failed\":\"\",\"Network Information\":\"\",\"Failure Information\":\"\",\"Detailed Authentication Information\":\"\",\"Subject\":\"\",\"Process Information\":\"\",\"Logon Type\":\"3\",\"Additional Context\":\"\"}",
message:"An account failed to log on.",
event_id:"{\"qualifiers\":\"0\",\"id\":\"4625\"}",
level:"Information"
}
```
## Sample queries
This sample Query is from the Active Directory - Active Directory Service Activity > Top 10 Messages panel.
```sumo
%"sumo.datasource"=activeDirectory
| json "event_id", "computer", "message" as event_id, host, msg_summary nodrop
| parse regex field=msg_summary "(?.*\.*)" nodrop
| where host matches "*"
| count by msg_summary
| top 10 msg_summary by _count
```
## Viewing Active Directory dashboards
### Service Activity
The **Active Directory - Service Activity** dashboard provides insights into overall active directory services, like Category overtime, object creation, and top 10 messages.
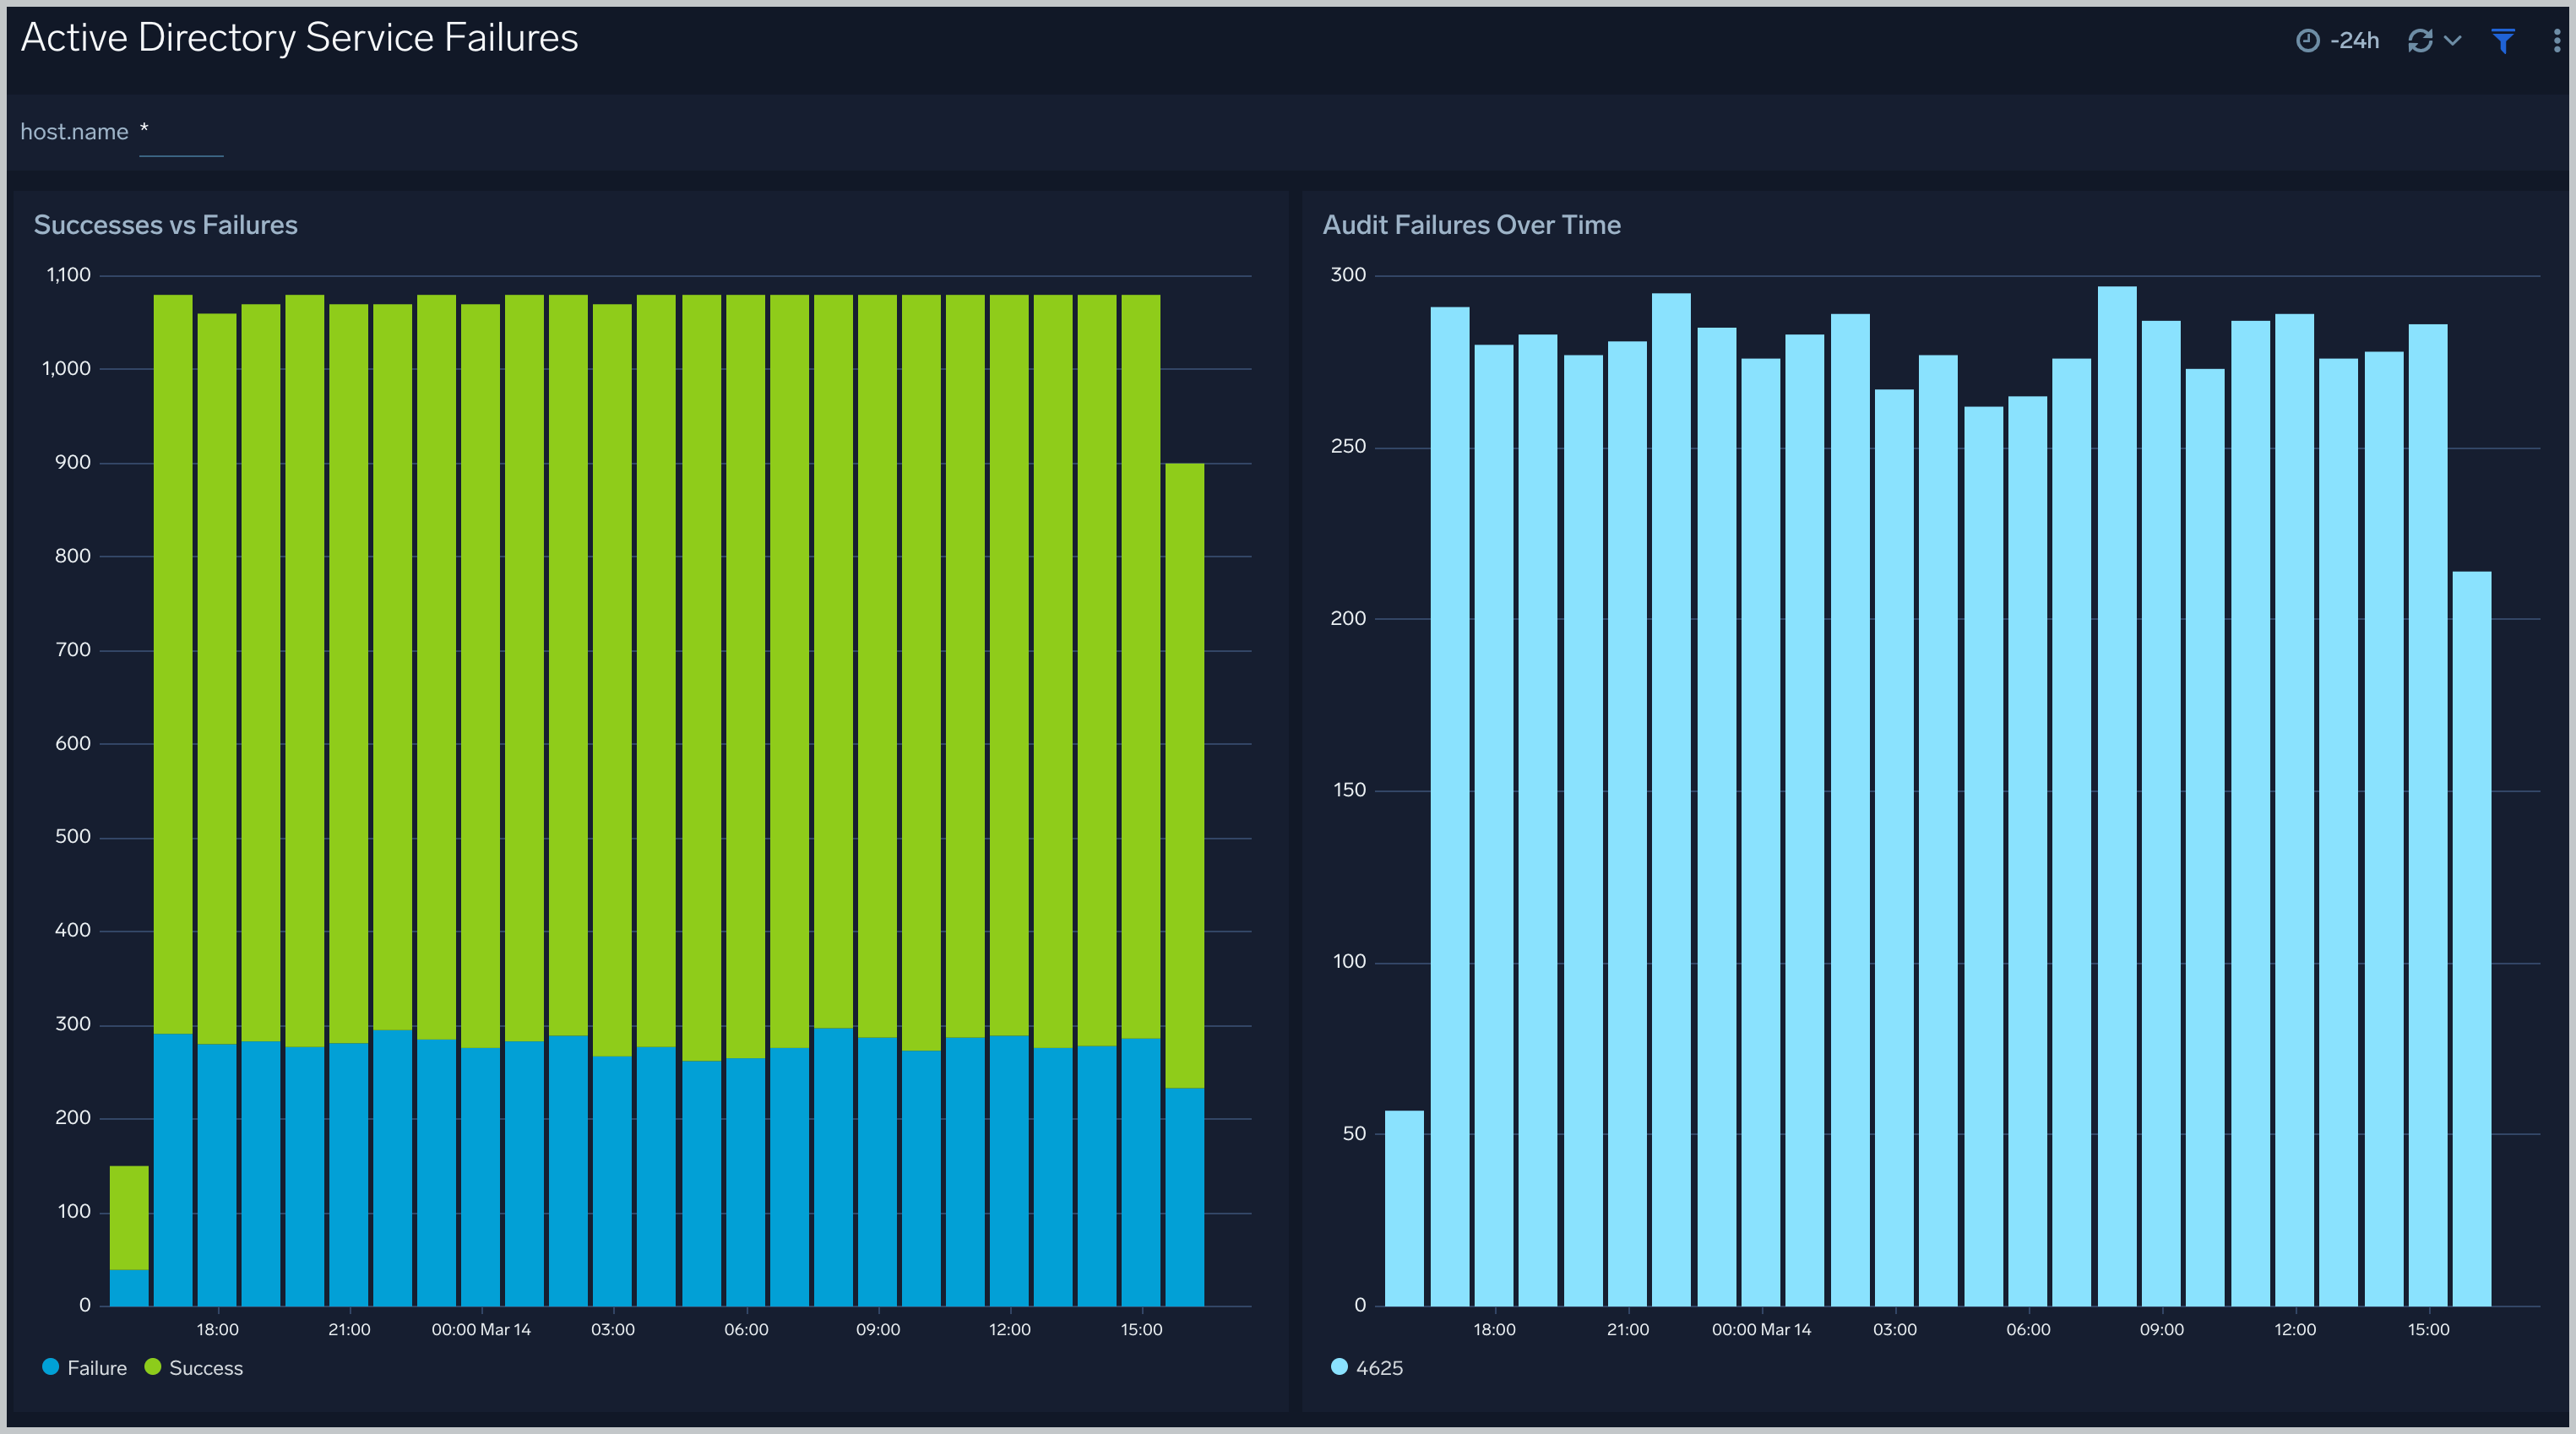
 ### Service Failures
The **Active Directory - Service Failures** dashboard provides an at-a-glance view of success, failures, and audit failures over time.
### Service Failures
The **Active Directory - Service Failures** dashboard provides an at-a-glance view of success, failures, and audit failures over time.
 ## Create monitors for Active Directory app
import CreateMonitors from '../../../reuse/apps/create-monitors.md';
### Active Directory alerts
| Name | Description | Alert Condition | Recover Condition |
|:--|:--|:--|:--|
| `Active Directory - Account Lockouts Spike` | This alert is triggered when there are multiple account lockouts in a short time period, indicating potential brute force attempts. | Count `>=` 5 | Count `<` 5 |
| `Active Directory - Directory Service Failures` | This alert is triggered when there are critical Directory Service failures that could impact AD functionality. | Count `>=` 3 | Count `<` 3 |
| `Active Directory - Mass User Account Deletions` | This alert triggers when multiple user accounts are deleted in a short time period, which could indicate malicious activity. | Count `>` 5 | Count `<=` 5 |
| `Active Directory - NTLM Authentication Failures` | This alert is triggered when there are multiple NTLM authentication failures, which could indicate credential theft attempts. | Count `>=` 5 | Count `<` 5 |
| `Active Directory - Replication Failures` | This alert triggers when AD replication failures occur, which can impact directory synchronization. | Count `>` 0 | Count `<=` 0 |
| `Active Directory - Schema Modifications` | This alert is triggered when changes are made to the AD schema, which are rare and potentially high-impact changes. | Count `>` 0 | Count `<=` 0 |
## Create monitors for Active Directory app
import CreateMonitors from '../../../reuse/apps/create-monitors.md';
### Active Directory alerts
| Name | Description | Alert Condition | Recover Condition |
|:--|:--|:--|:--|
| `Active Directory - Account Lockouts Spike` | This alert is triggered when there are multiple account lockouts in a short time period, indicating potential brute force attempts. | Count `>=` 5 | Count `<` 5 |
| `Active Directory - Directory Service Failures` | This alert is triggered when there are critical Directory Service failures that could impact AD functionality. | Count `>=` 3 | Count `<` 3 |
| `Active Directory - Mass User Account Deletions` | This alert triggers when multiple user accounts are deleted in a short time period, which could indicate malicious activity. | Count `>` 5 | Count `<=` 5 |
| `Active Directory - NTLM Authentication Failures` | This alert is triggered when there are multiple NTLM authentication failures, which could indicate credential theft attempts. | Count `>=` 5 | Count `<` 5 |
| `Active Directory - Replication Failures` | This alert triggers when AD replication failures occur, which can impact directory synchronization. | Count `>` 0 | Count `<=` 0 |
| `Active Directory - Schema Modifications` | This alert is triggered when changes are made to the AD schema, which are rare and potentially high-impact changes. | Count `>` 0 | Count `<=` 0 |