---
id: sql-server-linux-opentelemetry
title: Microsoft SQL Server for Linux - OpenTelemetry Collector
sidebar_label: Microsoft SQL Server for Linux - OTel Collector
description: Learn about the Sumo Logic OpenTelemetry app for Microsoft SQL Server for Linux.
slug: /help/docs/integrations/microsoft-azure/opentelemetry/sql-server-linux-opentelemetry/
canonical: https://www.sumologic.com/help/docs/integrations/microsoft-azure/opentelemetry/sql-server-linux-opentelemetry/
---
import useBaseUrl from '@docusaurus/useBaseUrl';
import Tabs from '@theme/Tabs';
import TabItem from '@theme/TabItem';
})
}) :::note logs only
This is a logs-only app. For collecting metrics and enabling comprehensive monitoring on both Linux and Windows, use the [Microsoft SQL Server - OpenTelemetry App](/docs/integrations/microsoft-azure/opentelemetry/sql-server-opentelemetry).
:::
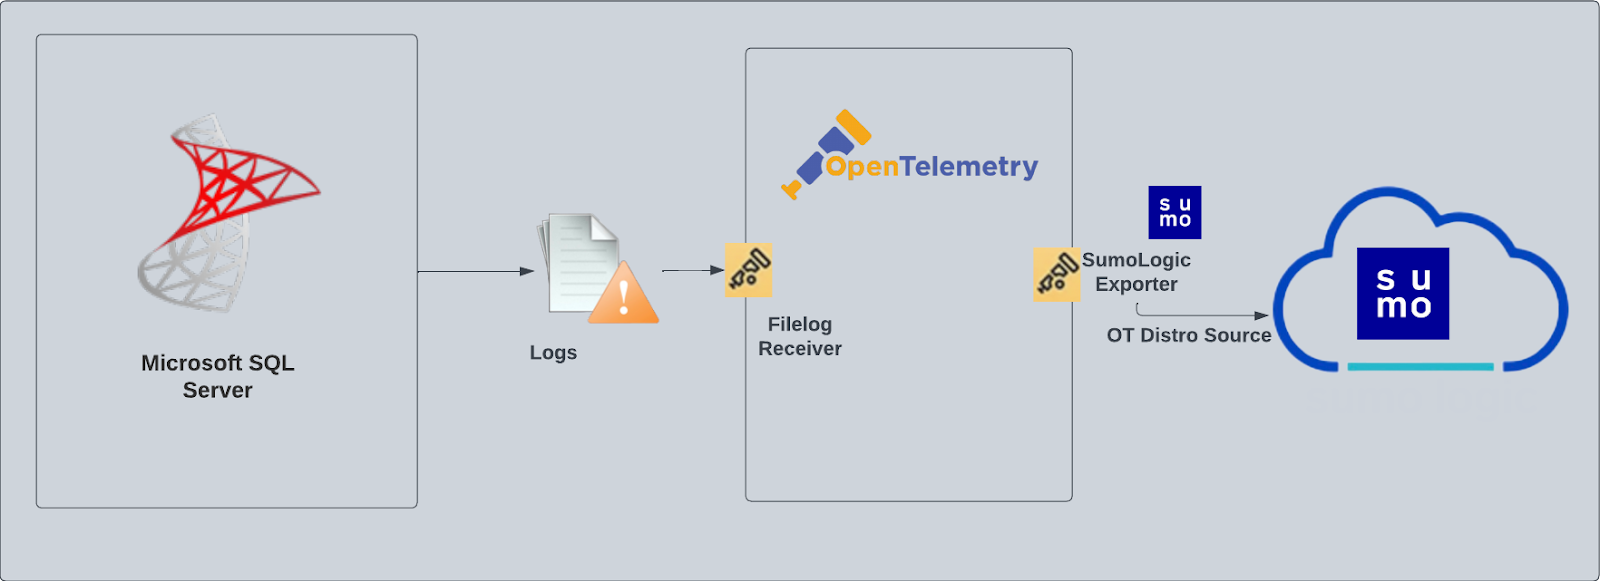
The Sumo Logic app for Microsoft SQL Server is a logs-based app that provides insight into your SQL Server for Linux. The app consists of predefined dashboards, providing visibility into your environment for real-time or historical analysis on backup, restore mirroring, general health and operations of your system.
This app has been tested with following SQL Server versions:
- Microsoft SQL Server 2016
SQL Server logs are sent to Sumo Logic through OpenTelemetry [filelog receiver](https://github.com/open-telemetry/opentelemetry-collector-contrib/tree/main/receiver/filelogreceiver).
:::note logs only
This is a logs-only app. For collecting metrics and enabling comprehensive monitoring on both Linux and Windows, use the [Microsoft SQL Server - OpenTelemetry App](/docs/integrations/microsoft-azure/opentelemetry/sql-server-opentelemetry).
:::
The Sumo Logic app for Microsoft SQL Server is a logs-based app that provides insight into your SQL Server for Linux. The app consists of predefined dashboards, providing visibility into your environment for real-time or historical analysis on backup, restore mirroring, general health and operations of your system.
This app has been tested with following SQL Server versions:
- Microsoft SQL Server 2016
SQL Server logs are sent to Sumo Logic through OpenTelemetry [filelog receiver](https://github.com/open-telemetry/opentelemetry-collector-contrib/tree/main/receiver/filelogreceiver).
 ## Fields creation in Sumo Logic for SQL Server
Following are the [Fields](/docs/manage/fields/) which will be created as part of SQL Server app install if not already present.
* `db.cluster.name`. User configured. Enter a name to identify this SQL Server cluster. This cluster name will be shown in the Sumo Logic dashboards.
* `db.system`. Has a fixed value of **sqlserver**.
* `deployment.environment`. User configured. This is the deployment environment where the SQL Server cluster resides. For example dev, prod, or qa.
* `sumo.datasource`. Has a fixed value of **sqlserver**.
## Prerequisites
Make sure logging is turned on in SQL Server. Follow [this documentation](https://docs.microsoft.com/en-us/sql/database-engine/configure-windows/scm-services-configure-sql-server-error-logs?view=sql-server-ver15) to enable it.
The Microsoft SQL Server app's queries and dashboards depend on logs from the SQL Server ERRORLOG, which is typically found in: `/var/opt/mssql/log/errorlog`.
The ERRORLOG is typically in UTF-16LE encoding, however, be sure to verify the file encoding used in your SQL Server configuration.
import LogsCollectionPrereqisites from '../../../reuse/apps/logs-collection-prereqisites.md';
## Collection configuration and app installation
import ConfigAppInstall from '../../../reuse/apps/opentelemetry/config-app-install.md';
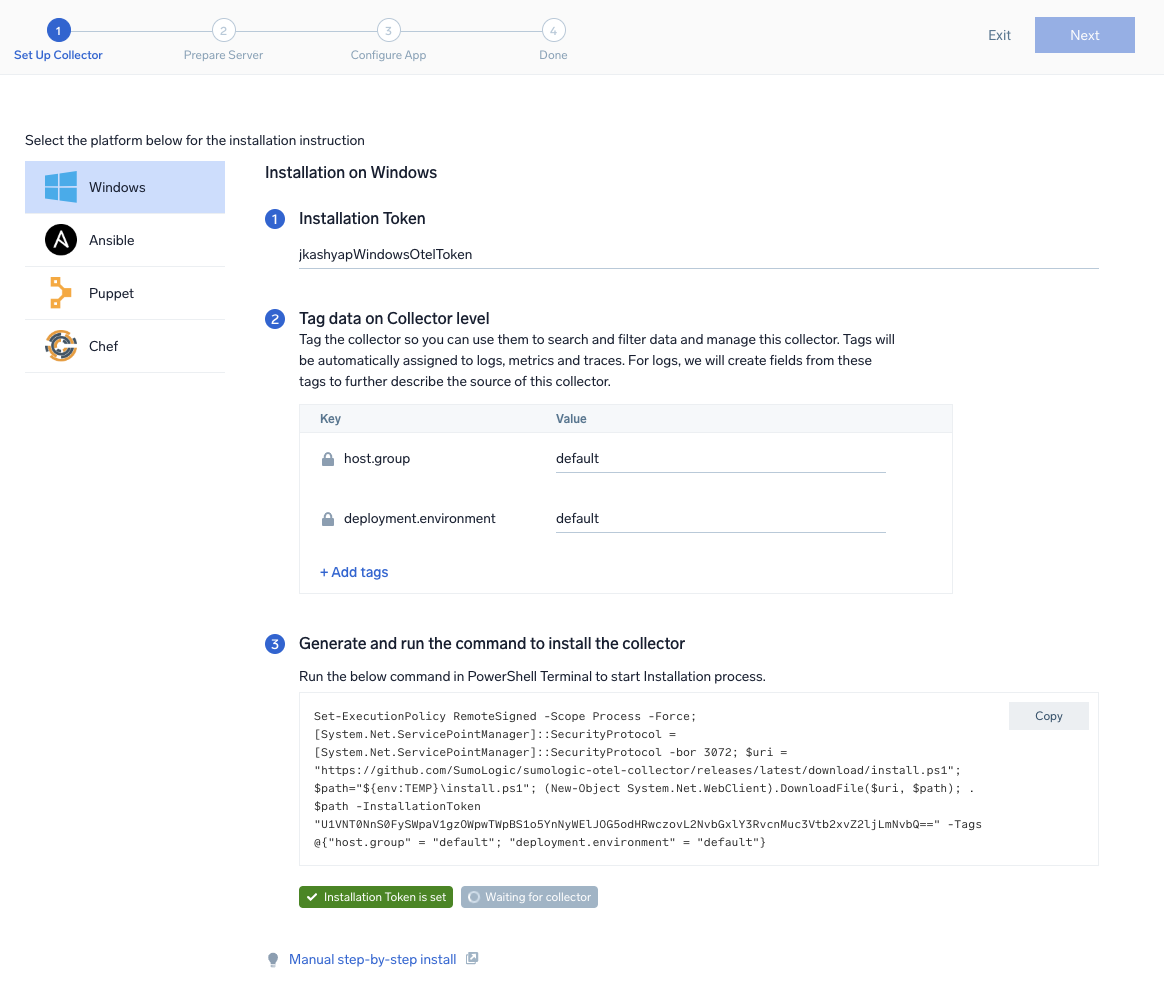
### Step 1: Set up Collector
import SetupColl from '../../../reuse/apps/opentelemetry/set-up-collector.md';
## Fields creation in Sumo Logic for SQL Server
Following are the [Fields](/docs/manage/fields/) which will be created as part of SQL Server app install if not already present.
* `db.cluster.name`. User configured. Enter a name to identify this SQL Server cluster. This cluster name will be shown in the Sumo Logic dashboards.
* `db.system`. Has a fixed value of **sqlserver**.
* `deployment.environment`. User configured. This is the deployment environment where the SQL Server cluster resides. For example dev, prod, or qa.
* `sumo.datasource`. Has a fixed value of **sqlserver**.
## Prerequisites
Make sure logging is turned on in SQL Server. Follow [this documentation](https://docs.microsoft.com/en-us/sql/database-engine/configure-windows/scm-services-configure-sql-server-error-logs?view=sql-server-ver15) to enable it.
The Microsoft SQL Server app's queries and dashboards depend on logs from the SQL Server ERRORLOG, which is typically found in: `/var/opt/mssql/log/errorlog`.
The ERRORLOG is typically in UTF-16LE encoding, however, be sure to verify the file encoding used in your SQL Server configuration.
import LogsCollectionPrereqisites from '../../../reuse/apps/logs-collection-prereqisites.md';
## Collection configuration and app installation
import ConfigAppInstall from '../../../reuse/apps/opentelemetry/config-app-install.md';
### Step 1: Set up Collector
import SetupColl from '../../../reuse/apps/opentelemetry/set-up-collector.md';
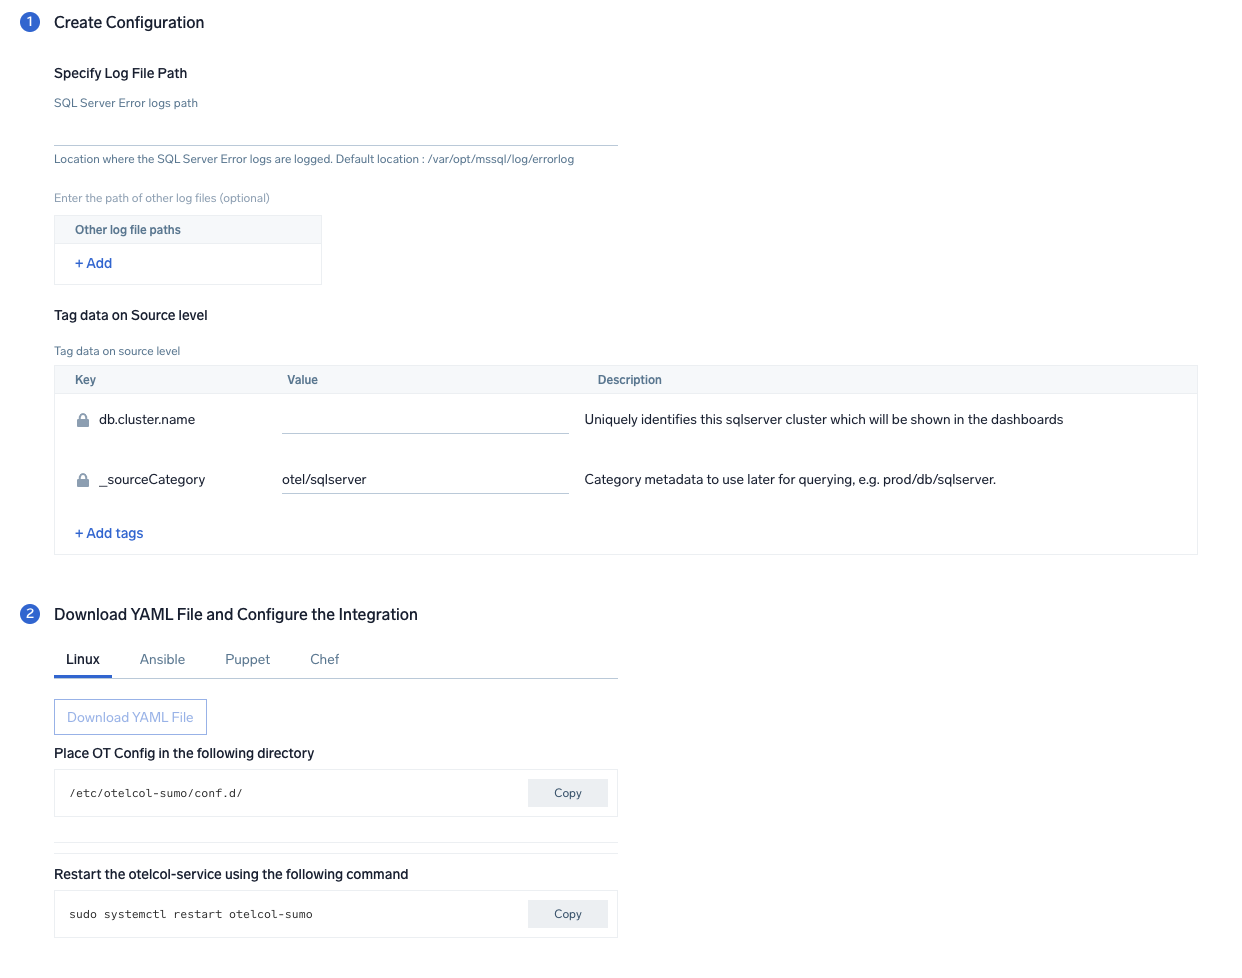
 ### Step 2: Configure integration
The Microsoft SQL Server app's queries and dashboards depend on logs from the SQL Server ERRORLOG, which is typically found in:
`/var/opt/mssql/log/errorlog`
You can add any custom fields which you want to tag along with the data ingested in Sumo. Click on the **Download YAML File** button to get the YAML file.
import CollectorVersionNote from '../../../reuse/apps/opentelemetry/collector-version-note.md';
### Step 2: Configure integration
The Microsoft SQL Server app's queries and dashboards depend on logs from the SQL Server ERRORLOG, which is typically found in:
`/var/opt/mssql/log/errorlog`
You can add any custom fields which you want to tag along with the data ingested in Sumo. Click on the **Download YAML File** button to get the YAML file.
import CollectorVersionNote from '../../../reuse/apps/opentelemetry/collector-version-note.md';
 ### Step 3: Send logs to Sumo Logic
import LogsIntro from '../../../reuse/apps/opentelemetry/send-logs-intro.md';
1. Copy the yaml file to `/etc/otelcol-sumo/conf.d/` folder in the SQL Server instance which needs to be monitored.
1. Restart the collector using:
```sh
sudo systemctl restart otelcol-sumo
```
import ChefNoEnv from '../../../reuse/apps/opentelemetry/chef-without-env.md';
import AnsibleNoEnv from '../../../reuse/apps/opentelemetry/ansible-without-env.md';
import PuppetNoEnv from '../../../reuse/apps/opentelemetry/puppet-without-env.md';
import LogsOutro from '../../../reuse/apps/opentelemetry/send-logs-outro.md';
## Sample log messages
```
2023-01-09 13:23:31.276 Logon Login succeeded for user 'NT SERVICE\SQLSERVERAGENT'. Connection made using Windows authentication. [CLIENT: ]
```
## Sample queries
Following is the query from **Error and warning count** panel from the **SQL Server app - Overview** dashboard:
```sumo
%"db.cluster.name"=* %"deployment.environment"=* %"sumo.datasource"=sqlserver ("Error:" or "Warning:") | json "log" as _rawlog nodrop
| if (isEmpty(_rawlog), _raw, _rawlog) as _raw
| parse regex "\s+(?Error|Warning):\s+(?.*)$"
| count by LogType
```
## Viewing Microsoft SQL Server dashboards
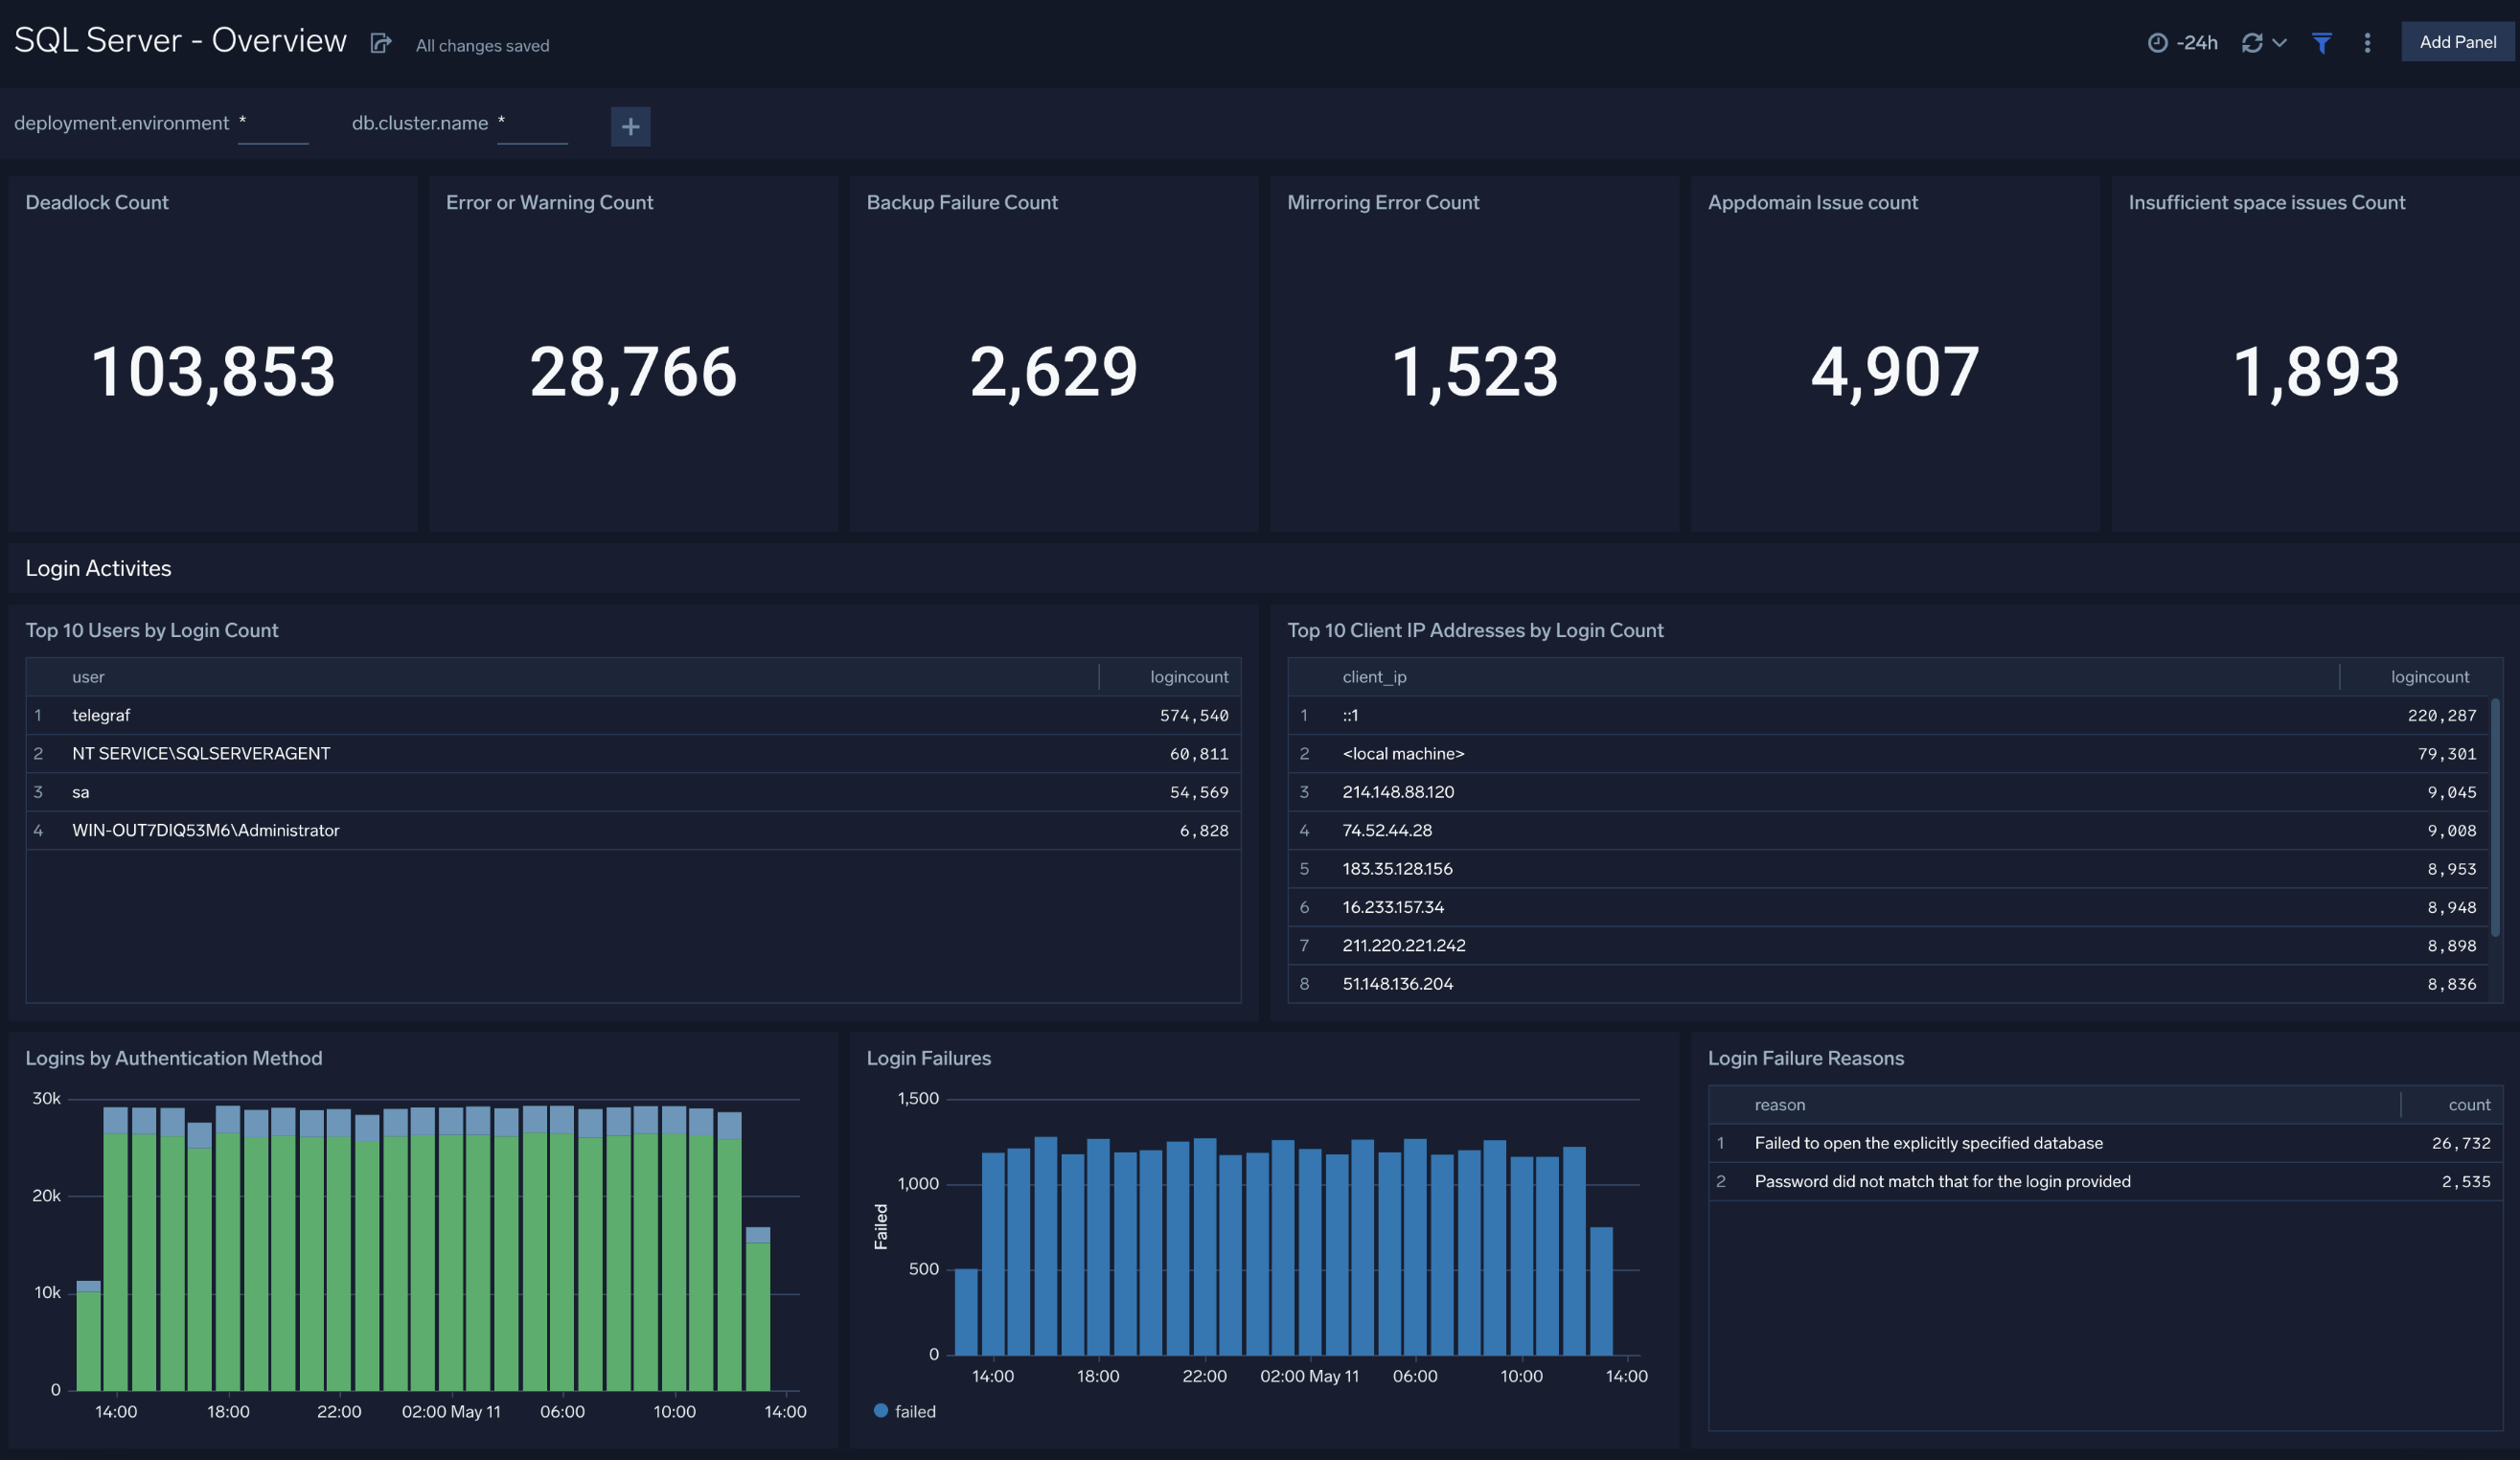
### Overview
The **SQL Server Linux - Overview** dashboard provides a snapshot overview of your SQL Server instance. Use this dashboard to understand CPU, memory, and disk utilization of your SQL Server(s) deployed in your cluster. This dashboard also provides login activities and methods by users.
Use this dashboard to:
- Keep track of deadlocks, errors, backup failures, mirroring errors, and insufficient space issue counts.
- Examine login activities, failures, and failure reasons.
### Step 3: Send logs to Sumo Logic
import LogsIntro from '../../../reuse/apps/opentelemetry/send-logs-intro.md';
1. Copy the yaml file to `/etc/otelcol-sumo/conf.d/` folder in the SQL Server instance which needs to be monitored.
1. Restart the collector using:
```sh
sudo systemctl restart otelcol-sumo
```
import ChefNoEnv from '../../../reuse/apps/opentelemetry/chef-without-env.md';
import AnsibleNoEnv from '../../../reuse/apps/opentelemetry/ansible-without-env.md';
import PuppetNoEnv from '../../../reuse/apps/opentelemetry/puppet-without-env.md';
import LogsOutro from '../../../reuse/apps/opentelemetry/send-logs-outro.md';
## Sample log messages
```
2023-01-09 13:23:31.276 Logon Login succeeded for user 'NT SERVICE\SQLSERVERAGENT'. Connection made using Windows authentication. [CLIENT: ]
```
## Sample queries
Following is the query from **Error and warning count** panel from the **SQL Server app - Overview** dashboard:
```sumo
%"db.cluster.name"=* %"deployment.environment"=* %"sumo.datasource"=sqlserver ("Error:" or "Warning:") | json "log" as _rawlog nodrop
| if (isEmpty(_rawlog), _raw, _rawlog) as _raw
| parse regex "\s+(?Error|Warning):\s+(?.*)$"
| count by LogType
```
## Viewing Microsoft SQL Server dashboards
### Overview
The **SQL Server Linux - Overview** dashboard provides a snapshot overview of your SQL Server instance. Use this dashboard to understand CPU, memory, and disk utilization of your SQL Server(s) deployed in your cluster. This dashboard also provides login activities and methods by users.
Use this dashboard to:
- Keep track of deadlocks, errors, backup failures, mirroring errors, and insufficient space issue counts.
- Examine login activities, failures, and failure reasons.
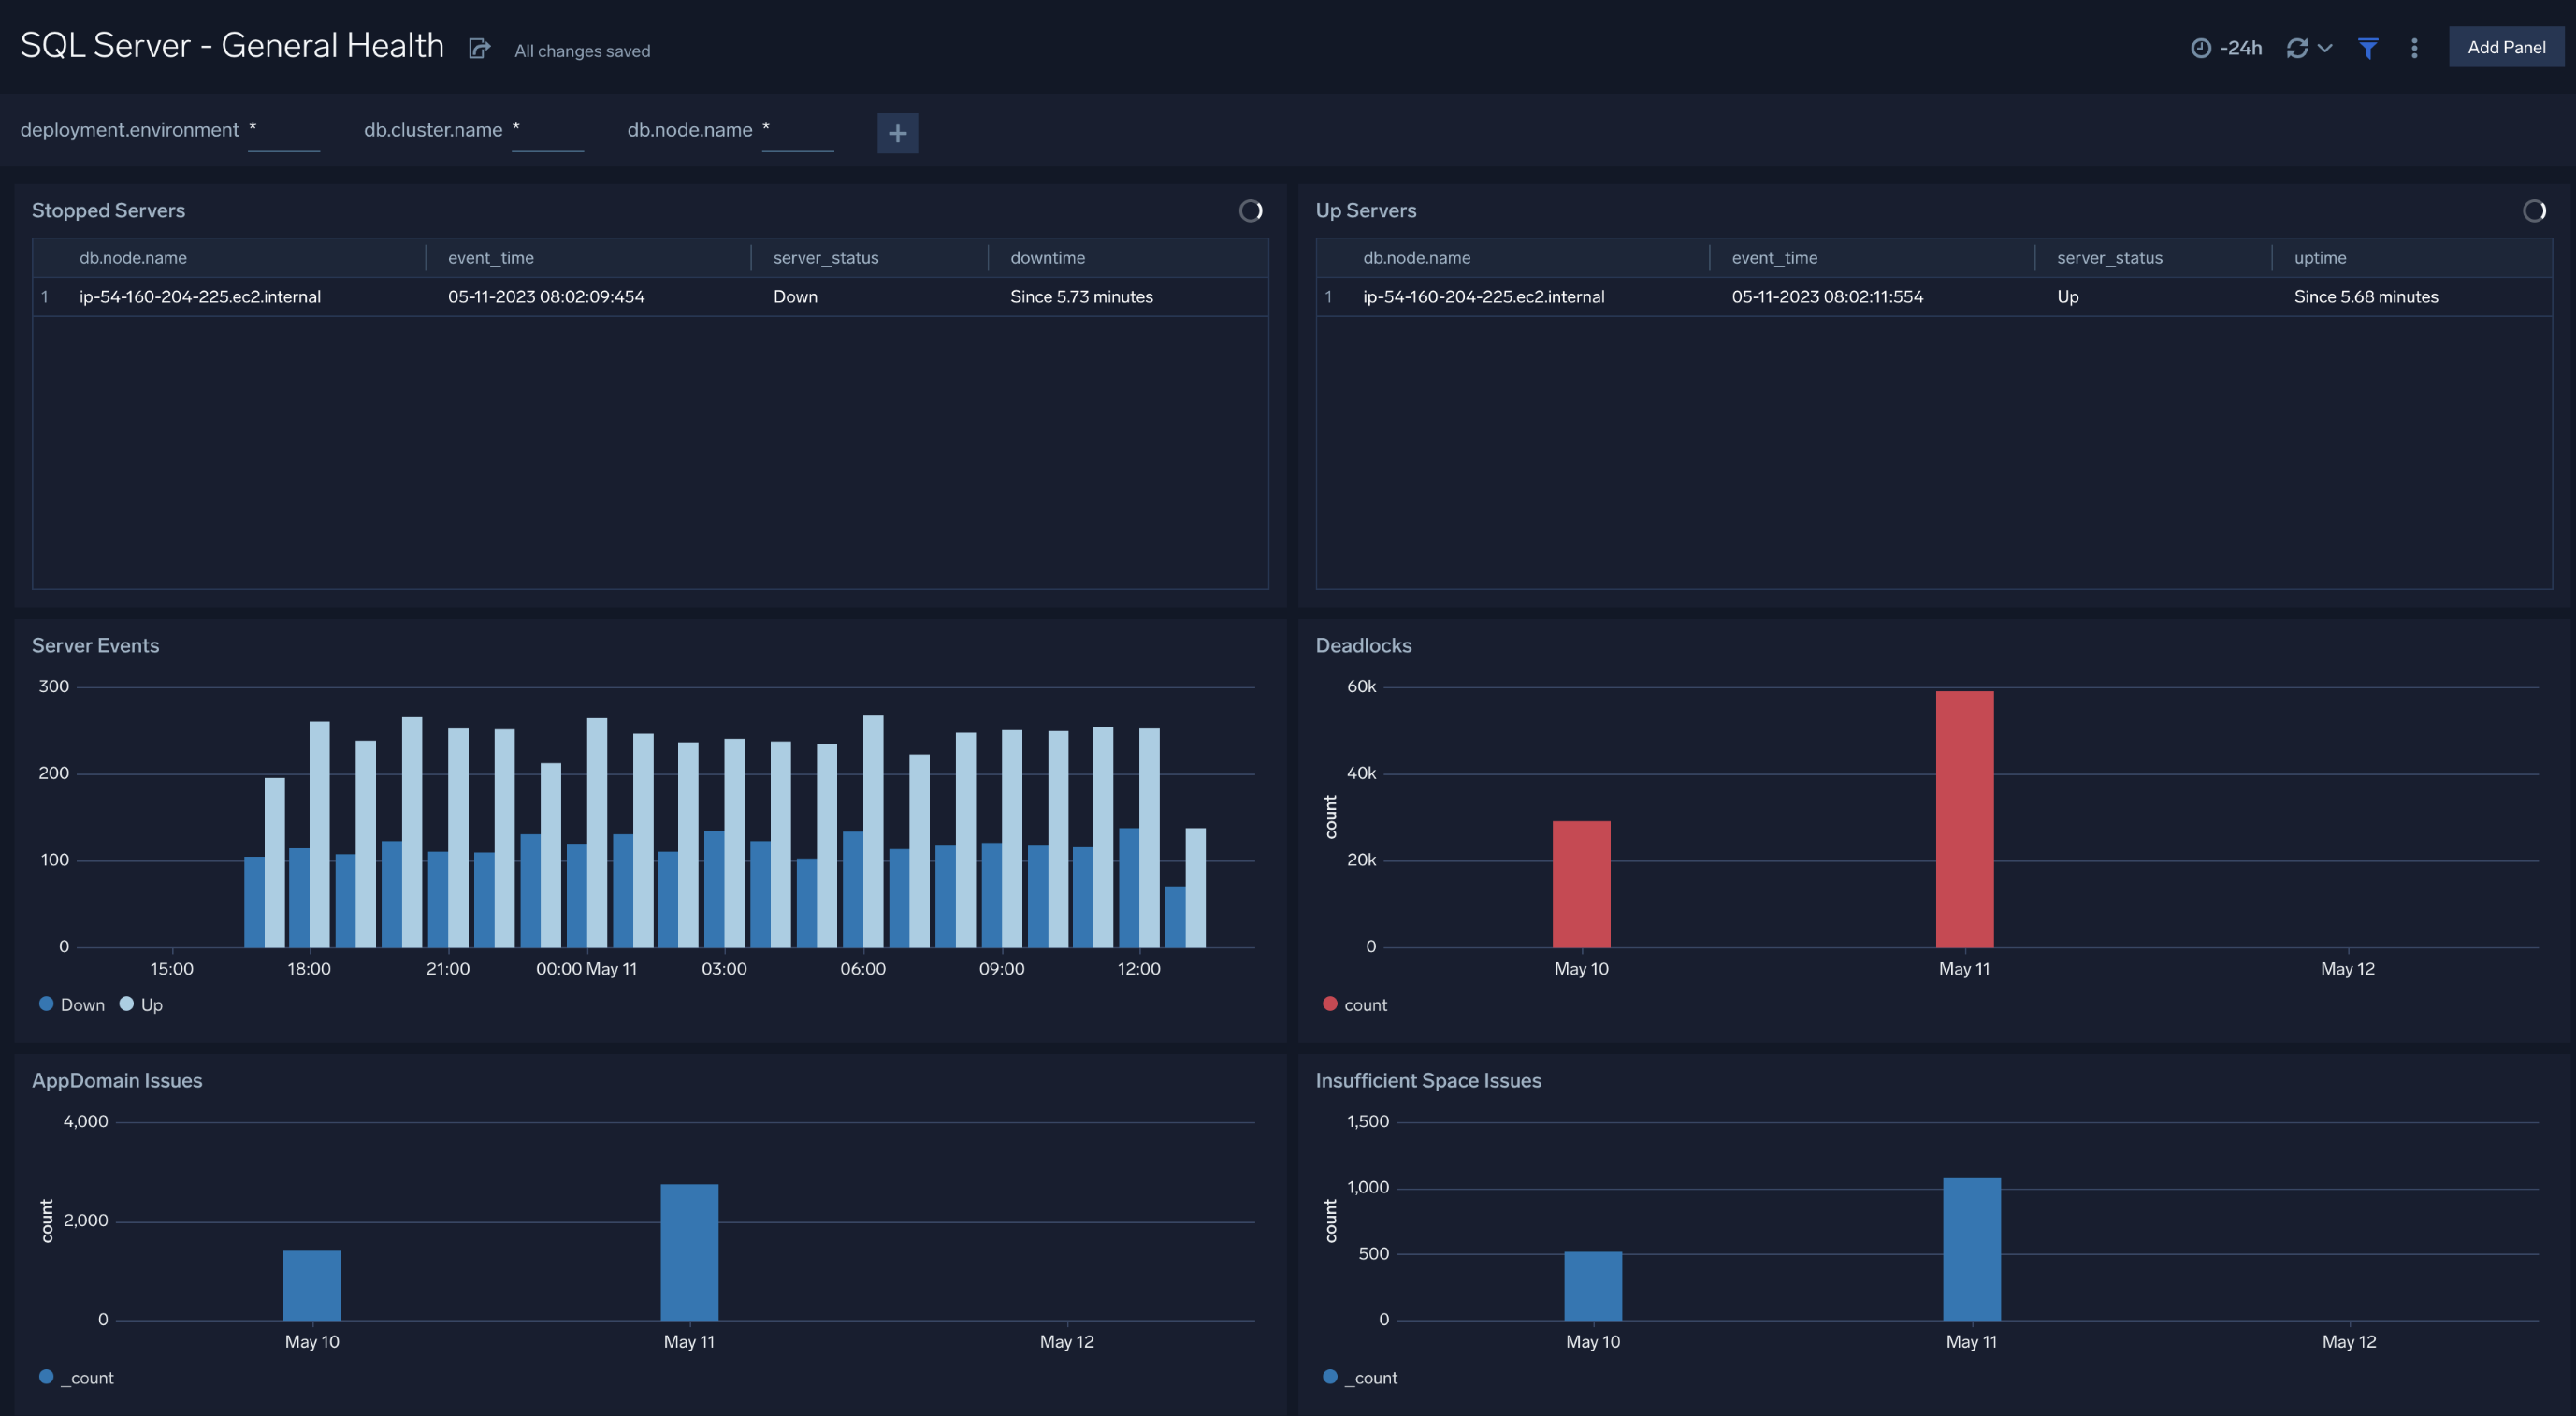
 ### General Health
The **SQL Server Linux - General Health** dashboard provides you the overall health of SQL Server. Use this dashboard to analyze server events including stopped/up servers and its corresponding down/uptime, monitor disk space percentage utilization, wait time trend, and app-domain issues by SQL server.
Use this dashboard to:
- Analyze server events including stopped/up servers and its corresponding down/uptime.
- Monitor server events trends including SQL Server wait time.
- Get insight into app-domain and percentage disk utilization issues by SQL Server.
### General Health
The **SQL Server Linux - General Health** dashboard provides you the overall health of SQL Server. Use this dashboard to analyze server events including stopped/up servers and its corresponding down/uptime, monitor disk space percentage utilization, wait time trend, and app-domain issues by SQL server.
Use this dashboard to:
- Analyze server events including stopped/up servers and its corresponding down/uptime.
- Monitor server events trends including SQL Server wait time.
- Get insight into app-domain and percentage disk utilization issues by SQL Server.
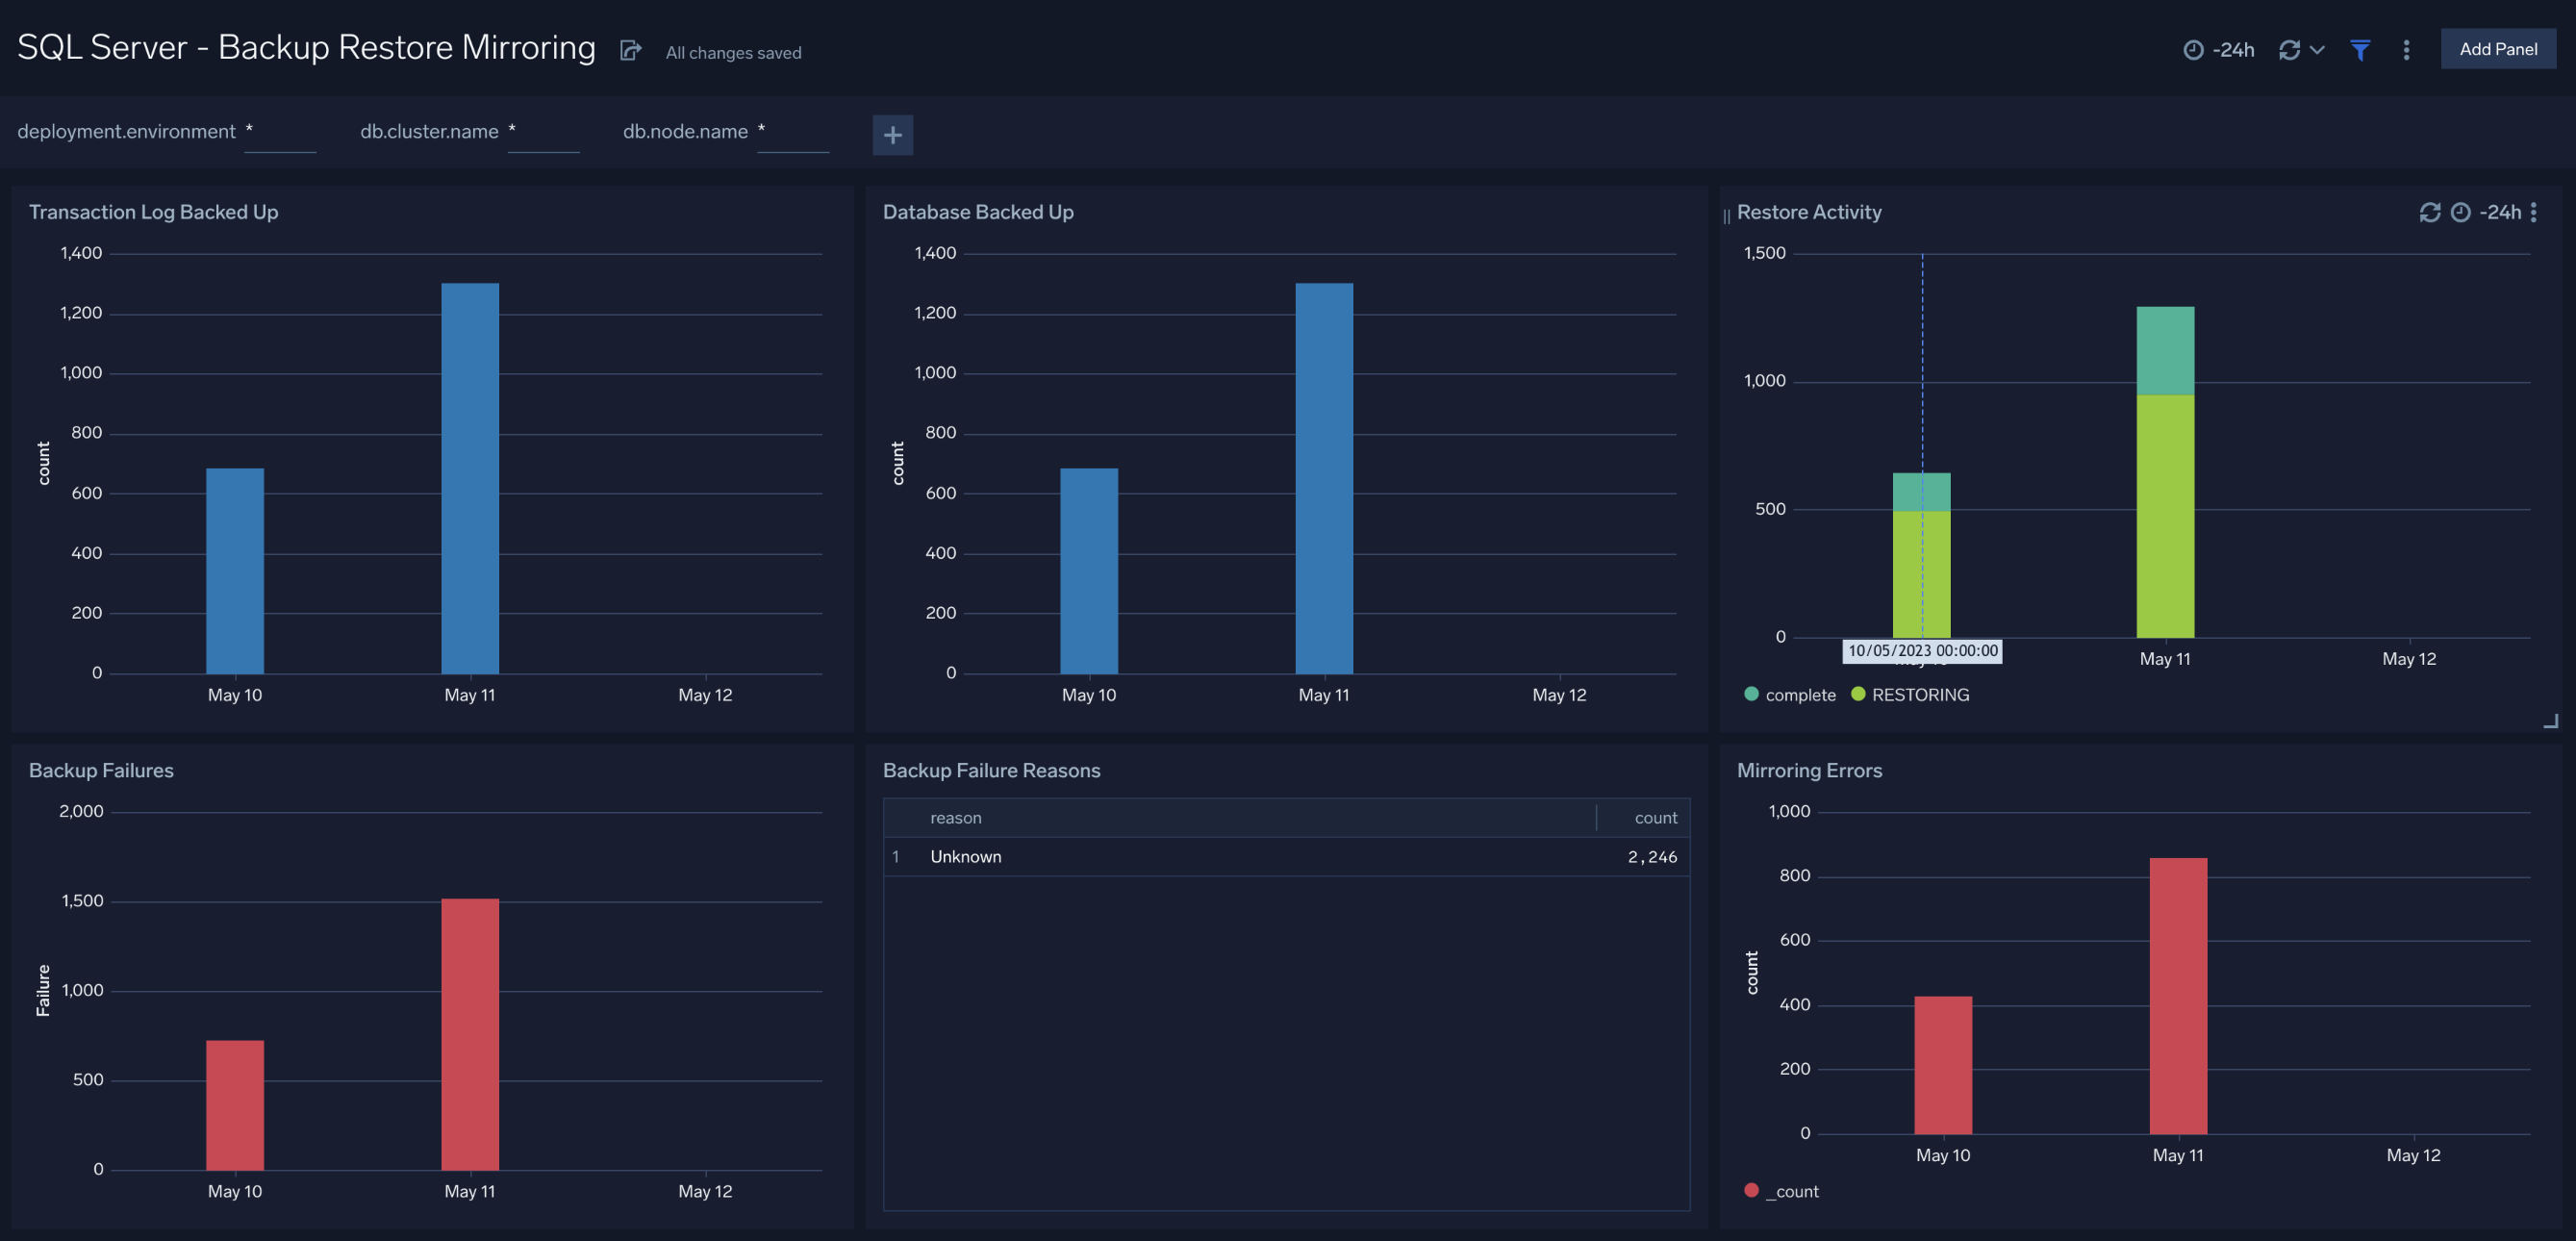
 ### Backup Restore Mirroring
The **SQL Server Linux - Backup Restore Mirroring** dashboard provides information about:
- Transaction log backup events
- Database backup events
- Restore activities
- Backup failures and reasons
- Mirroring errors
### Backup Restore Mirroring
The **SQL Server Linux - Backup Restore Mirroring** dashboard provides information about:
- Transaction log backup events
- Database backup events
- Restore activities
- Backup failures and reasons
- Mirroring errors
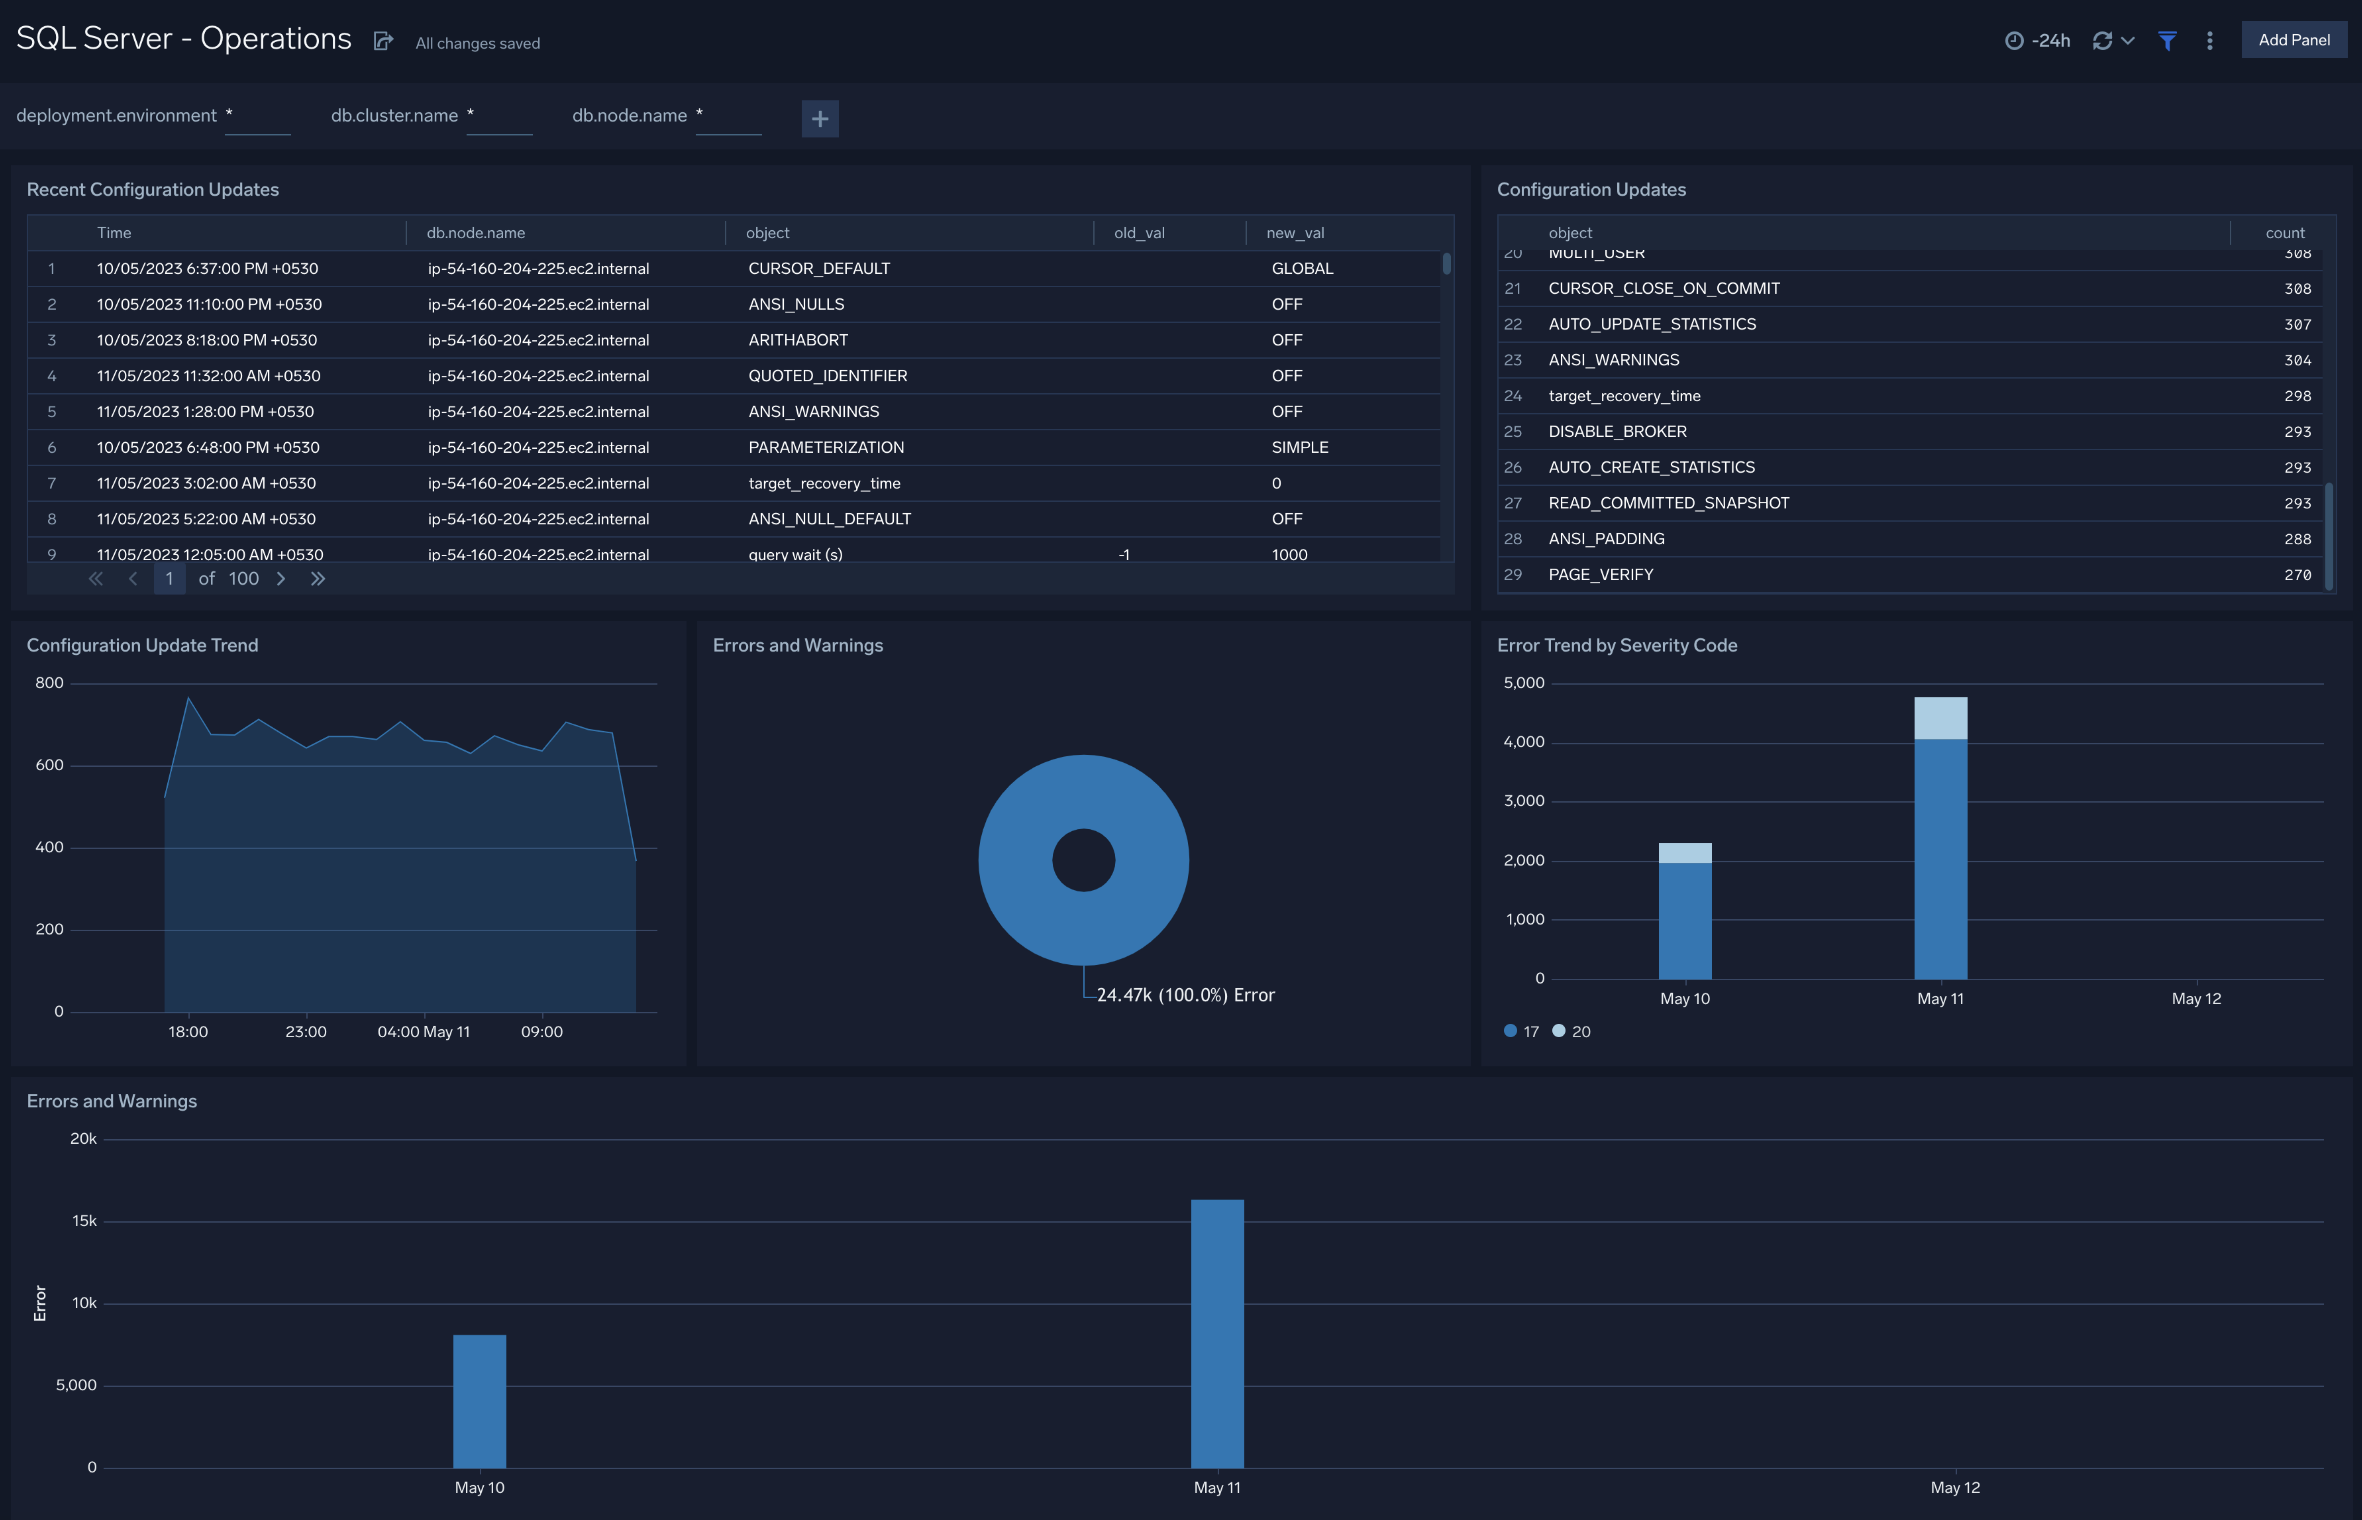
 ### Operations
The **SQL Server Linux - Operations** dashboard displays recent server configuration changes, number and type of configuration updates, error and warnings, high severity error, and warning trends.
Use this dashboard to:
- Get insights into configuration changes and updates to SQL server instances.
- Monitor any errors and warnings.
### Operations
The **SQL Server Linux - Operations** dashboard displays recent server configuration changes, number and type of configuration updates, error and warnings, high severity error, and warning trends.
Use this dashboard to:
- Get insights into configuration changes and updates to SQL server instances.
- Monitor any errors and warnings.
 ## Create monitors for SQL Server Linux app
import CreateMonitors from '../../../reuse/apps/create-monitors.md';
### SQL Server Linux alerts
| Name | Description | Alert Condition | Recover Condition |
|:--|:--|:--|:--|
| `SQL Server Linux - AppDomain` | This alert is triggered when AppDomain-related issues are detected in your SQL Server instance. | Count `>=` 1 | Count `<` 1 |
| `SQL Server Linux - Backup Fail` | This alert is triggered when the SQL Server backup fails. | Count `>=` 1 | Count `<` 1 |
| `SQL Server Linux - Deadlock` | This alert is triggered when deadlocks are detected in a SQL Server instance. | Count `>` 5 | Count `<=` 5 |
| `SQL Server Linux - Instance Down` | This alert is triggered when the SQL Server instance is down for 5 minutes. | Count `>` 0 | Count `<=` 0 |
| `SQL Server Linux - Insufficient Space` | This alert is triggered when the SQL Server instance cannot allocate a new page for the database due to insufficient disk space in the filegroup. | Count `>` 0 | Count `<=` 0 |
| `SQL Server Linux - Login Fail` | This alert is triggered when the user is unable to login to the SQL Server. | Count `>=` 1 | Count `<` 1 |
| `SQL Server Linux - Mirroring Error` | This alert is triggered when an error occurs in SQL Server mirroring. | Count `>=` 1 | Count `<` 1 |
## Create monitors for SQL Server Linux app
import CreateMonitors from '../../../reuse/apps/create-monitors.md';
### SQL Server Linux alerts
| Name | Description | Alert Condition | Recover Condition |
|:--|:--|:--|:--|
| `SQL Server Linux - AppDomain` | This alert is triggered when AppDomain-related issues are detected in your SQL Server instance. | Count `>=` 1 | Count `<` 1 |
| `SQL Server Linux - Backup Fail` | This alert is triggered when the SQL Server backup fails. | Count `>=` 1 | Count `<` 1 |
| `SQL Server Linux - Deadlock` | This alert is triggered when deadlocks are detected in a SQL Server instance. | Count `>` 5 | Count `<=` 5 |
| `SQL Server Linux - Instance Down` | This alert is triggered when the SQL Server instance is down for 5 minutes. | Count `>` 0 | Count `<=` 0 |
| `SQL Server Linux - Insufficient Space` | This alert is triggered when the SQL Server instance cannot allocate a new page for the database due to insufficient disk space in the filegroup. | Count `>` 0 | Count `<=` 0 |
| `SQL Server Linux - Login Fail` | This alert is triggered when the user is unable to login to the SQL Server. | Count `>=` 1 | Count `<` 1 |
| `SQL Server Linux - Mirroring Error` | This alert is triggered when an error occurs in SQL Server mirroring. | Count `>=` 1 | Count `<` 1 |