---
id: litellm
title: LiteLLM
sidebar_label: LiteLLM
description: The Sumo Logic app for LiteLLM provides visibility into LLM proxy usage, cost, latency, deployment health, and performance across OpenAI, Bedrock, Groq, and other providers.
slug: /help/docs/integrations/saas-cloud/litellm/
canonical: https://www.sumologic.com/help/docs/integrations/saas-cloud/litellm/
---
import useBaseUrl from '@docusaurus/useBaseUrl';
}) The Sumo Logic app for LiteLLM provides preconfigured dashboards to monitor request volume, latency, token consumption, spend, budget and rate limits, deployment and fallback health, infrastructure (Redis, Postgres), and user or route visibility. Use the app to track cost by team or API key, identify slow models, detect failures and fallbacks, and ensure your LLM proxy is running smoothly.
[LiteLLM](https://docs.litellm.ai/) is an open-source proxy that provides a unified interface to call 100+ LLM APIs (OpenAI, Anthropic, AWS Bedrock, Groq, and more). It routes requests, manages fallbacks, tracks budgets, and exposes Prometheus metrics for observability.
## Log and metric types
The Sumo Logic app for LiteLLM collects logs and metrics to provide comprehensive observability.
### Logs
LiteLLM sends request and response logs to Sumo Logic via the `sumologic` callback, which POSTs log entries as JSON to an HTTP Logs and Metrics Source. These logs include:
* Request details (model, route, user, team, API key)
* Response metadata (tokens, latency, cost)
* Error information (exception class, status, messages)
* Security and compliance data (guardrails, PII detection, geographic access)
* MCP (Model Context Protocol) and RAG activity
### Metrics
LiteLLM exposes Prometheus metrics at `/metrics/` which are scraped by the OpenTelemetry Collector. Metrics include:
* Request counts (total, failed, by model/team/user)
* Latency metrics (total latency, API latency, time to first token)
* Token usage (input, output, total tokens)
* Cost tracking (spend by model, team, user)
* Budget metrics (remaining budget, hours until reset)
* Deployment health (success, failures, fallbacks, state)
* Rate limits (remaining requests, remaining tokens)
* Infrastructure metrics (Redis, Postgres, queue sizes)
For more details on metrics, see the [LiteLLM Prometheus documentation](https://docs.litellm.ai/docs/proxy/prometheus).
## Prerequisites
Before setting up the LiteLLM app, ensure the following:
* **LiteLLM Proxy** is installed and running. See [LiteLLM documentation](https://docs.litellm.ai/docs/proxy/quick_start) for installation instructions.
* **OpenTelemetry Collector** is installed on the same host as LiteLLM or can access the LiteLLM `/metrics/` endpoint. See [OpenTelemetry Collector Installation](/docs/send-data/opentelemetry-collector/install-collector/).
* **LiteLLM Prometheus metrics** are enabled in your LiteLLM configuration.
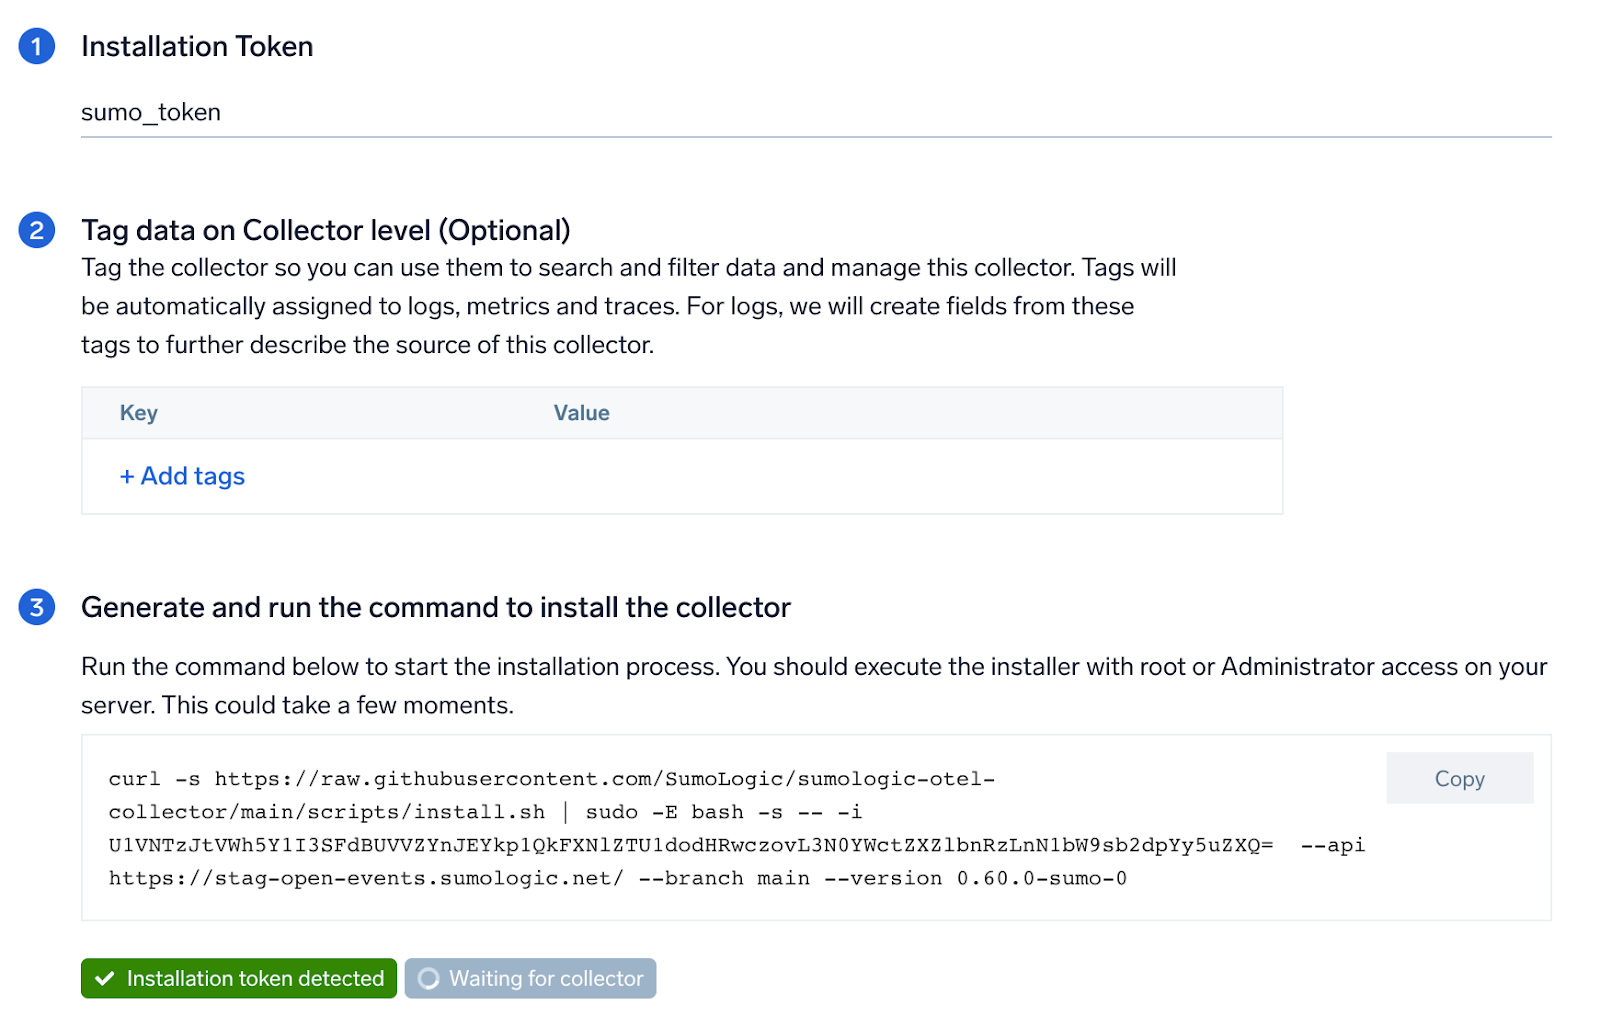
* **Sumo Logic Installation Token** for registering the OTel Collector.
## Collection Setup
import ConfigAppInstall from '../../reuse/apps/opentelemetry/config-app-install.md';
### Step 1: Set up OpenTelemetry Collector
import SetupColl from '../../reuse/apps/opentelemetry/set-up-collector.md';
:::note
Please select **locally managed collector** option while creating new OpenTelemetry collector.
:::
The Sumo Logic app for LiteLLM provides preconfigured dashboards to monitor request volume, latency, token consumption, spend, budget and rate limits, deployment and fallback health, infrastructure (Redis, Postgres), and user or route visibility. Use the app to track cost by team or API key, identify slow models, detect failures and fallbacks, and ensure your LLM proxy is running smoothly.
[LiteLLM](https://docs.litellm.ai/) is an open-source proxy that provides a unified interface to call 100+ LLM APIs (OpenAI, Anthropic, AWS Bedrock, Groq, and more). It routes requests, manages fallbacks, tracks budgets, and exposes Prometheus metrics for observability.
## Log and metric types
The Sumo Logic app for LiteLLM collects logs and metrics to provide comprehensive observability.
### Logs
LiteLLM sends request and response logs to Sumo Logic via the `sumologic` callback, which POSTs log entries as JSON to an HTTP Logs and Metrics Source. These logs include:
* Request details (model, route, user, team, API key)
* Response metadata (tokens, latency, cost)
* Error information (exception class, status, messages)
* Security and compliance data (guardrails, PII detection, geographic access)
* MCP (Model Context Protocol) and RAG activity
### Metrics
LiteLLM exposes Prometheus metrics at `/metrics/` which are scraped by the OpenTelemetry Collector. Metrics include:
* Request counts (total, failed, by model/team/user)
* Latency metrics (total latency, API latency, time to first token)
* Token usage (input, output, total tokens)
* Cost tracking (spend by model, team, user)
* Budget metrics (remaining budget, hours until reset)
* Deployment health (success, failures, fallbacks, state)
* Rate limits (remaining requests, remaining tokens)
* Infrastructure metrics (Redis, Postgres, queue sizes)
For more details on metrics, see the [LiteLLM Prometheus documentation](https://docs.litellm.ai/docs/proxy/prometheus).
## Prerequisites
Before setting up the LiteLLM app, ensure the following:
* **LiteLLM Proxy** is installed and running. See [LiteLLM documentation](https://docs.litellm.ai/docs/proxy/quick_start) for installation instructions.
* **OpenTelemetry Collector** is installed on the same host as LiteLLM or can access the LiteLLM `/metrics/` endpoint. See [OpenTelemetry Collector Installation](/docs/send-data/opentelemetry-collector/install-collector/).
* **LiteLLM Prometheus metrics** are enabled in your LiteLLM configuration.
* **Sumo Logic Installation Token** for registering the OTel Collector.
## Collection Setup
import ConfigAppInstall from '../../reuse/apps/opentelemetry/config-app-install.md';
### Step 1: Set up OpenTelemetry Collector
import SetupColl from '../../reuse/apps/opentelemetry/set-up-collector.md';
:::note
Please select **locally managed collector** option while creating new OpenTelemetry collector.
:::
 ### Step 2: Configure integration
In this step, you'll configure LiteLLM for logs and metrics collection.
#### 1. LiteLLM Configuration
Add the following to your LiteLLM proxy configuration file (`/app/config.yaml` or your equivalent `litellm-config.yaml` path):
```yaml
litellm_settings:
# Enable Prometheus metrics, OTel tracing, and Sumo Logic log callback
callbacks: ["prometheus", "otel", "sumologic"]
# Enable system-level Prometheus metrics (Redis, Postgres, self latency)
service_callback: ["prometheus_system"]
# Required for provider rate-limit headers (remaining requests/tokens metrics)
return_response_headers: true
# Enable end-user cost tracking in Prometheus metrics
enable_end_user_cost_tracking_prometheus_only: true
# Store audit logs in the database
store_audit_logs: true
# Initialize budget metrics on startup
prometheus_initialize_budget_metrics: true
```
Set the following environment variable:
| Variable | Required | Description |
|:--|:--|:--|
| `PROMETHEUS_MULTIPROC_DIR` | Yes | Directory for Prometheus multiprocess metric aggregation. Set to `/prometheus_multiproc`. The directory must exist before LiteLLM starts. Required when running LiteLLM with multiple workers. |
---
#### 2. Logs Collection
LiteLLM sends logs directly to Sumo Logic via HTTP using the `sumologic` callback.
**Create HTTP Logs and Metrics Source in Sumo Logic**
1. [**New UI**](/docs/get-started/sumo-logic-ui). In the Sumo Logic main menu select **Data Management**, and then under **Data Collection** select **Collection**. You can also click the **Go To...** menu at the top of the screen and select **Collection**.
### Step 2: Configure integration
In this step, you'll configure LiteLLM for logs and metrics collection.
#### 1. LiteLLM Configuration
Add the following to your LiteLLM proxy configuration file (`/app/config.yaml` or your equivalent `litellm-config.yaml` path):
```yaml
litellm_settings:
# Enable Prometheus metrics, OTel tracing, and Sumo Logic log callback
callbacks: ["prometheus", "otel", "sumologic"]
# Enable system-level Prometheus metrics (Redis, Postgres, self latency)
service_callback: ["prometheus_system"]
# Required for provider rate-limit headers (remaining requests/tokens metrics)
return_response_headers: true
# Enable end-user cost tracking in Prometheus metrics
enable_end_user_cost_tracking_prometheus_only: true
# Store audit logs in the database
store_audit_logs: true
# Initialize budget metrics on startup
prometheus_initialize_budget_metrics: true
```
Set the following environment variable:
| Variable | Required | Description |
|:--|:--|:--|
| `PROMETHEUS_MULTIPROC_DIR` | Yes | Directory for Prometheus multiprocess metric aggregation. Set to `/prometheus_multiproc`. The directory must exist before LiteLLM starts. Required when running LiteLLM with multiple workers. |
---
#### 2. Logs Collection
LiteLLM sends logs directly to Sumo Logic via HTTP using the `sumologic` callback.
**Create HTTP Logs and Metrics Source in Sumo Logic**
1. [**New UI**](/docs/get-started/sumo-logic-ui). In the Sumo Logic main menu select **Data Management**, and then under **Data Collection** select **Collection**. You can also click the **Go To...** menu at the top of the screen and select **Collection**.
[**Classic UI**](/docs/get-started/sumo-logic-ui-classic). In the main Sumo Logic menu, select **Manage Data > Collection > Collection**.
1. Click **Add Collector**.
1. Click **Hosted Collector**.
1. Provide a **Name** for the Collector. **Description** is optional.
1. **Category**. Enter any string to tag the logs collected from this Collector. This Source Category value is stored in a searchable metadata field called `_sourceCategory`.
1. Click the **+Add Field** link in the **Fields** section. Add any fields you want to associate with this Collector; each field needs a name (key) and value.
1. **Time Zone**. Set the default time zone when it is not extracted from the log timestamp.
1. Review your input and click **Save**.
1. In the Collectors page, click **Add Source** next to the Hosted Collector you just created.
1. Select **HTTP Logs & Metrics**.
1. Enter a **Name** to display for the Source. **Description** is optional.
1. **Source Category**. Enter a value such as `litellm/logs`. This value is stored in the `_sourceCategory` metadata field.
1. **Fields/Metadata**. Click **+Add** to define any additional fields you want to associate.
1. Click **Save**.
1. In the **HTTP Source Address** dialog box, copy the generated **Source URL**. You will use this as the value for `SUMOLOGIC_WEBHOOK_URL` in LiteLLM.
**Configure LiteLLM to send logs to HTTP endpoint**
Set the following environment variables for LiteLLM:
| Variable | Required | Description |
|:--|:--|:--|
| `SUMOLOGIC_WEBHOOK_URL` | Yes | HTTP Source URL copied from above. Used by the `sumologic` callback to POST log entries. |
| `GENERIC_LOGGER_ENDPOINT` | Yes | Set to the same value as `SUMOLOGIC_WEBHOOK_URL`. Required by the LiteLLM generic logger fallback. |
Add the environment variables to your `litellm-config.yaml`:
```yaml
environment_variables:
SUMOLOGIC_WEBHOOK_URL: os.environ/SUMOLOGIC_WEBHOOK_URL
GENERIC_LOGGER_ENDPOINT: os.environ/GENERIC_LOGGER_ENDPOINT
```
---
#### 3. Metrics Collection
LiteLLM exposes Prometheus metrics at `/metrics/`, which are scraped by the OpenTelemetry Collector and forwarded to Sumo Logic.
**Configure Prometheus metrics in LiteLLM**
Configure the `prometheus_metrics_config` block to control which metrics and labels are exposed at `/metrics/`. Add the following to your `litellm-config.yaml`:
Click to expand prometheus_metrics_config
```yaml
prometheus_metrics_config:
- group: "proxy_total_requests"
metrics:
- "litellm_proxy_total_requests_metric"
include_labels:
- "api_key_alias"
- "end_user"
- "hashed_api_key"
- "requested_model"
- "route"
- "status_code"
- "team"
- "team_alias"
- "user"
- "user_email"
- group: "proxy_failed_requests"
metrics:
- "litellm_proxy_failed_requests_metric"
include_labels:
- "api_key_alias"
- "end_user"
- "exception_class"
- "exception_status"
- "hashed_api_key"
- "requested_model"
- "route"
- "team"
- "team_alias"
- "user"
- "user_email"
- group: "latency_metrics"
metrics:
- "litellm_request_total_latency_metric"
- "litellm_llm_api_latency_metric"
include_labels:
- "api_key_alias"
- "end_user"
- "hashed_api_key"
- "model"
- "requested_model"
- "team"
- "team_alias"
- "user"
- group: "token_metrics"
metrics:
- "litellm_input_tokens_metric"
- "litellm_output_tokens_metric"
- "litellm_total_tokens_metric"
include_labels:
- "end_user"
- "hashed_api_key"
- "api_key_alias"
- "requested_model"
- "team"
- "team_alias"
- "user"
- "model"
- group: "team_budget_metrics"
metrics:
- "litellm_remaining_team_budget_metric"
- "litellm_team_max_budget_metric"
- "litellm_team_budget_remaining_hours_metric"
include_labels:
- "team"
- "team_alias"
- group: "spend_metrics"
metrics:
- "litellm_spend_metric"
include_labels:
- "end_user"
- "hashed_api_key"
- "api_key_alias"
- "model"
- "team"
- "team_alias"
- "user"
- group: "api_key_budget_metrics"
metrics:
- "litellm_api_key_max_budget_metric"
- "litellm_remaining_api_key_budget_metric"
- "litellm_api_key_budget_remaining_hours_metric"
include_labels:
- "hashed_api_key"
- "api_key_alias"
# Note: api_key_rate_limit_metrics and callback_logging_metrics
# are not available in the current LiteLLM version
- group: "deployment_success_responses_metric"
metrics:
- "litellm_deployment_success_responses"
include_labels:
- "requested_model"
- "litellm_model_name"
- "model_id"
- "api_base"
- "api_provider"
- "hashed_api_key"
- "api_key_alias"
- "team"
- "team_alias"
- group: "deployment_failure_responses_metric"
metrics:
- "litellm_deployment_failure_responses"
include_labels:
- "requested_model"
- "litellm_model_name"
- "model_id"
- "api_base"
- "api_provider"
- "hashed_api_key"
- "api_key_alias"
- "team"
- "team_alias"
- "exception_status"
- "exception_class"
- group: "deployment_total_requests_metric"
metrics:
- "litellm_deployment_total_requests"
include_labels:
- "requested_model"
- "litellm_model_name"
- "model_id"
- "api_base"
- "api_provider"
- "hashed_api_key"
- "api_key_alias"
- "team"
- "team_alias"
- group: "provider_rate_limit_metrics"
metrics:
- "litellm_remaining_requests_metric"
- "litellm_remaining_tokens_metric"
include_labels:
- "model_group"
- "api_provider"
- "api_base"
- "litellm_model_name"
- "hashed_api_key"
- "api_key_alias"
- group: "deployment_state_metric"
metrics:
- "litellm_deployment_state"
include_labels:
- "litellm_model_name"
- "model_id"
- "api_base"
- "api_provider"
- group: "deployment_latency_per_output_token_metric"
metrics:
- "litellm_deployment_latency_per_output_token"
include_labels:
- "litellm_model_name"
- "model_id"
- "api_base"
- "api_provider"
- "hashed_api_key"
- "api_key_alias"
- "team"
- "team_alias"
- group: "deployment_cooled_down_metric"
metrics:
- "litellm_deployment_cooled_down"
include_labels:
- "litellm_model_name"
- "model_id"
- "api_base"
- "api_provider"
- group: "fallback_metrics"
metrics:
- "litellm_deployment_successful_fallbacks"
- "litellm_deployment_failed_fallbacks"
include_labels:
- "requested_model"
- "fallback_model"
- "hashed_api_key"
- "api_key_alias"
- "team"
- "team_alias"
- "exception_status"
- "exception_class"
- group: "request_counting_metrics"
metrics:
- "litellm_requests_metric"
include_labels:
- "end_user"
- "hashed_api_key"
- "api_key_alias"
- "model"
- "team"
- "team_alias"
- "user"
- "user_email"
- group: "overhead_latency_metric"
metrics:
- "litellm_overhead_latency_metric"
include_labels:
- "model_group"
- "api_provider"
- "api_base"
- "litellm_model_name"
- "hashed_api_key"
- "api_key_alias"
- group: "time_to_first_token_metric"
metrics:
- "litellm_llm_api_time_to_first_token_metric"
include_labels:
- "model"
- "hashed_api_key"
- "api_key_alias"
- "team"
- "team_alias"
- group: "system_health_metrics"
metrics:
- "litellm_pod_lock_manager_size"
- "litellm_in_memory_daily_spend_update_queue_size"
- "litellm_redis_daily_spend_update_queue_size"
- "litellm_in_memory_spend_update_queue_size"
- "litellm_redis_spend_update_queue_size"
```
:::note
The `prometheus_metrics_config` block controls which labels are emitted per metric group. Labels not listed in `include_labels` will be stripped from the metric series. Ensure all labels used in dashboard panel queries are included in the corresponding group.
:::
**Set up environment variable for OpenTelemetry Collector**
Set the following environment variable:
| Variable | Required | Description |
|:--|:--|:--|
| `SUMOLOGIC_INSTALLATION_TOKEN` | Yes | Installation token used by the `sumologic` extension to register the collector identity with Sumo Logic. Get this from Sumo Logic under **Manage Data > Collection > Collection**. |
**Configure OpenTelemetry Collector**
Create the OpenTelemetry Collector configuration file (`litellm.yaml`) with the following content. This configuration scrapes Prometheus metrics from LiteLLM and forwards them to Sumo Logic:
```yaml
extensions:
sumologic:
installation_token: ${SUMOLOGIC_INSTALLATION_TOKEN}
collector_name: litellm-otel-collector
receivers:
prometheus:
config:
scrape_configs:
- job_name: 'litellm'
scrape_interval: 30s
metrics_path: '/metrics/'
static_configs:
- targets: ['localhost:4000']
processors:
memory_limiter:
check_interval: 1s
limit_mib: 512
resourcedetection/system:
detectors: ["system"]
system:
hostname_sources: ["os"]
resource/common:
attributes:
- key: sumo.datasource
value: litellm-metrics
action: upsert
- key: _sourceCategory
value: otel/litellm/metrics
action: upsert
- key: service.name
value: litellm-proxy
action: upsert
- key: deployment.environment
value: production
action: upsert
resource/sumologic:
attributes:
- key: cloud.availability_zone
action: delete
- key: k8s.pod.uid
action: delete
exporters:
sumologic:
metric_format: prometheus
sending_queue:
queue_size: 2048000
batch:
flush_timeout: 5s
min_size: 2048
service:
extensions: [sumologic]
pipelines:
metrics:
receivers: [prometheus]
processors: [memory_limiter, resourcedetection/system, resource/common, resource/sumologic]
exporters: [sumologic]
```
:::note
- Adjust the `targets` field if LiteLLM runs on a different host or port (default is `localhost:4000`)
- Do not change `_sourceCategory` (`otel/litellm/metrics`) or `deployment.environment` values unless you modify dashboard template variables
- The collector saves credentials in `/root/.sumologic-otel-collector`. Persist this directory across restarts
:::
This configuration file will be placed in the appropriate directory based on your platform in Step 3.
### Step 3: Send logs and metrics to Sumo Logic
import LogsIntro from '../../reuse/apps/opentelemetry/send-logs-intro.md';
import Tabs from '@theme/Tabs';
import TabItem from '@theme/TabItem';
1. Create the OTel collector configuration file at `/etc/otelcol-sumo/conf.d/litellm.yaml` with the configuration provided in Step 2.
2. Restart the collector using:
```sh
sudo systemctl restart otelcol-sumo
```
1. Create the OTel collector configuration file at `C:\ProgramData\Sumo Logic\OpenTelemetry Collector\config\conf.d\litellm.yaml` with the configuration provided in Step 2.
2. Restart the collector using:
```sh
Restart-Service -Name OtelcolSumo
```
1. Create the OTel collector configuration file at `/etc/otelcol-sumo/conf.d/litellm.yaml` with the configuration provided in Step 2.
2. Restart the otelcol-sumo process using the below command:
```sh
otelcol-sumo --config /etc/otelcol-sumo/sumologic.yaml --config "glob:/etc/otelcol-sumo/conf.d/*.yaml"
```
import ChefEnv from '../../reuse/apps/opentelemetry/chef-with-env.md';
import AnsEnv from '../../reuse/apps/opentelemetry/ansible-with-env.md';
import PuppetEnv from '../../reuse/apps/opentelemetry/puppet-with-env.md';
import LogsOutro from '../../reuse/apps/opentelemetry/send-logs-outro.md';
## Viewing the LiteLLM dashboards
All dashboards have a set of filters that you can apply to the entire dashboard. Use these filters to drill down and examine the data to a granular level. You can change the time range for a dashboard or panel by selecting a predefined interval from a drop-down list, choosing a recently used time range, or specifying custom dates and times. Learn more.
You can use template variables to drill down and examine the data on a granular level. For more information, see [Filtering Dashboards with Template Variables](/docs/dashboards/filter-template-variables/).
Most Next-Gen apps allow you to provide the scope at the installation time and are comprised of a key (`_sourceCategory` by default) and a default value for this key. Based on your input, the app dashboards will be parameterized with a dashboard variable, allowing you to change the dataset queried by all panels. This eliminates the need to create multiple copies of the same dashboard with different queries.
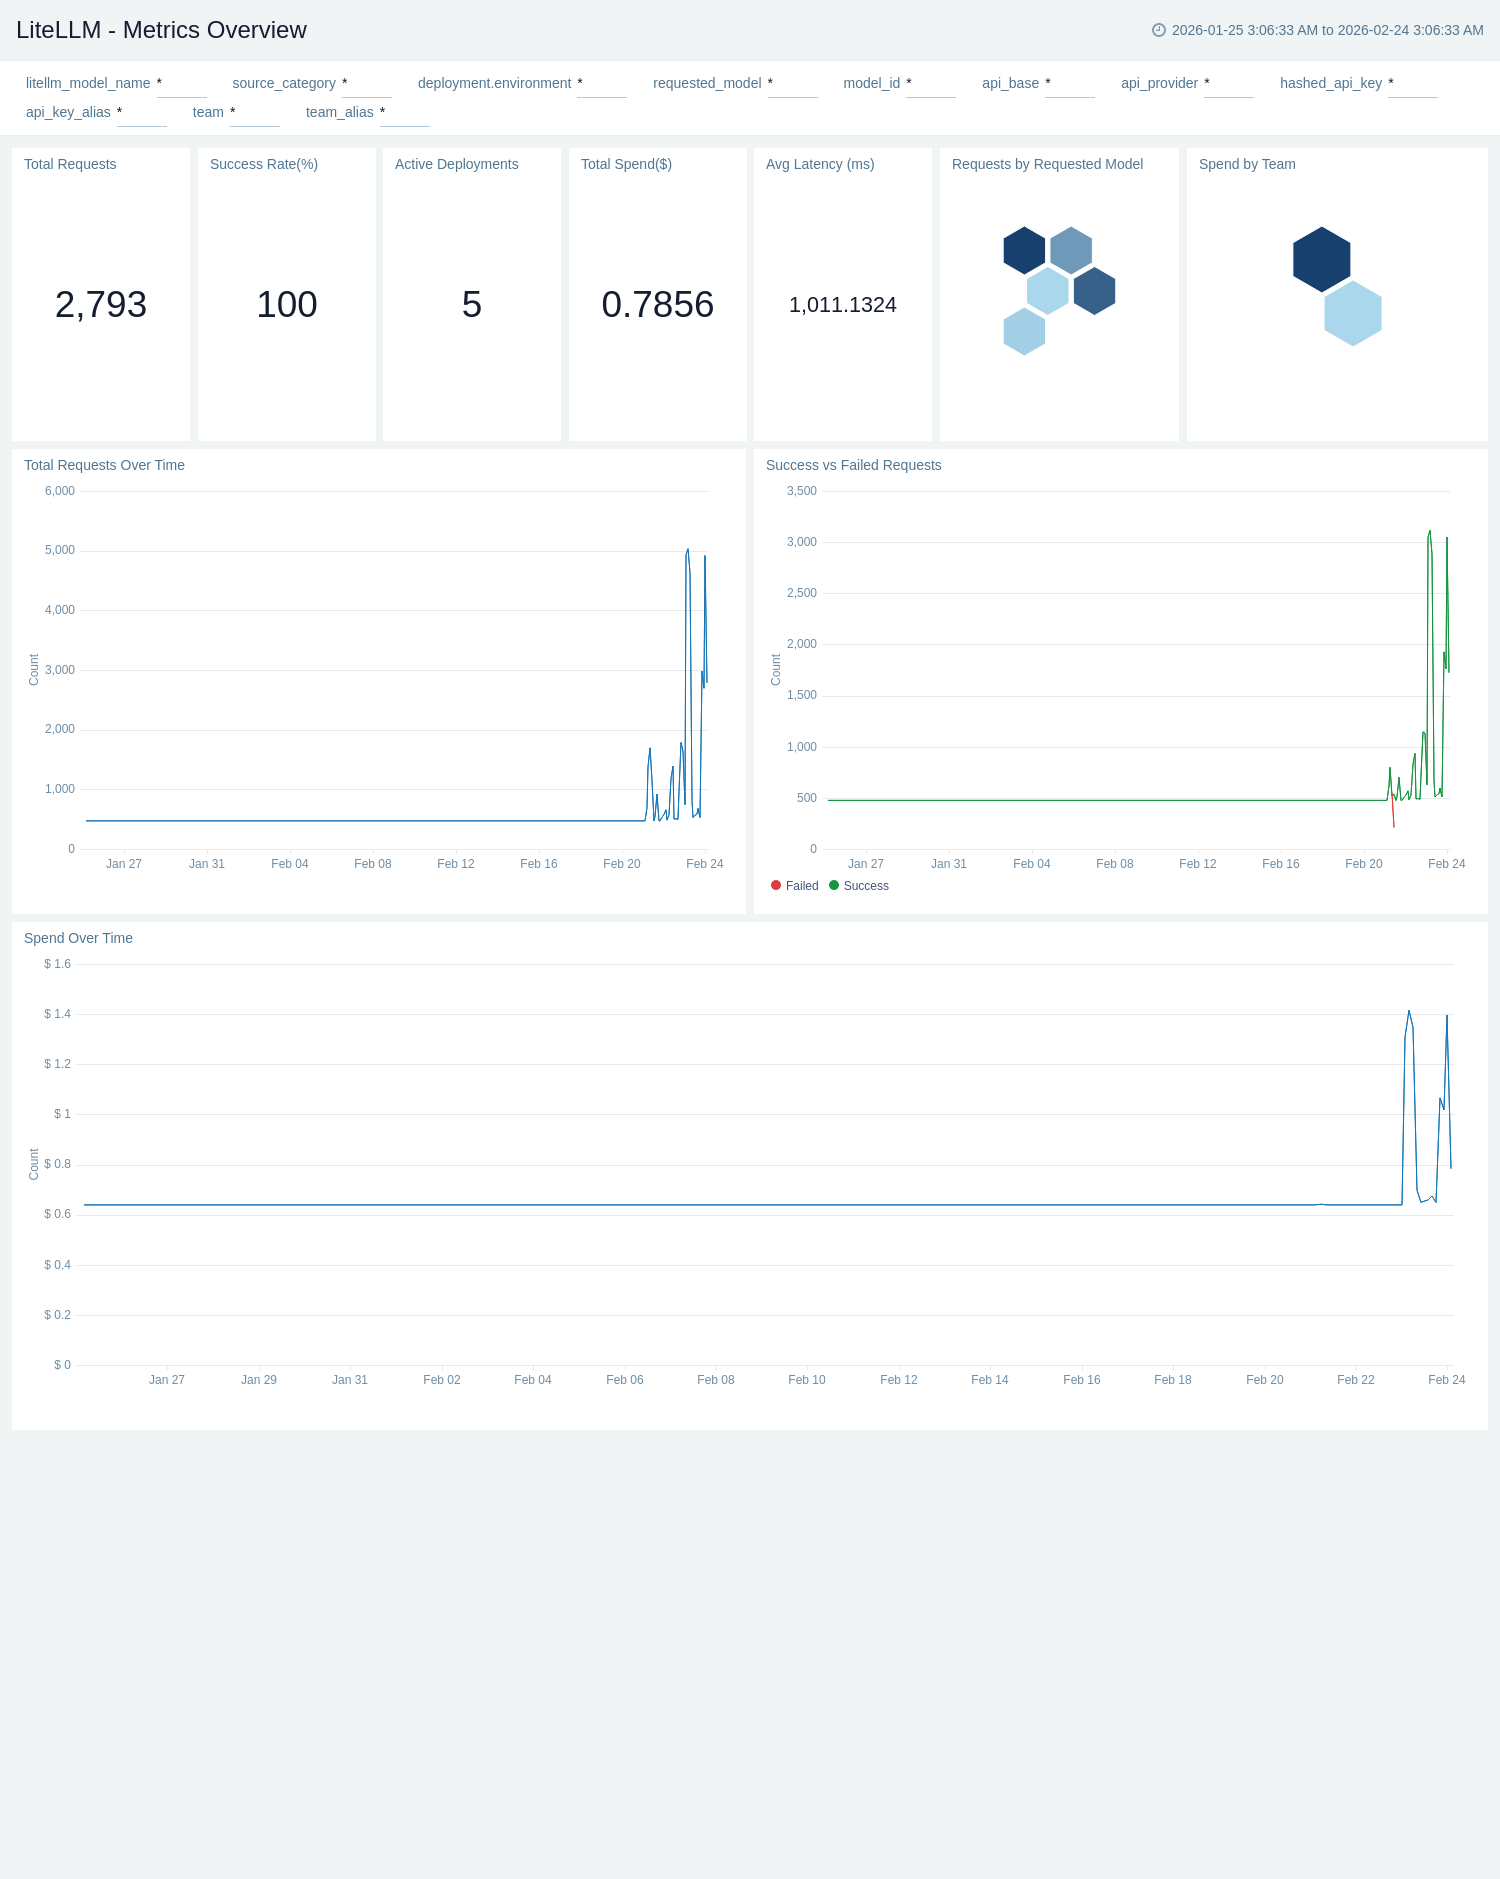
### Metrics Overview
The **LiteLLM - Metrics Overview** dashboard provides a high-level summary of proxy health and usage from Prometheus metrics. Single-value panels give instant visibility into total requests, failed requests, active teams, active API keys, and active models. The Requests by Requested Model and Spend by Team honeycomb panels let you compare request volume and cost distribution at a glance. Time-series views for requests over time and failed requests over time surface usage trends and anomalies across the selected period.
 ### Proxy Health and Performance
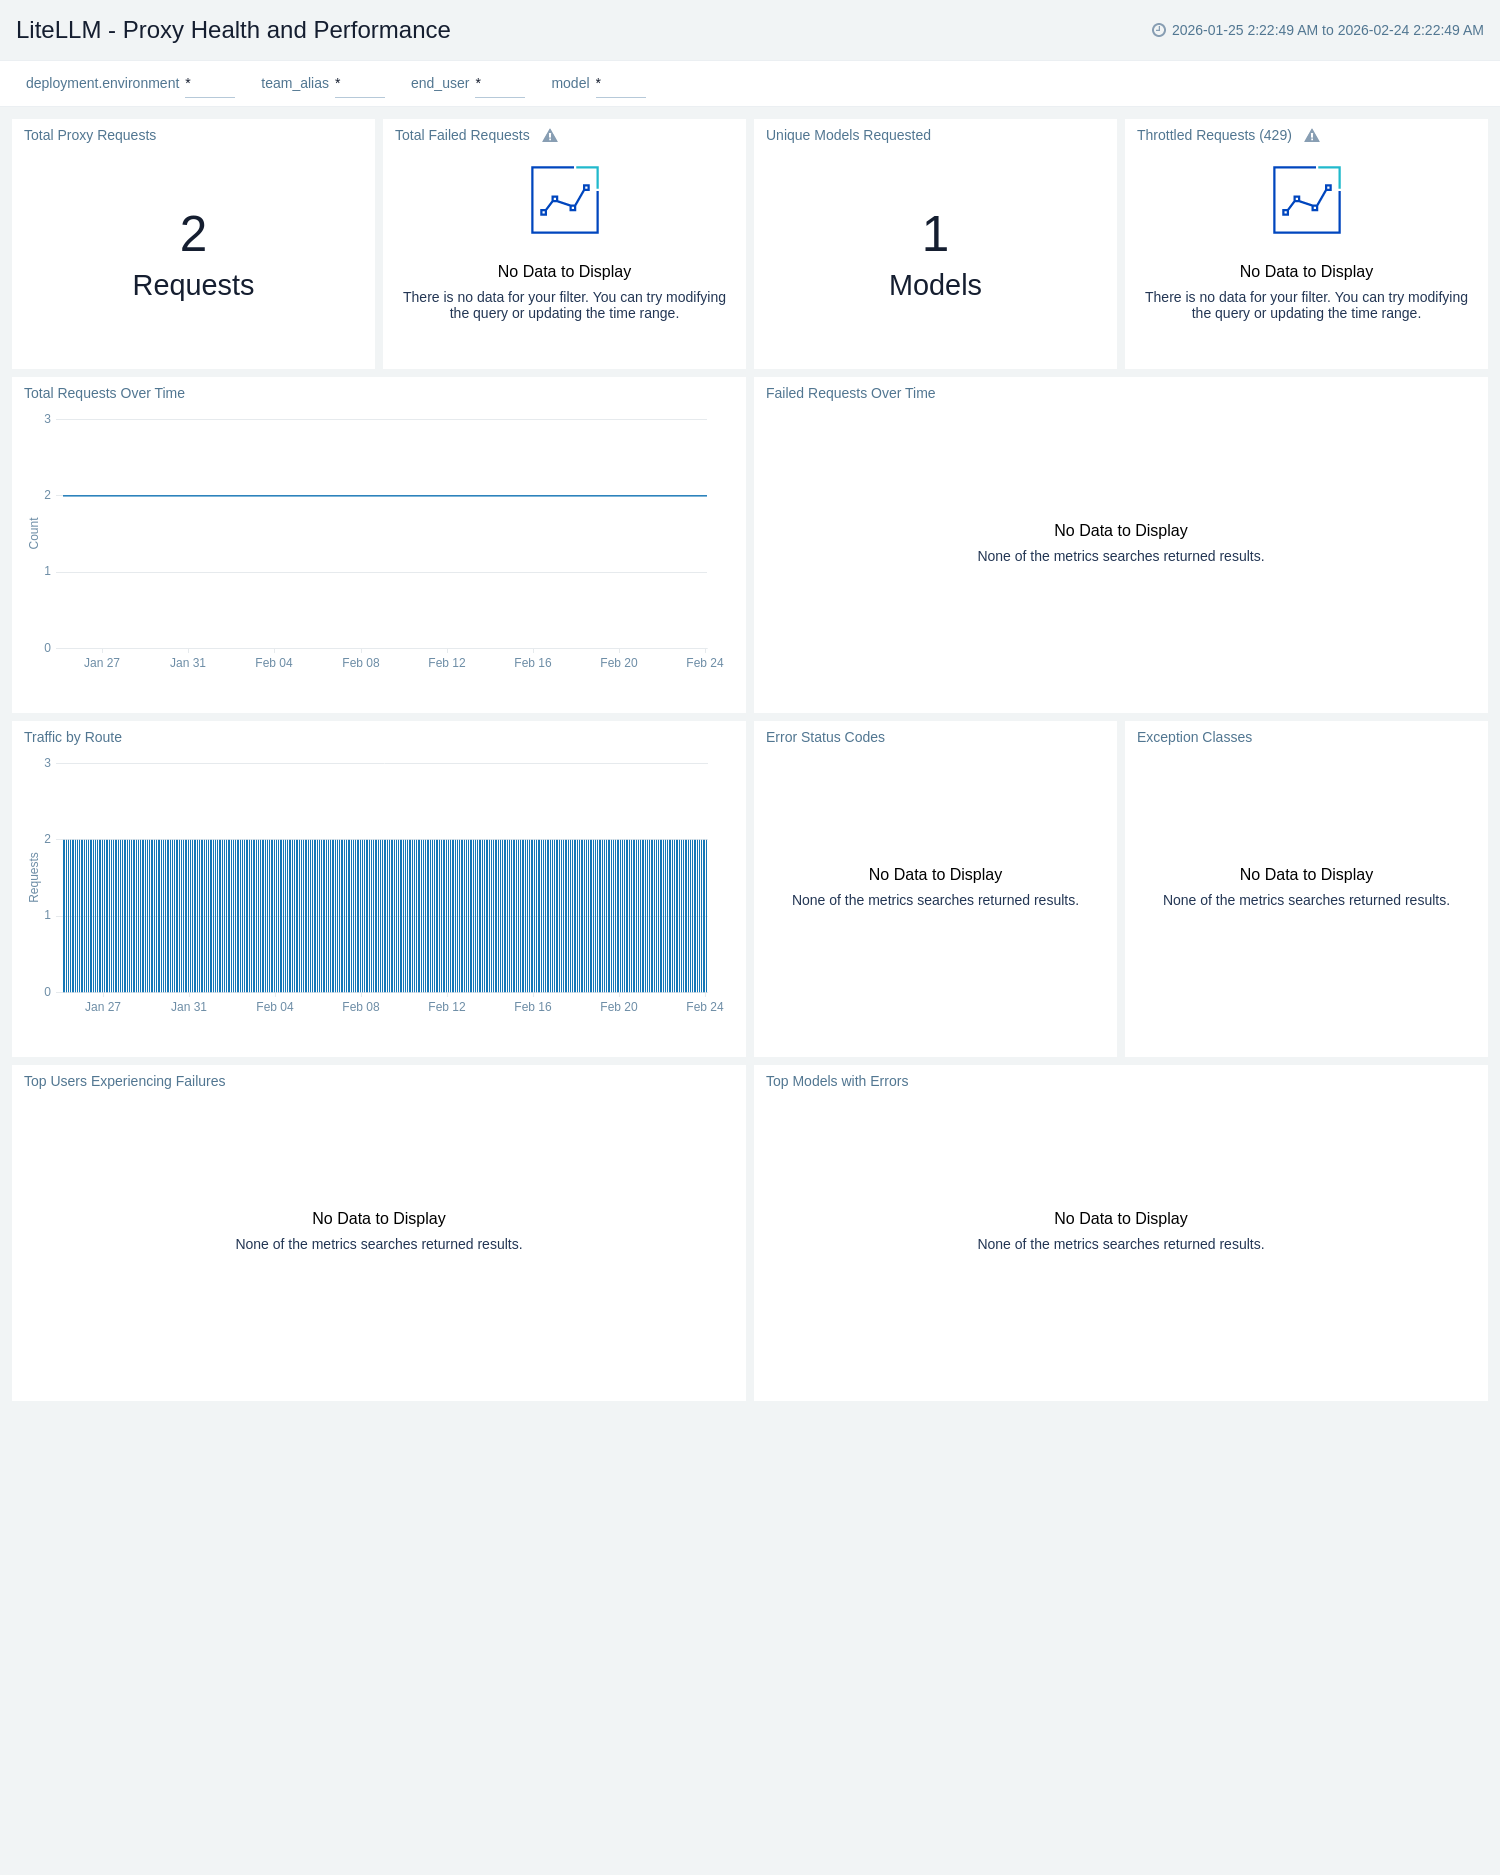
The **LiteLLM - Proxy Health and Performance** dashboard provides operational visibility into proxy request health filtered by deployment environment, team, end user, and model. Total Requests Over Time and Failed Requests Over Time track throughput and failure trends side by side, while Traffic by Route surfaces which API paths (for example, `/chat/completions`, `/embeddings`) drive the most load. This dashboard is the primary starting point for detecting spikes, degraded success rates, or unexpected traffic patterns across routes.
### Proxy Health and Performance
The **LiteLLM - Proxy Health and Performance** dashboard provides operational visibility into proxy request health filtered by deployment environment, team, end user, and model. Total Requests Over Time and Failed Requests Over Time track throughput and failure trends side by side, while Traffic by Route surfaces which API paths (for example, `/chat/completions`, `/embeddings`) drive the most load. This dashboard is the primary starting point for detecting spikes, degraded success rates, or unexpected traffic patterns across routes.
 ### Latency and Performance
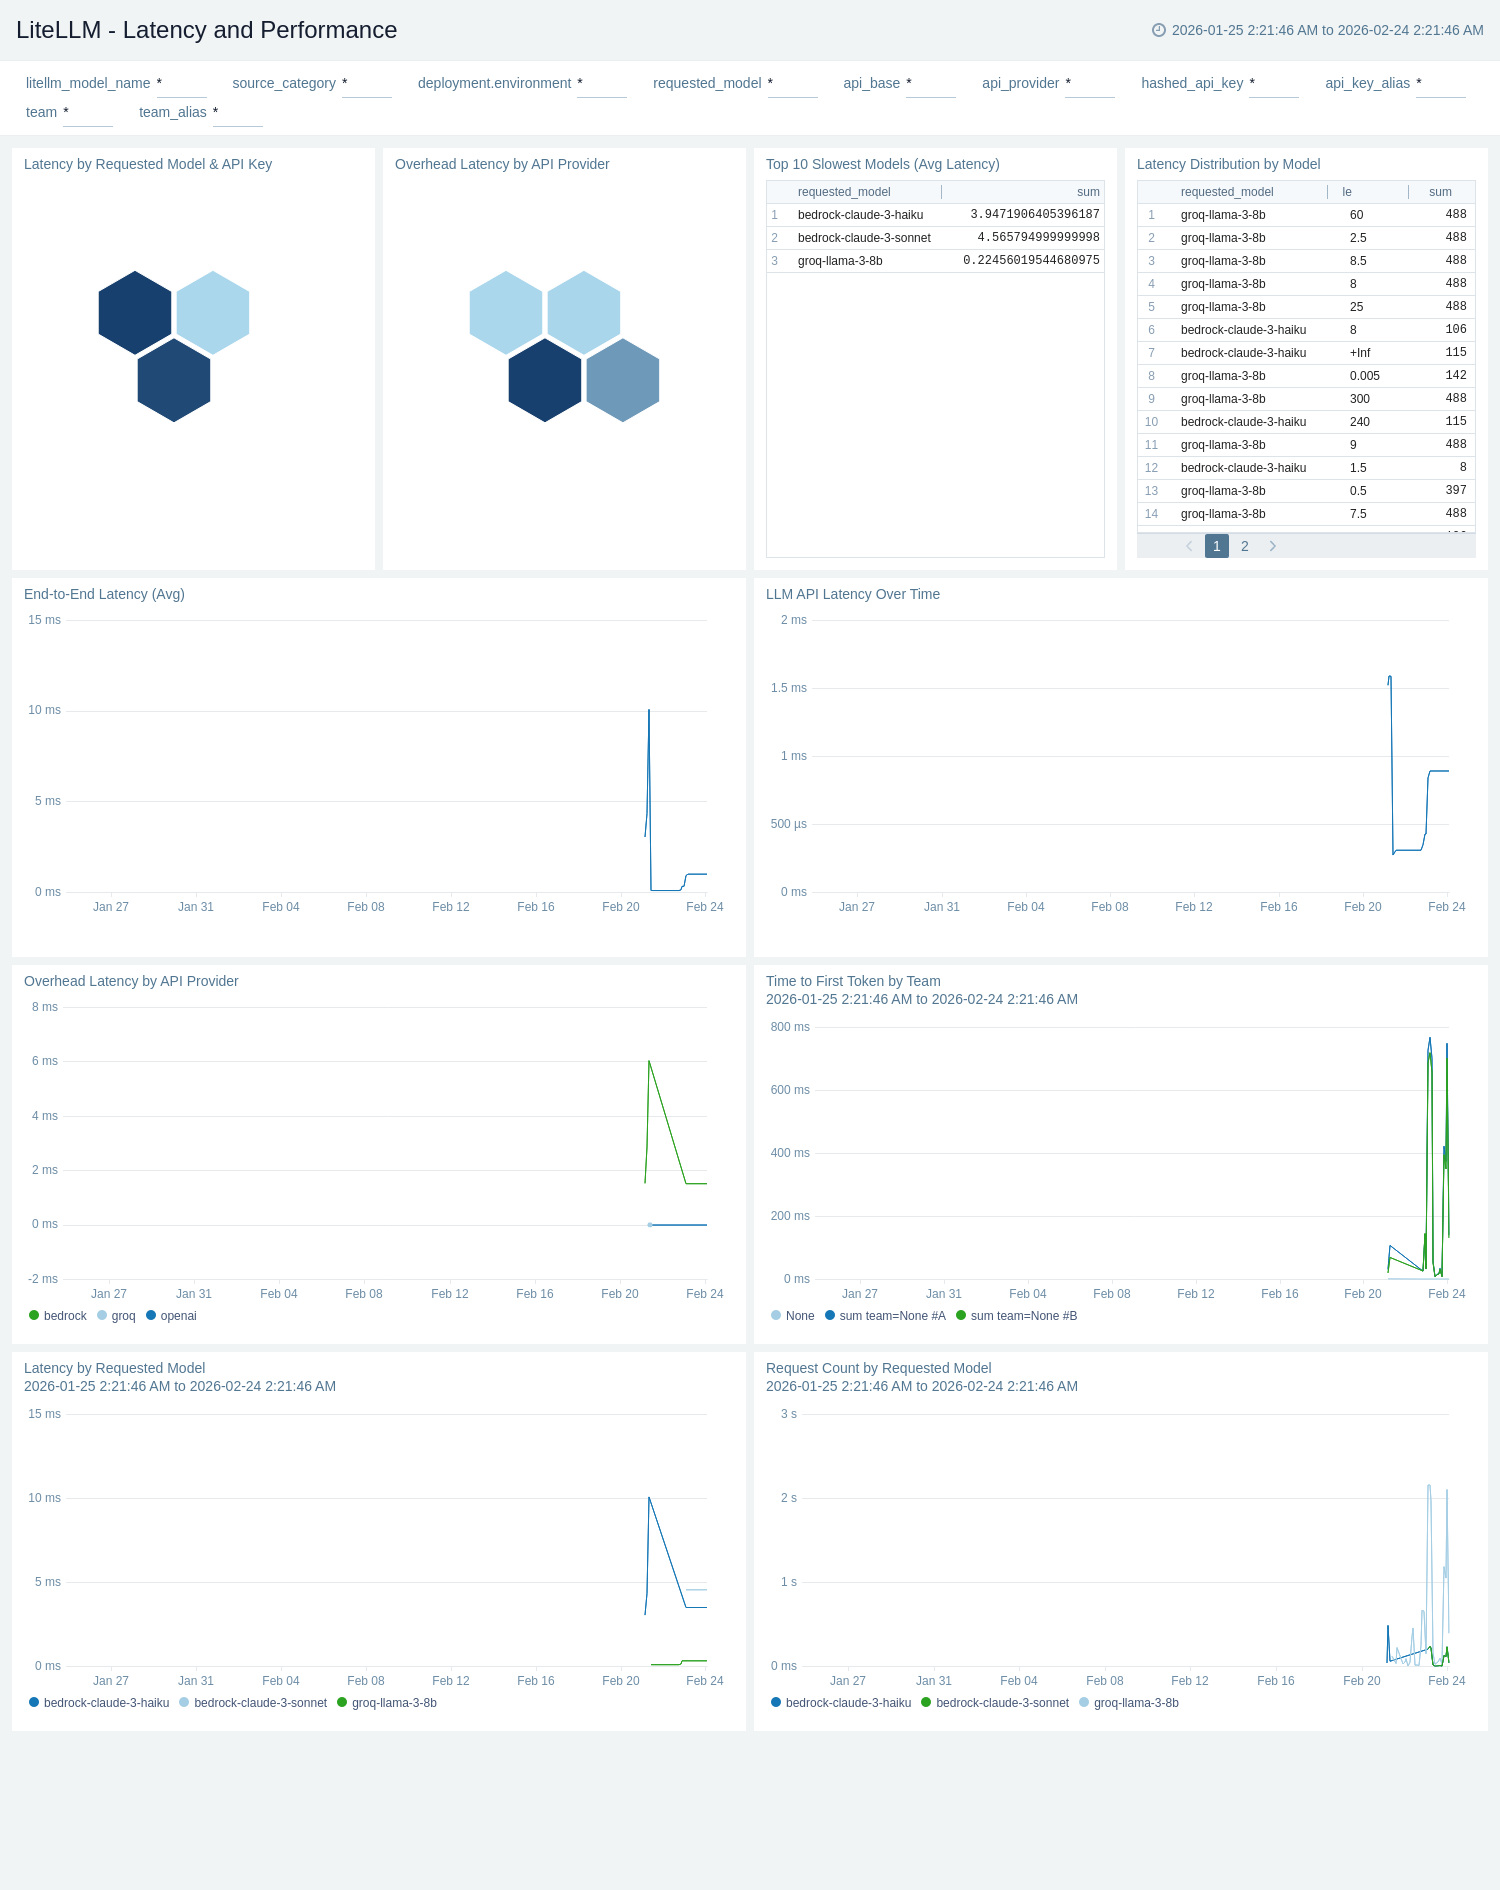
The **LiteLLM - Latency and Performance** dashboard provides a deep dive into request latency, time to first token (TTFT), and LLM API latency. LLM API Latency Over Time and Latency by Requested Model track end-to-end and provider latency trends across the selected period. Time to First Token by Team measures streaming responsiveness per team, which is critical for interactive use cases. Request Count by Requested Model shows traffic distribution, while the Top 10 Slowest Models (Avg Latency) table helps pinpoint models that consistently contribute to slow responses and SLA breaches.
### Latency and Performance
The **LiteLLM - Latency and Performance** dashboard provides a deep dive into request latency, time to first token (TTFT), and LLM API latency. LLM API Latency Over Time and Latency by Requested Model track end-to-end and provider latency trends across the selected period. Time to First Token by Team measures streaming responsiveness per team, which is critical for interactive use cases. Request Count by Requested Model shows traffic distribution, while the Top 10 Slowest Models (Avg Latency) table helps pinpoint models that consistently contribute to slow responses and SLA breaches.
 ### Budget and Rate Limits
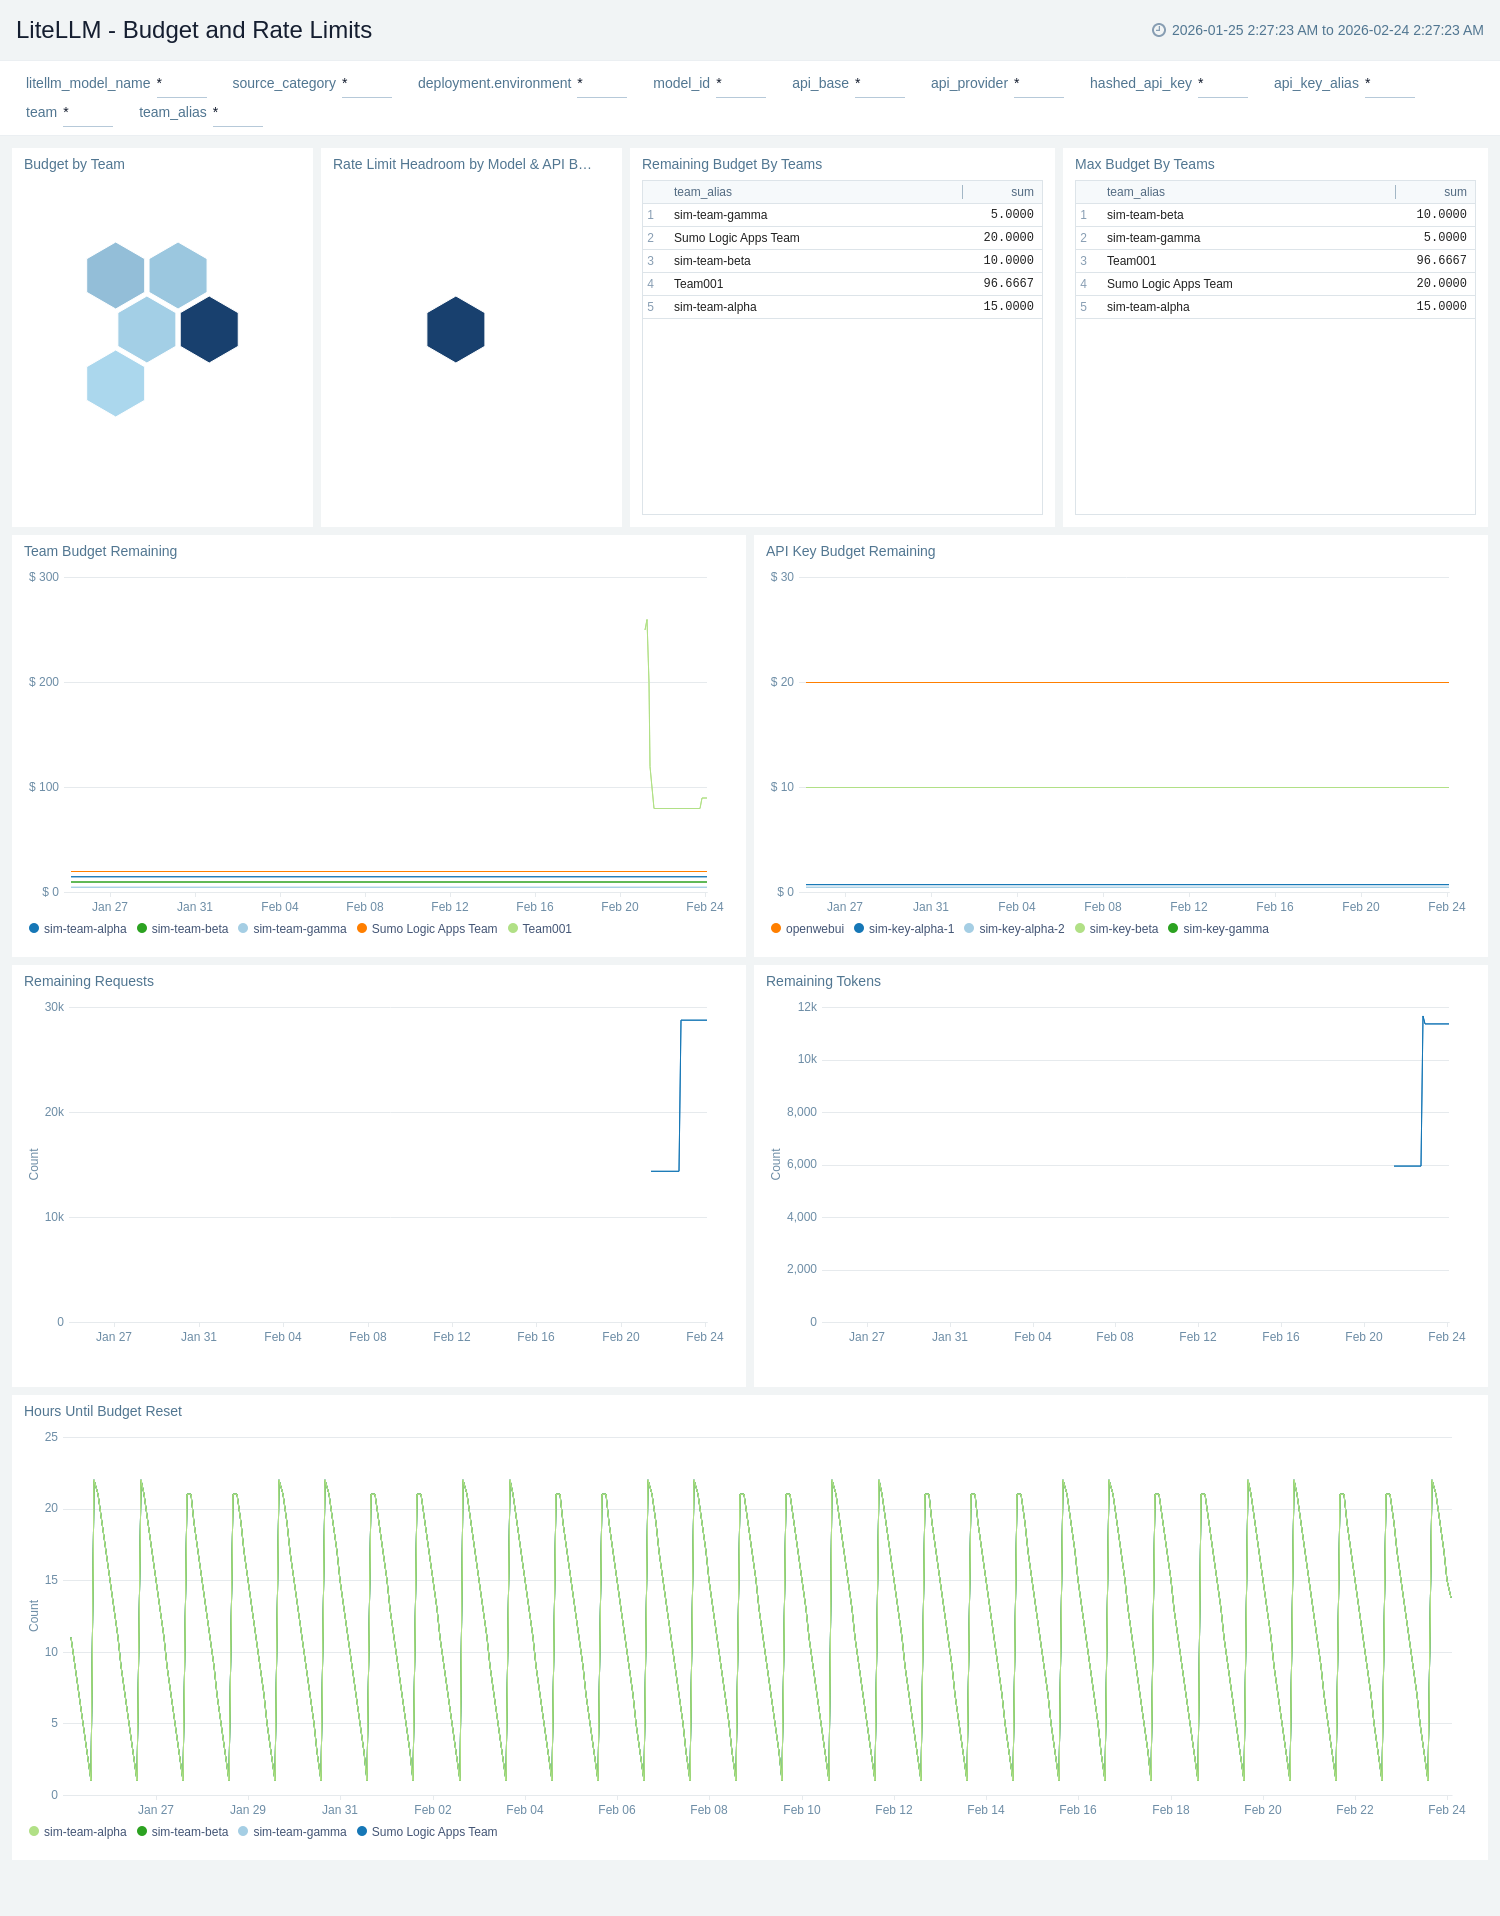
The **LiteLLM - Budget and Rate Limits** dashboard provides visibility into remaining budgets and provider-side rate limits. The Budget by Team and Rate Limit Headroom by Model & API Base honeycomb panels give instant color-coded health of budget and rate limit status across teams and models. Team Budget Remaining and API Key Budget Remaining time-series panels track available spend over time, and Hours Until Budget Reset surfaces upcoming resets before limits are exhausted. Remaining Budget By Teams and Max Budget By Teams tables give a ranked view for governance. Remaining Requests and Remaining Tokens track provider rate limit headroom sourced from upstream response headers.
### Budget and Rate Limits
The **LiteLLM - Budget and Rate Limits** dashboard provides visibility into remaining budgets and provider-side rate limits. The Budget by Team and Rate Limit Headroom by Model & API Base honeycomb panels give instant color-coded health of budget and rate limit status across teams and models. Team Budget Remaining and API Key Budget Remaining time-series panels track available spend over time, and Hours Until Budget Reset surfaces upcoming resets before limits are exhausted. Remaining Budget By Teams and Max Budget By Teams tables give a ranked view for governance. Remaining Requests and Remaining Tokens track provider rate limit headroom sourced from upstream response headers.
 ### Deployment and Fallback Health
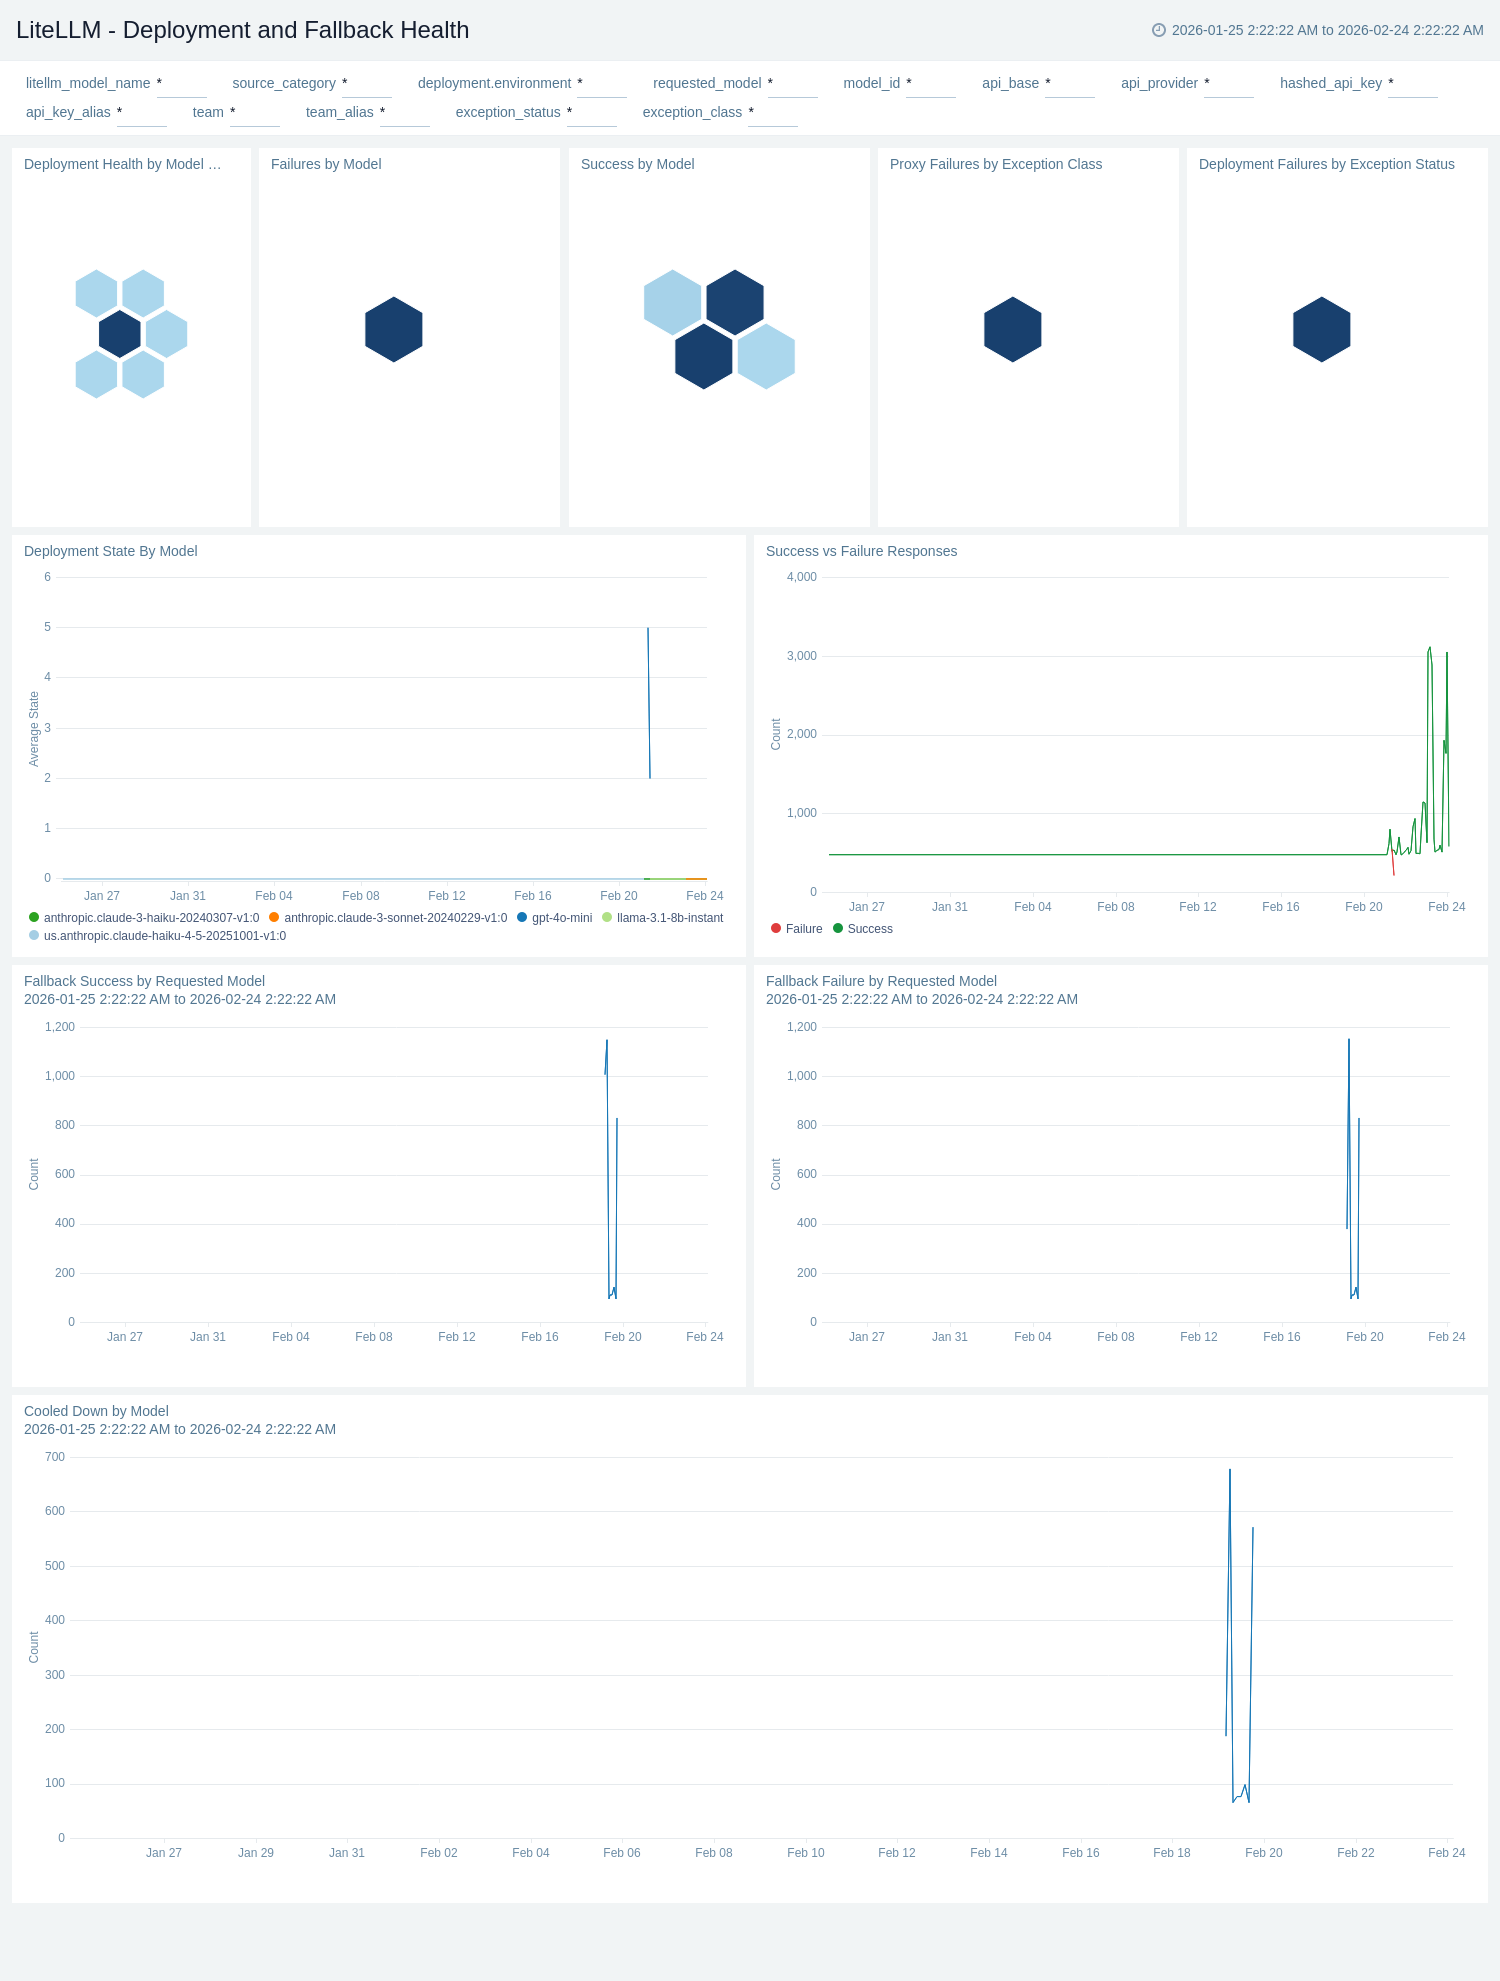
The **LiteLLM - Deployment and Fallback Health** dashboard monitors the health of individual LLM deployments and the effectiveness of fallback routing. The Deployment Health by Model & Provider honeycomb panel provides a color-coded status view across all deployments, while Deployment State By Model tracks health state (0 = healthy, 1 = partial, 2 = outage) over time. Success vs Failure Responses compares response outcomes, and Fallback Success by Requested Model and Fallback Failure by Requested Model show whether the router successfully recovered from primary failures. Proxy Failures by Exception Class and Deployment Failures by Exception Status break down failure root causes. Cooled Down by Model tracks deployments that have recently recovered from a cooldown period.
### Deployment and Fallback Health
The **LiteLLM - Deployment and Fallback Health** dashboard monitors the health of individual LLM deployments and the effectiveness of fallback routing. The Deployment Health by Model & Provider honeycomb panel provides a color-coded status view across all deployments, while Deployment State By Model tracks health state (0 = healthy, 1 = partial, 2 = outage) over time. Success vs Failure Responses compares response outcomes, and Fallback Success by Requested Model and Fallback Failure by Requested Model show whether the router successfully recovered from primary failures. Proxy Failures by Exception Class and Deployment Failures by Exception Status break down failure root causes. Cooled Down by Model tracks deployments that have recently recovered from a cooldown period.
 ### Infrastructure and Callbacks
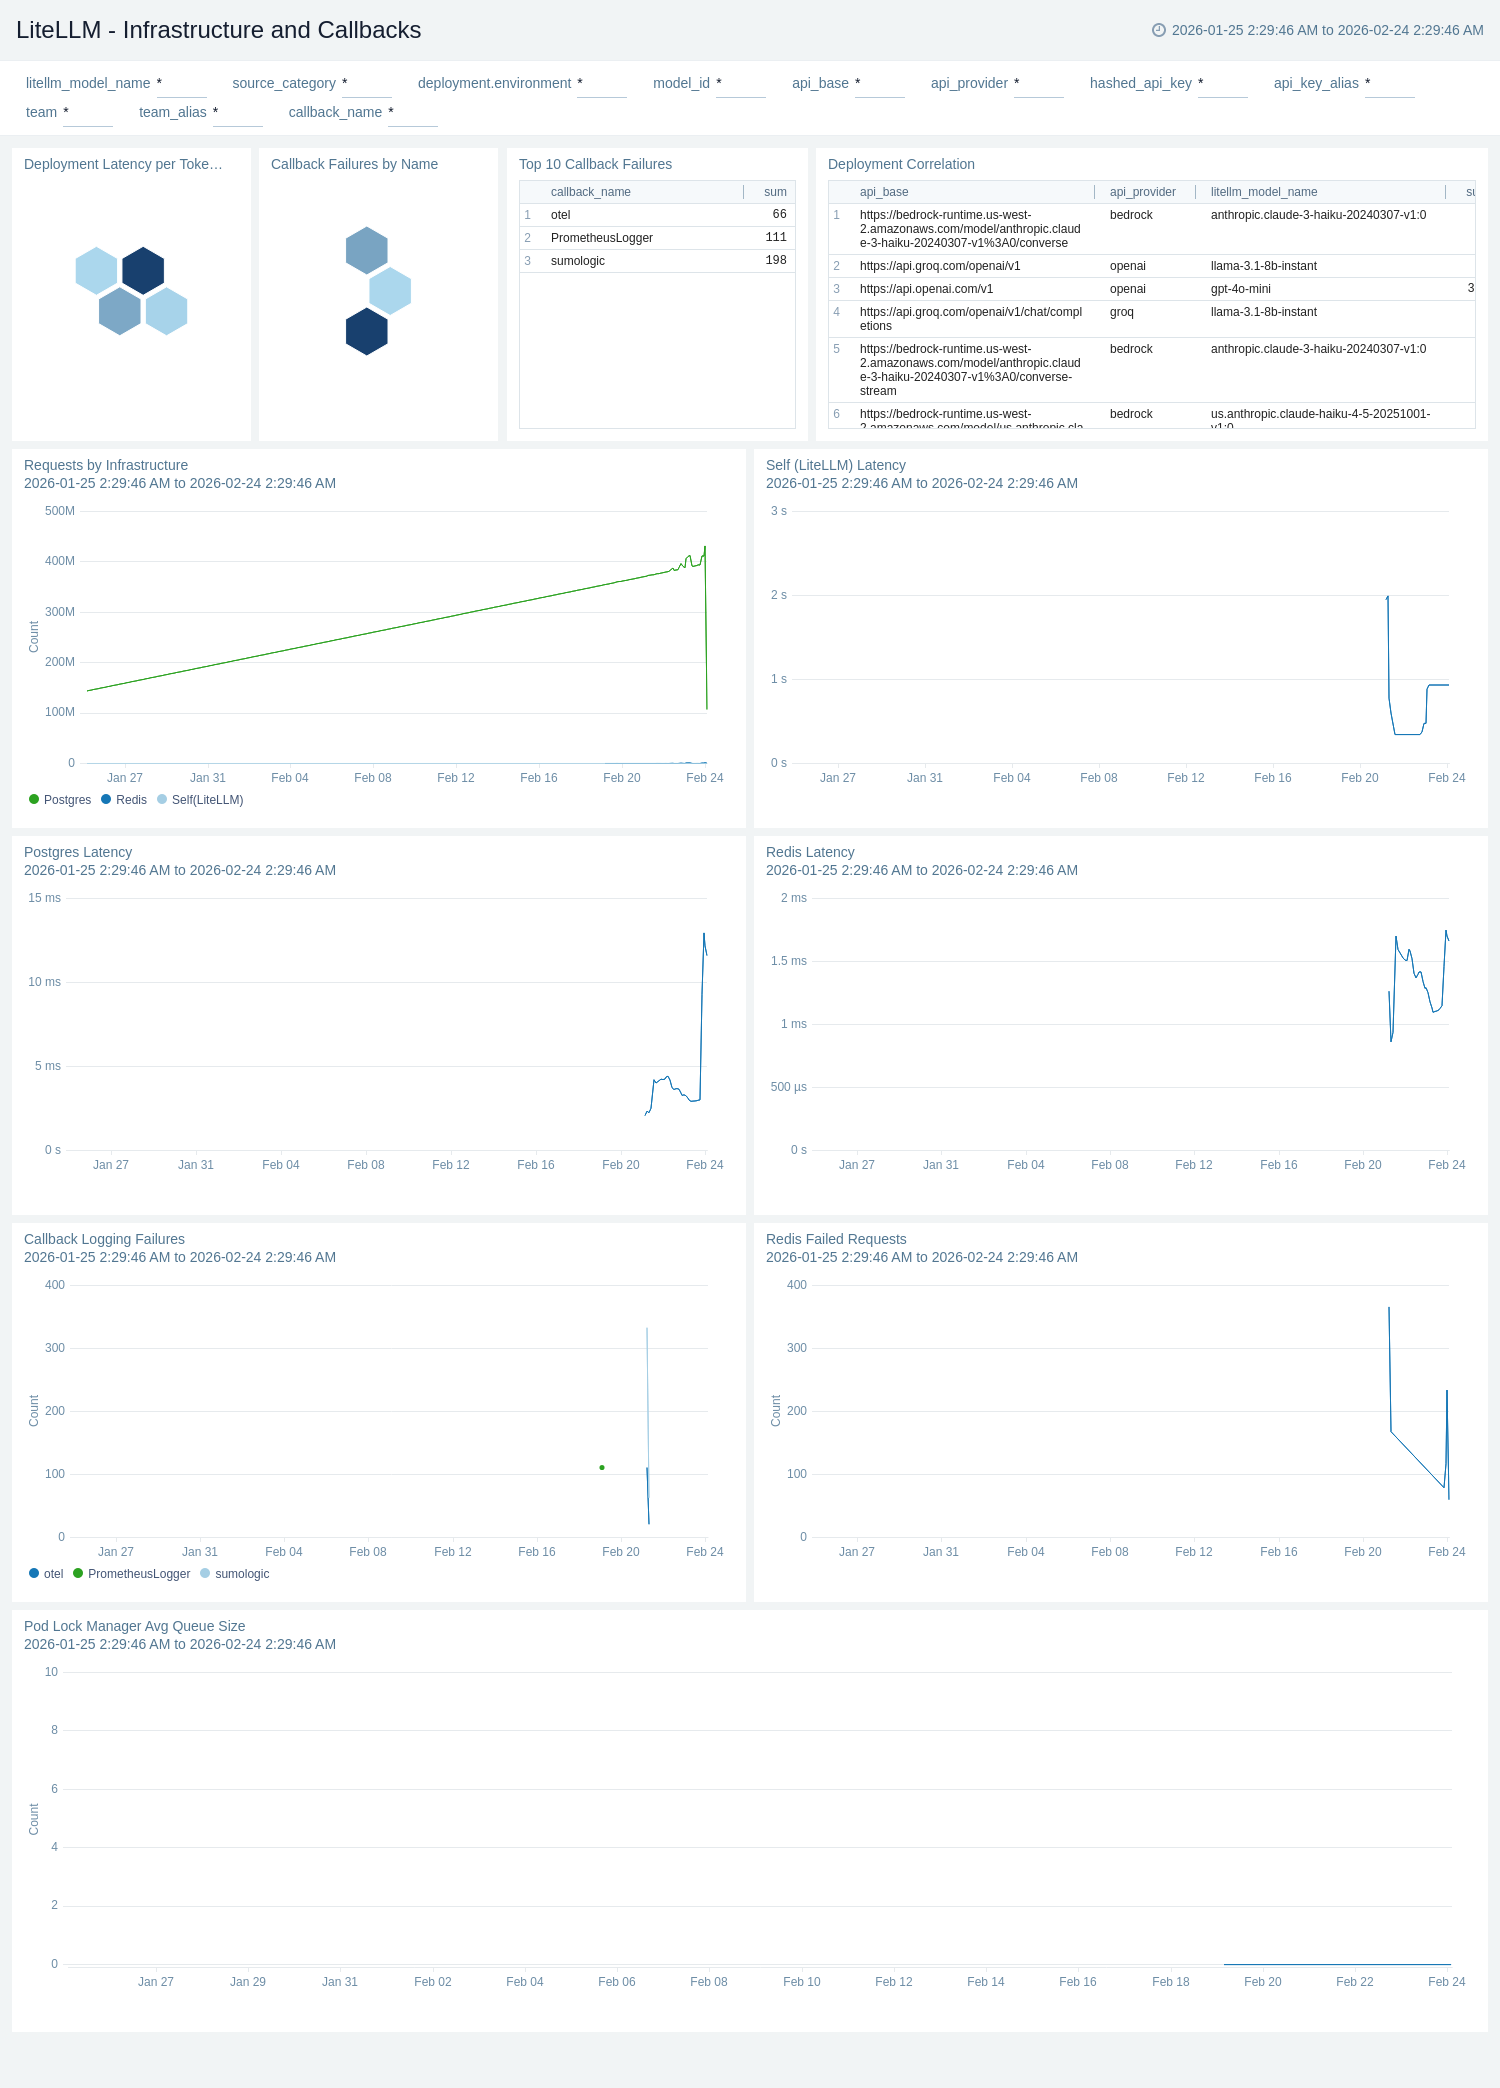
The **LiteLLM - Infrastructure and Callbacks** dashboard provides visibility into the supporting services and callback integrations that underpin LiteLLM's operation. Redis Latency, Postgres Latency, and LiteLLM Self Latency panels track dependency health over time. Redis Failed Requests and Callback Logging Failures surface error conditions in caching and observability pipelines. Queue size panels for the Pod Lock Manager Queue, In-Memory Spend Update Queue, and Redis Spend Update Queue serve as backpressure indicators that signal whether the system is keeping up with spend tracking workloads. The Deployment Correlation table maps each model to its provider and API base, giving operators a fast reference for routing topology.
### Infrastructure and Callbacks
The **LiteLLM - Infrastructure and Callbacks** dashboard provides visibility into the supporting services and callback integrations that underpin LiteLLM's operation. Redis Latency, Postgres Latency, and LiteLLM Self Latency panels track dependency health over time. Redis Failed Requests and Callback Logging Failures surface error conditions in caching and observability pipelines. Queue size panels for the Pod Lock Manager Queue, In-Memory Spend Update Queue, and Redis Spend Update Queue serve as backpressure indicators that signal whether the system is keeping up with spend tracking workloads. The Deployment Correlation table maps each model to its provider and API base, giving operators a fast reference for routing topology.
 ### Cost Analytics
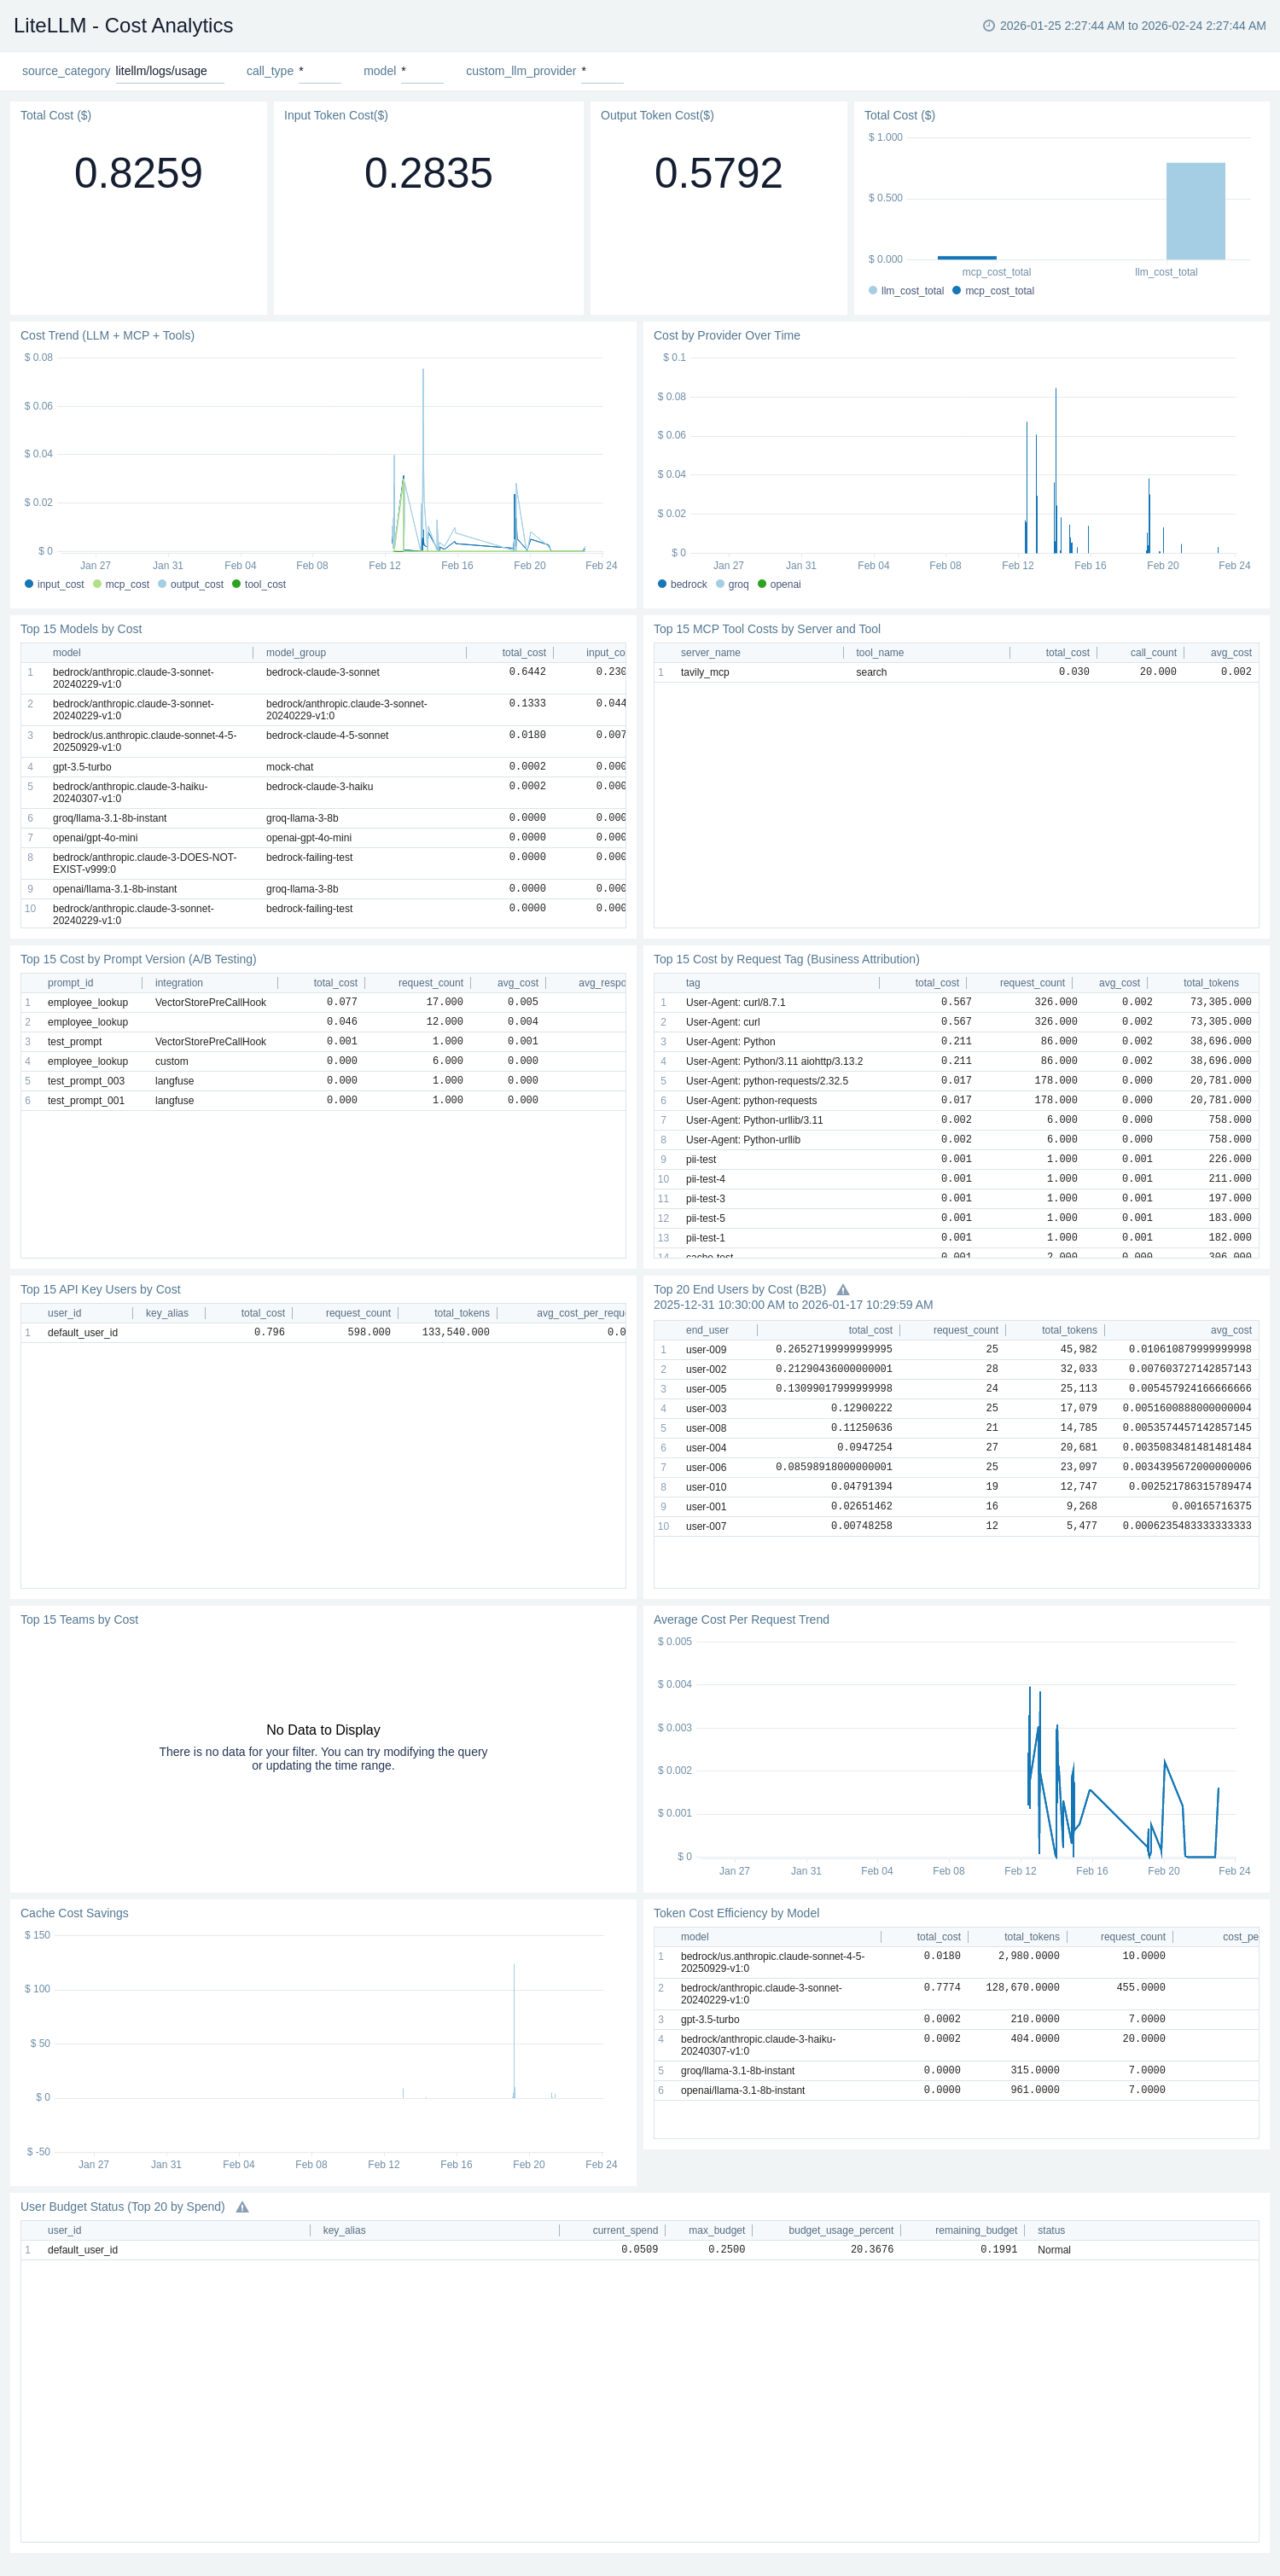
The **LiteLLM - Cost Analytics** dashboard provides comprehensive cost tracking sourced from LiteLLM request logs. Single-value panels for Total Cost ($), Input Token Cost ($), and Output Token Cost ($) give instant spend visibility. Cost Trend (LLM + MCP + Tools) breaks spend into input, output, tool, and MCP cost components over time, while Cost by Provider Over Time shows which LLM providers drive spending. Top 15 Models by Cost, Top 15 Teams by Cost, Top 15 API Key Users by Cost, and Top 20 End Users by Cost (B2B) tables provide ranked attribution for chargeback and governance. Top 15 Cost by Prompt Version (A/B Testing) and Top 15 MCP Tool Costs by Server and Tool enable prompt and tooling cost comparison. Token Cost Efficiency by Model surfaces cost per million tokens, Cache Cost Savings tracks cost avoided through cache hits, and User Budget Status monitors budget consumption per API key user.
### Cost Analytics
The **LiteLLM - Cost Analytics** dashboard provides comprehensive cost tracking sourced from LiteLLM request logs. Single-value panels for Total Cost ($), Input Token Cost ($), and Output Token Cost ($) give instant spend visibility. Cost Trend (LLM + MCP + Tools) breaks spend into input, output, tool, and MCP cost components over time, while Cost by Provider Over Time shows which LLM providers drive spending. Top 15 Models by Cost, Top 15 Teams by Cost, Top 15 API Key Users by Cost, and Top 20 End Users by Cost (B2B) tables provide ranked attribution for chargeback and governance. Top 15 Cost by Prompt Version (A/B Testing) and Top 15 MCP Tool Costs by Server and Tool enable prompt and tooling cost comparison. Token Cost Efficiency by Model surfaces cost per million tokens, Cache Cost Savings tracks cost avoided through cache hits, and User Budget Status monitors budget consumption per API key user.
 ### Error Analysis and Debugging
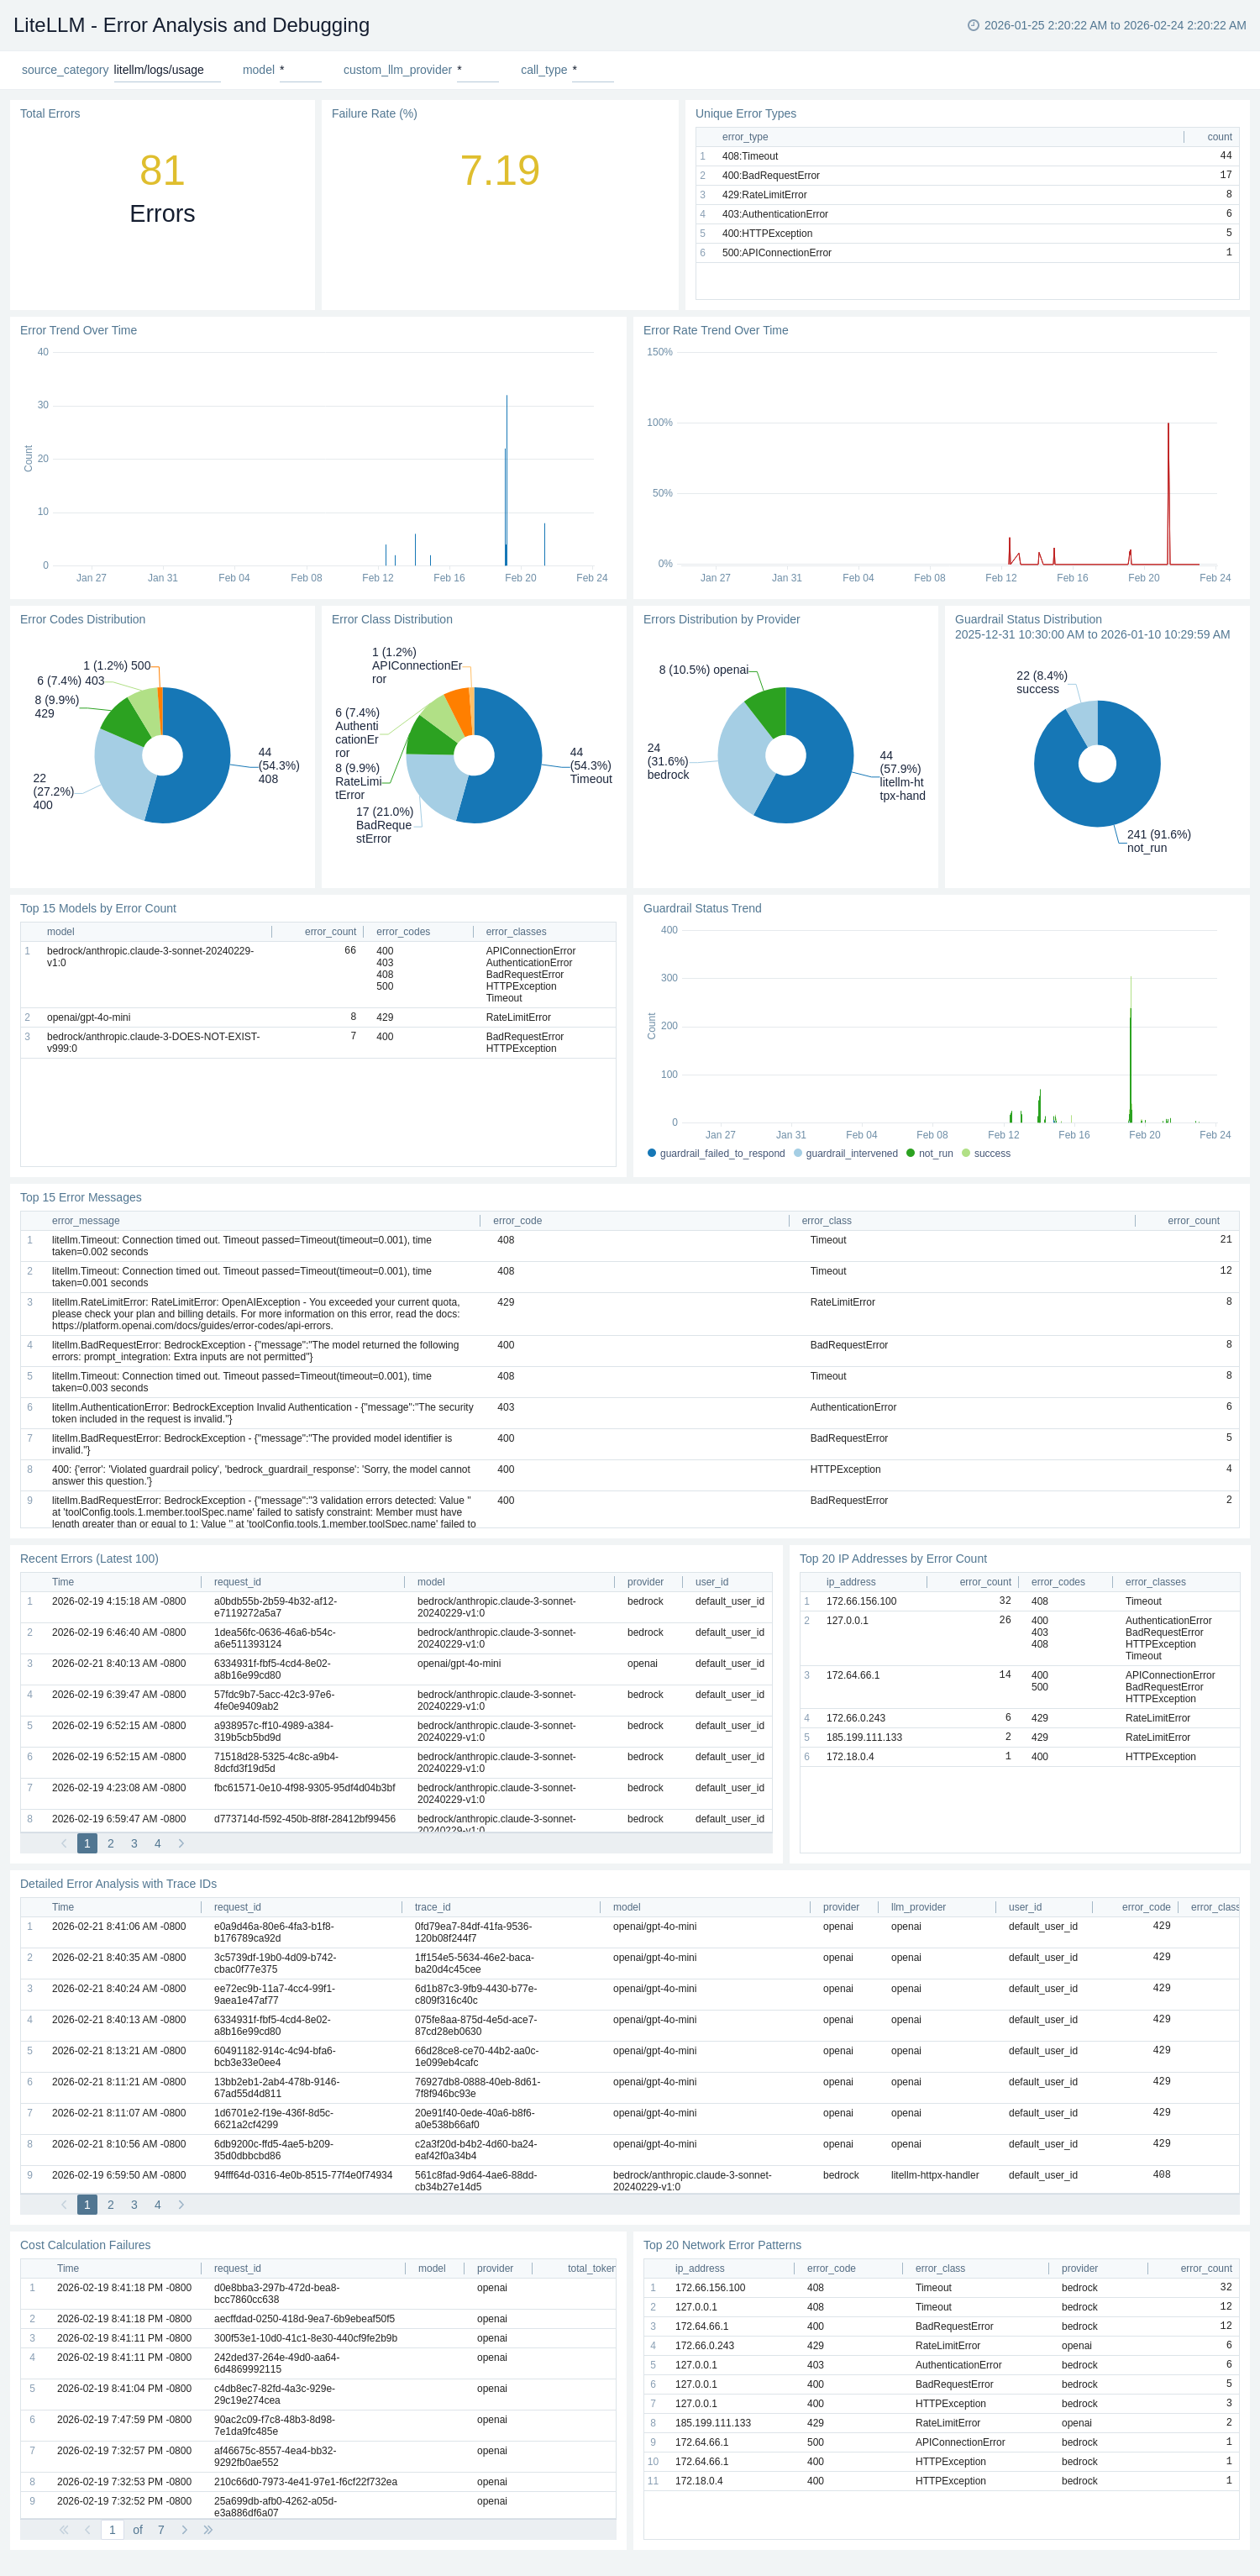
The **LiteLLM - Error Analysis and Debugging** dashboard provides comprehensive error tracking sourced from LiteLLM request logs. Total Errors and Failure Rate (%) single-value panels give instant error visibility. Error Trend Over Time and Error Rate Trend Over Time track failure volume and percentage trends. Error Codes Distribution and Error Class Distribution pie charts identify the most common failure categories, while Errors Distribution by Provider breaks down failures by upstream LLM provider. Top 15 Models by Error Count and Top 15 Error Messages tables surface the highest-impact models and error strings. Recent Errors (Latest 100) and Detailed Error Analysis with Trace IDs tables support active debugging with distributed trace correlation. Guardrail Status Distribution and Guardrail Status Trend monitor guardrail execution outcomes, and Top 20 IP Addresses by Error Count and Top 20 Network Error Patterns support network-level security and connectivity debugging. Cost Calculation Failures surfaces requests where cost attribution failed.
### Error Analysis and Debugging
The **LiteLLM - Error Analysis and Debugging** dashboard provides comprehensive error tracking sourced from LiteLLM request logs. Total Errors and Failure Rate (%) single-value panels give instant error visibility. Error Trend Over Time and Error Rate Trend Over Time track failure volume and percentage trends. Error Codes Distribution and Error Class Distribution pie charts identify the most common failure categories, while Errors Distribution by Provider breaks down failures by upstream LLM provider. Top 15 Models by Error Count and Top 15 Error Messages tables surface the highest-impact models and error strings. Recent Errors (Latest 100) and Detailed Error Analysis with Trace IDs tables support active debugging with distributed trace correlation. Guardrail Status Distribution and Guardrail Status Trend monitor guardrail execution outcomes, and Top 20 IP Addresses by Error Count and Top 20 Network Error Patterns support network-level security and connectivity debugging. Cost Calculation Failures surfaces requests where cost attribution failed.
 ### Security and Compliance
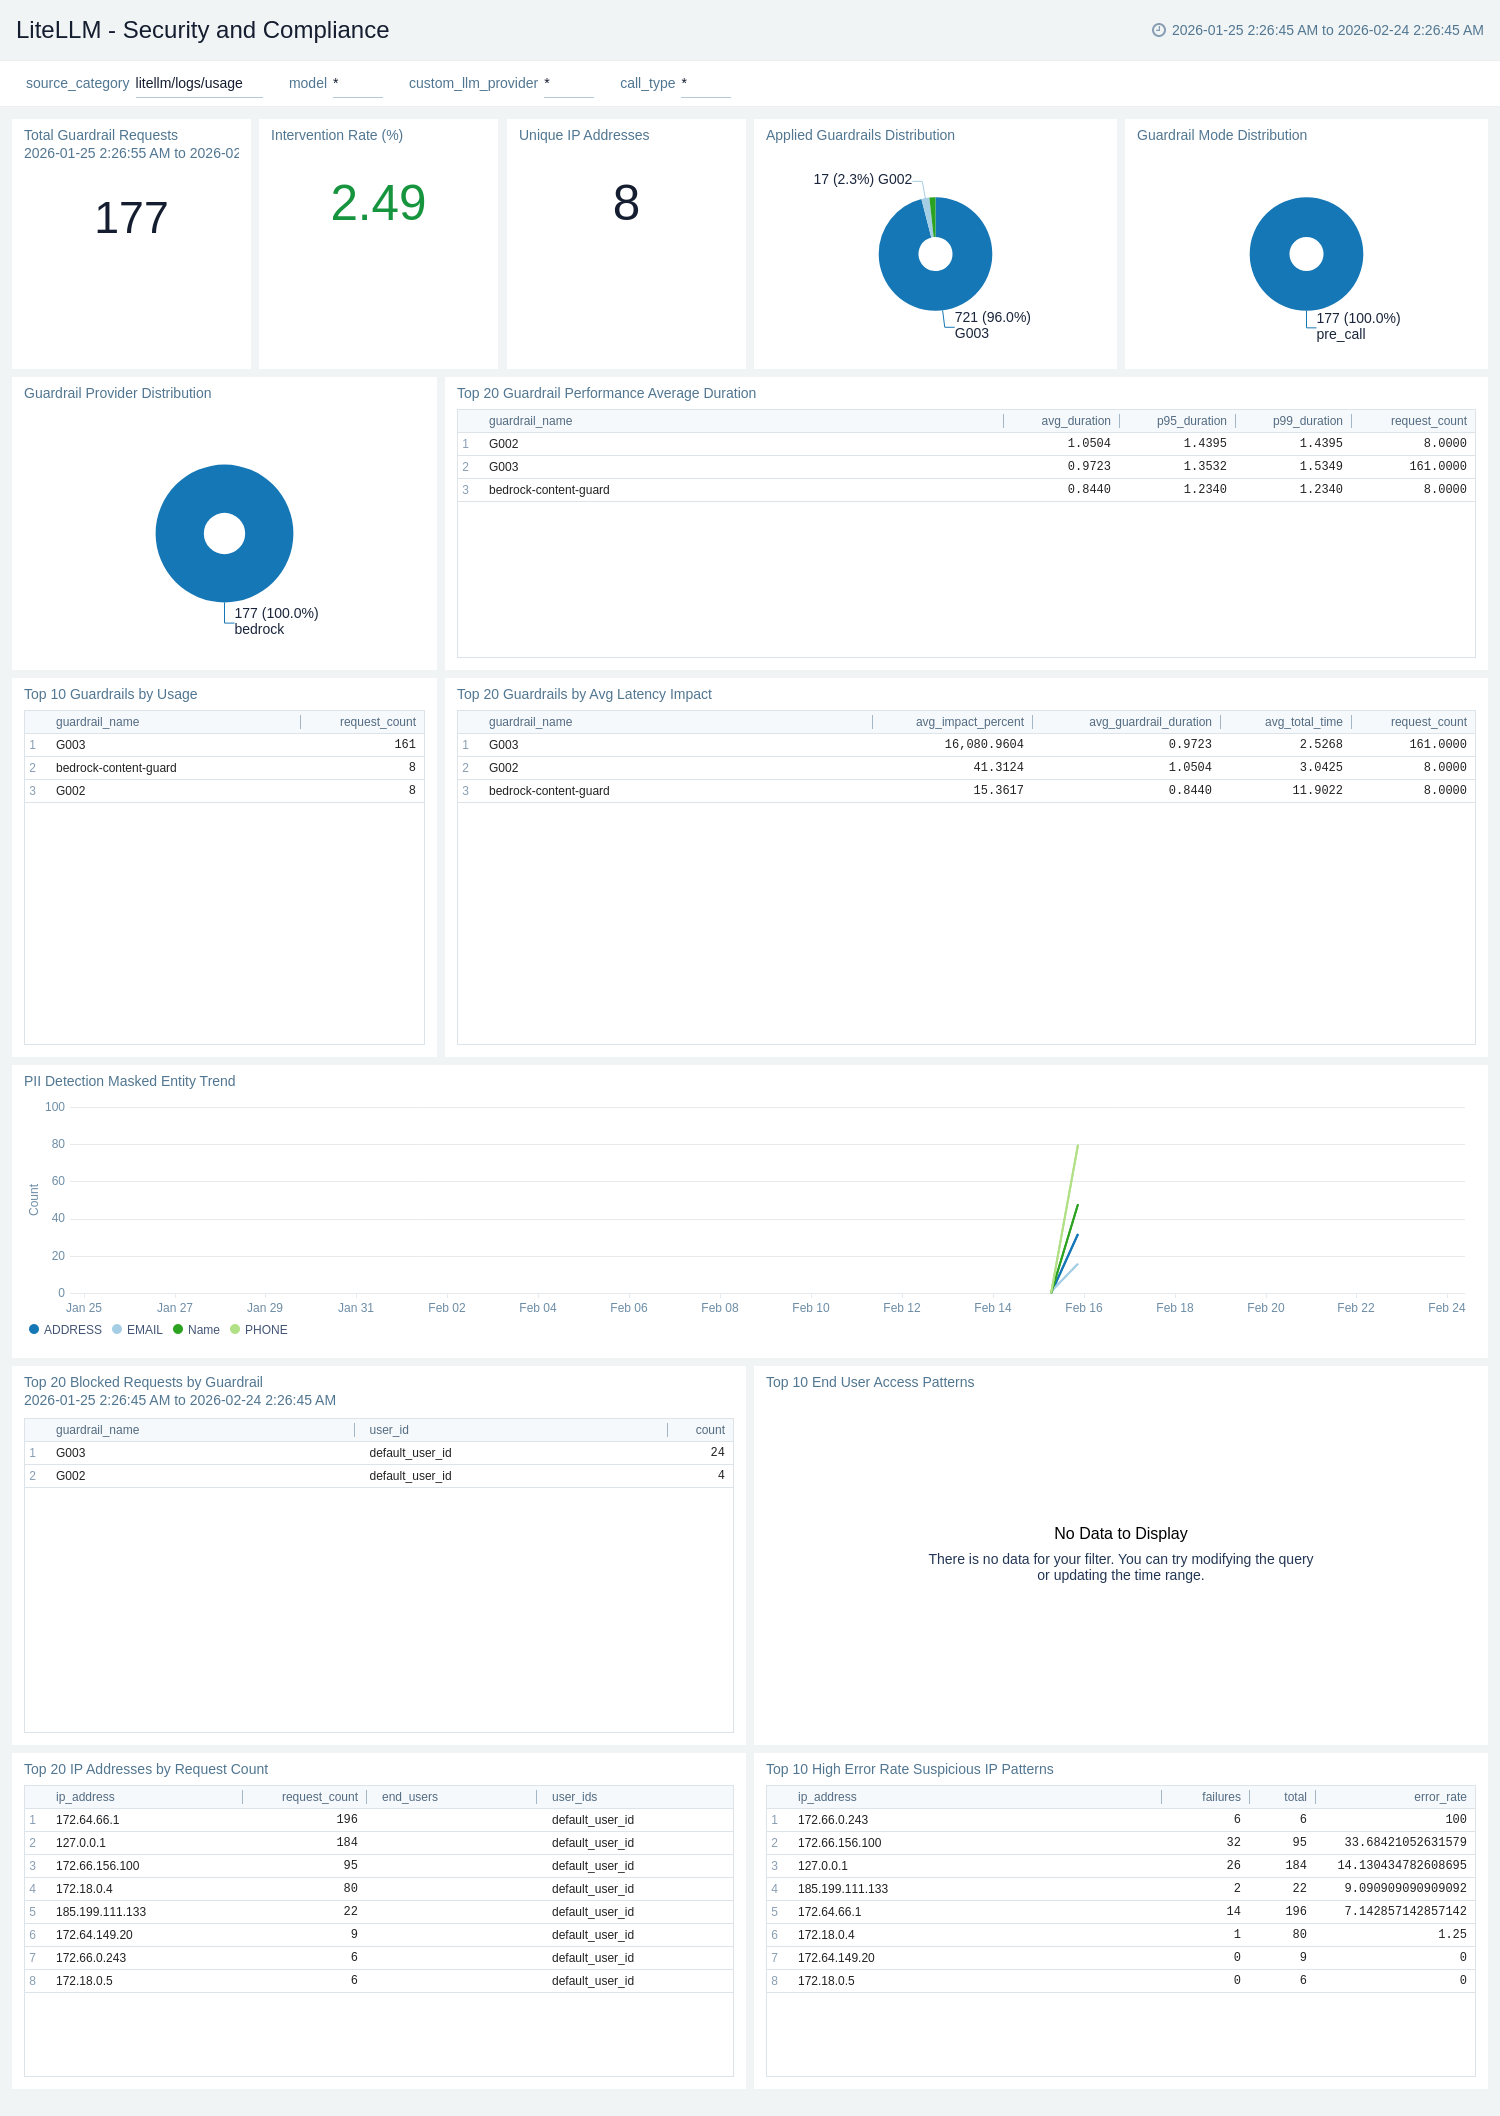
The **LiteLLM - Security and Compliance** dashboard provides comprehensive security monitoring sourced from LiteLLM request logs. It covers detailed guardrail analytics, entity masking and PII detection, geographic access patterns, network security analysis, and compliance tracking — designed for security teams and compliance officers who need audit-ready visibility into how AI is being used across the organization.
### Security and Compliance
The **LiteLLM - Security and Compliance** dashboard provides comprehensive security monitoring sourced from LiteLLM request logs. It covers detailed guardrail analytics, entity masking and PII detection, geographic access patterns, network security analysis, and compliance tracking — designed for security teams and compliance officers who need audit-ready visibility into how AI is being used across the organization.
 ### MCP Overview
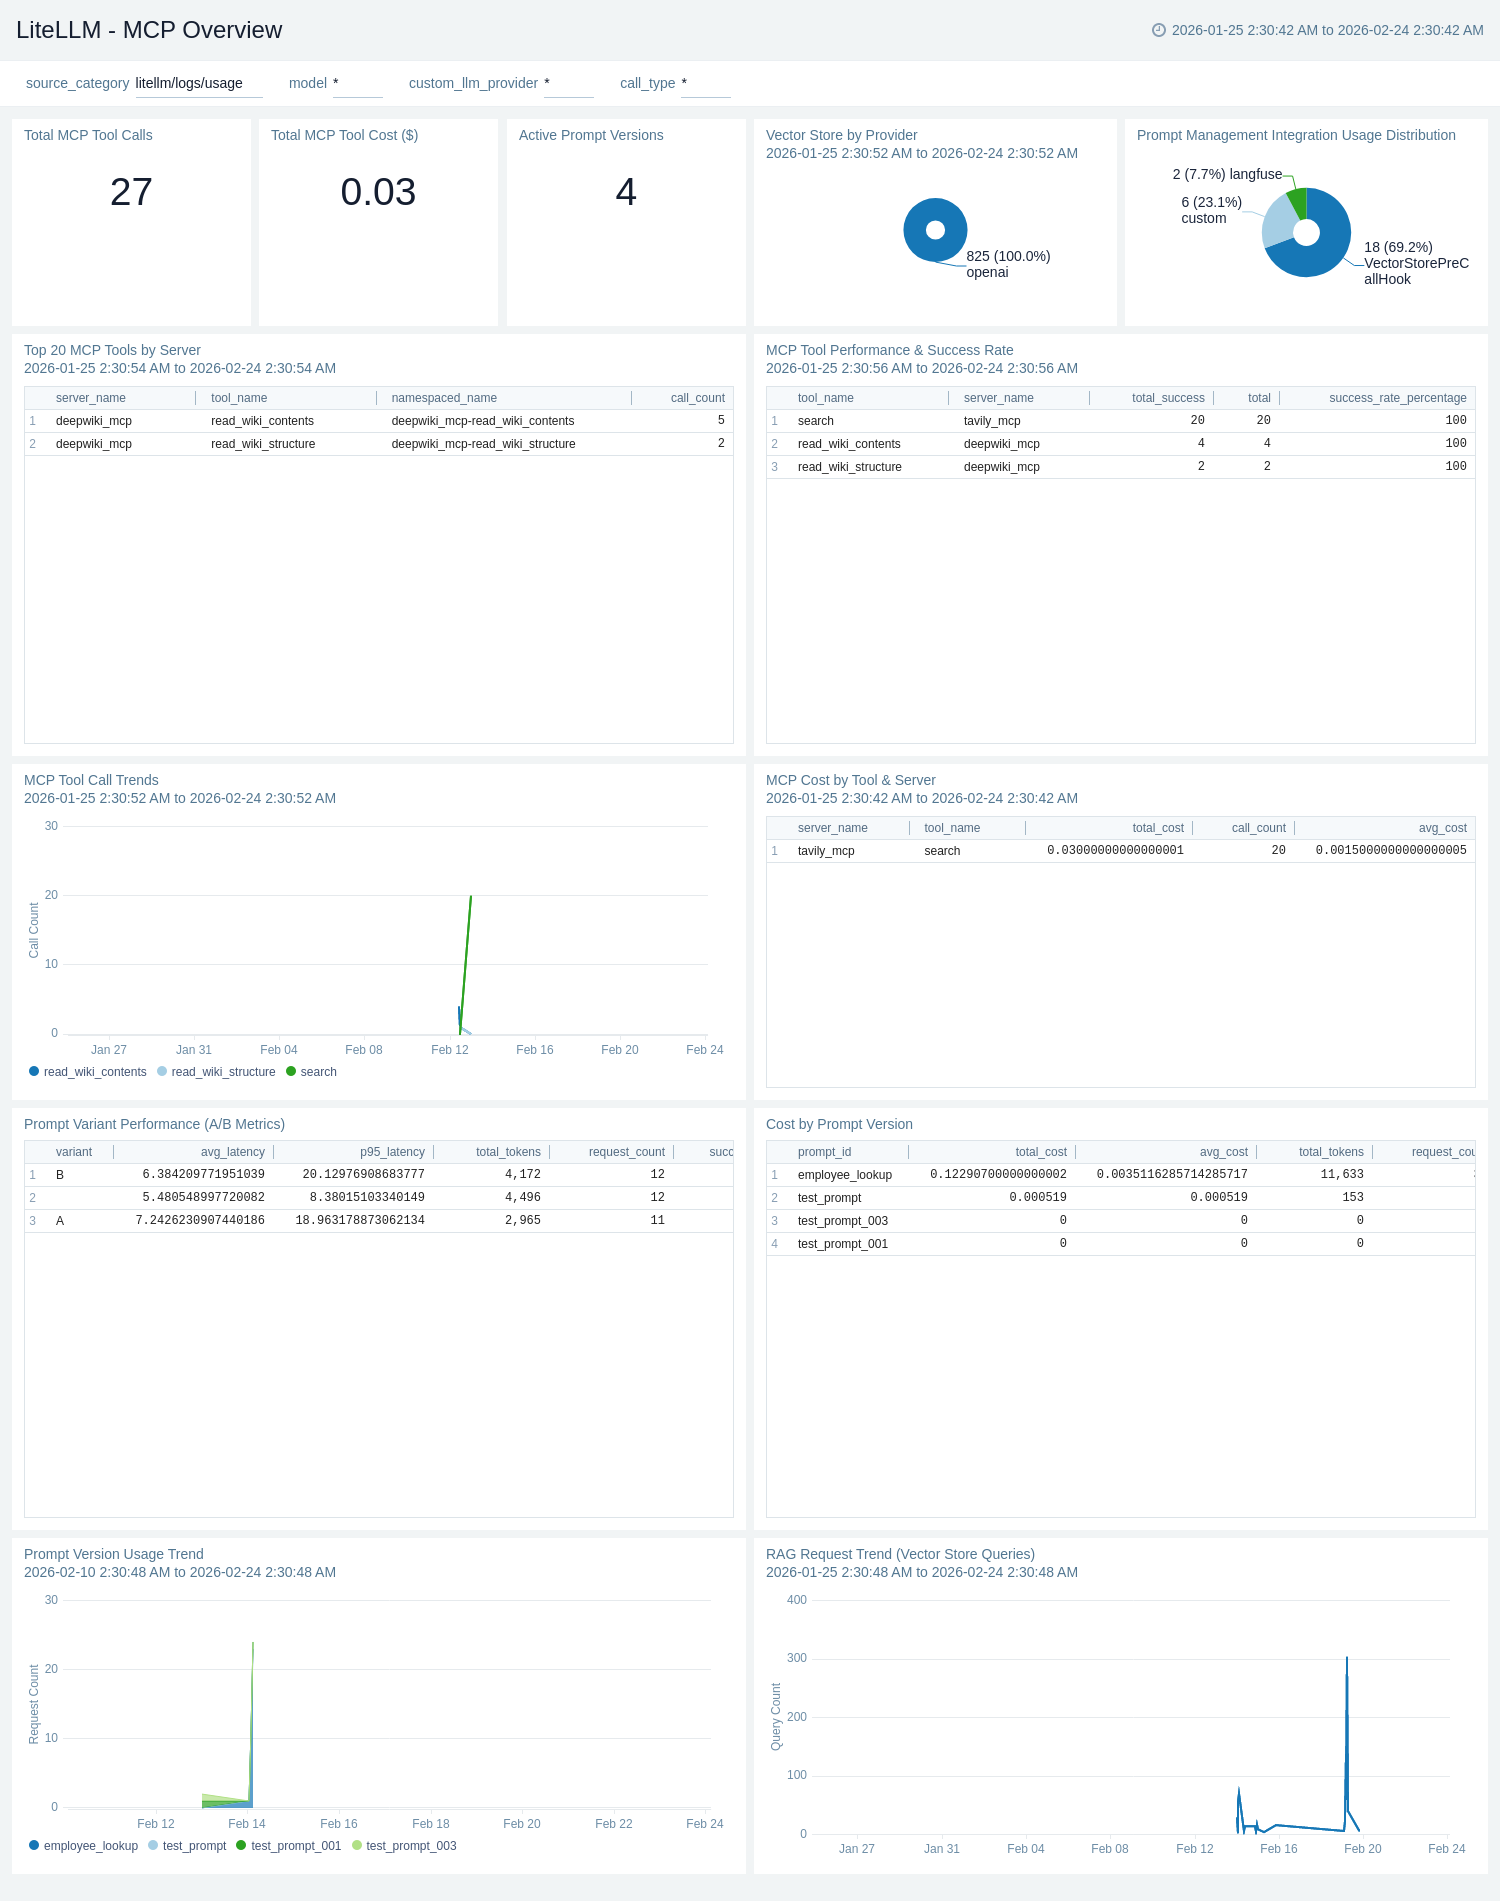
The **LiteLLM - MCP Overview** dashboard provides visibility into Model Context Protocol (MCP) tool usage sourced from LiteLLM request logs. Total MCP Tool Calls and Total MCP Tool Cost ($) single-value panels give instant MCP activity and spend visibility. Active Prompt Versions tracks the number of distinct prompt versions in use. MCP Tool Call Trends shows usage volume over time by tool, while Top 20 MCP Tools by Server and MCP Tool Performance & Success Rate tables identify the most-used tools and their latency and success metrics. MCP Cost by Tool & Server ranks tooling costs for attribution. RAG Request Trend (Vector Store Queries) tracks retrieval-augmented generation activity over time, Vector Store by Provider shows distribution across vector store backends, and Prompt Management Integration Usage Distribution and Prompt Version Usage Trend monitor prompt management integrations such as Langfuse and PromptLayer.
### MCP Overview
The **LiteLLM - MCP Overview** dashboard provides visibility into Model Context Protocol (MCP) tool usage sourced from LiteLLM request logs. Total MCP Tool Calls and Total MCP Tool Cost ($) single-value panels give instant MCP activity and spend visibility. Active Prompt Versions tracks the number of distinct prompt versions in use. MCP Tool Call Trends shows usage volume over time by tool, while Top 20 MCP Tools by Server and MCP Tool Performance & Success Rate tables identify the most-used tools and their latency and success metrics. MCP Cost by Tool & Server ranks tooling costs for attribution. RAG Request Trend (Vector Store Queries) tracks retrieval-augmented generation activity over time, Vector Store by Provider shows distribution across vector store backends, and Prompt Management Integration Usage Distribution and Prompt Version Usage Trend monitor prompt management integrations such as Langfuse and PromptLayer.
 ### Vector Overview
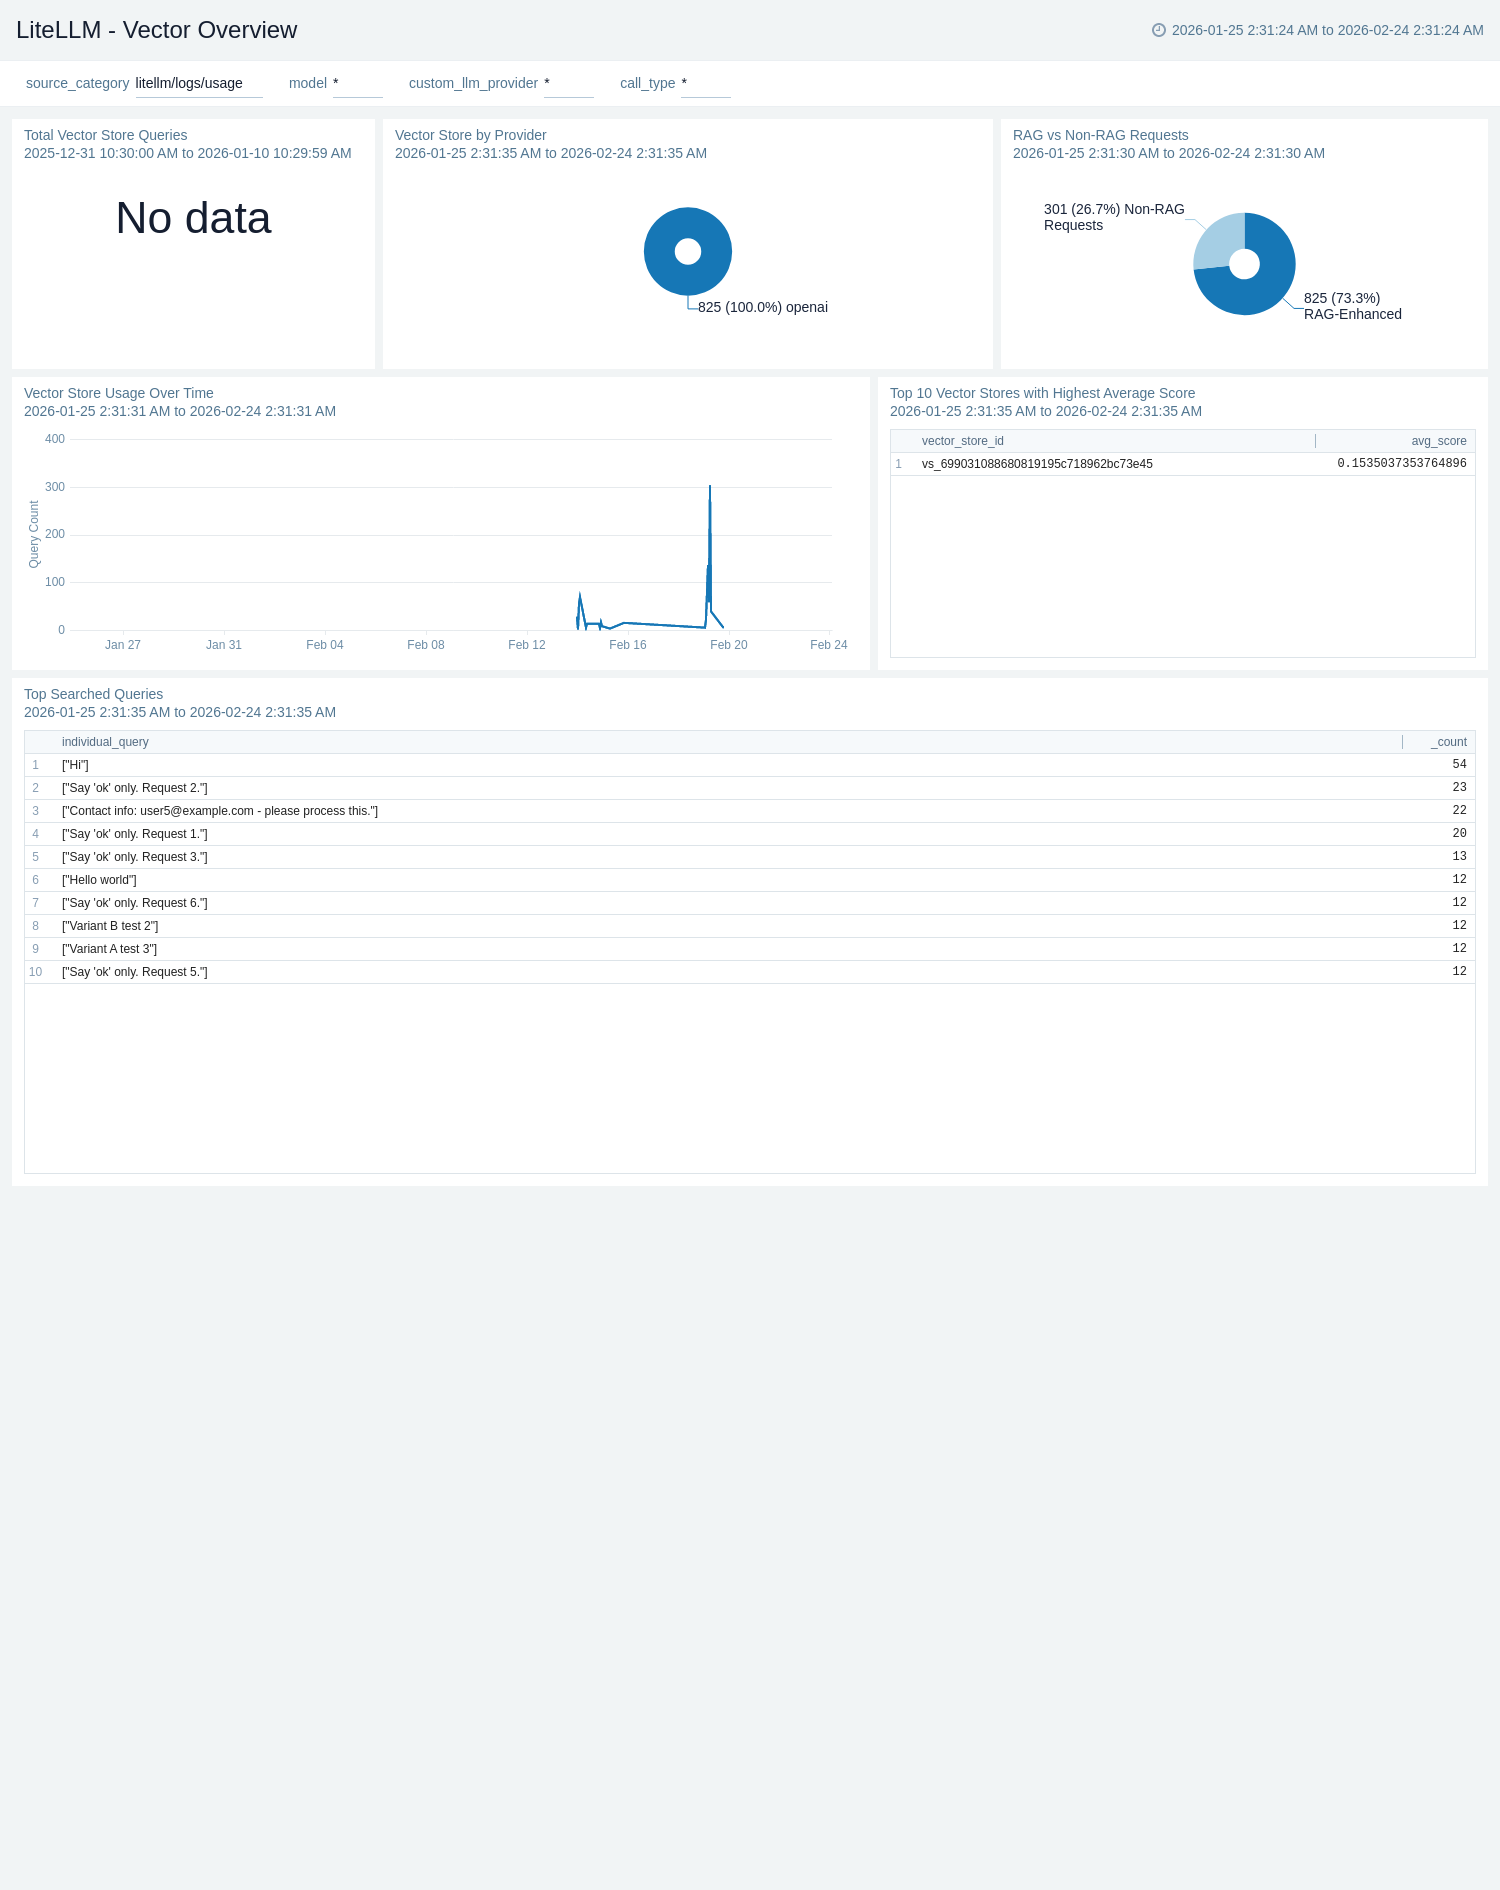
The **LiteLLM - Vector Overview** dashboard provides visibility into vector store and RAG usage sourced from LiteLLM request logs. RAG vs Non-RAG Requests shows the proportion of retrieval-augmented requests versus standard requests. Vector Store by Provider breaks down which vector store backends are in use. Top Searched Queries surfaces the most frequent queries sent to vector stores, and Top 10 Vector Stores with Highest Average Score identifies the best-performing stores by retrieval score — helping teams assess and improve RAG retrieval quality.
### Vector Overview
The **LiteLLM - Vector Overview** dashboard provides visibility into vector store and RAG usage sourced from LiteLLM request logs. RAG vs Non-RAG Requests shows the proportion of retrieval-augmented requests versus standard requests. Vector Store by Provider breaks down which vector store backends are in use. Top Searched Queries surfaces the most frequent queries sent to vector stores, and Top 10 Vector Stores with Highest Average Score identifies the best-performing stores by retrieval score — helping teams assess and improve RAG retrieval quality.
 ## Create monitors for LiteLLM app
import CreateMonitors from '../../reuse/apps/create-monitors.md';
### LiteLLM alerts
| Name | Description | Alert Condition | Recover Condition |
|:--|:--|:----------------------------------------------------|:--------------------------------------------------------|
| `LiteLLM - Callback Failures` | This alert is triggered when the callback logging failure rate exceeds the threshold, indicating issues with observability pipelines such as logging or webhook callbacks. | Count > 0.01 | Count < = 0.01 |
| `LiteLLM - High End-to-End Latency` | This alert is triggered when the average end-to-end request latency exceeds 25 seconds (warning) or 30 seconds (critical). High latency can indicate slow upstream LLM providers, network issues, or proxy overload. | Warning: Count > 25000ms, Critical: Count > 30000ms | Warning: Count < = 25000ms, Critical: Count < = 30000ms |
| `LiteLLM - High Global Error Rate` | This alert is triggered when the percentage of failed requests relative to total requests exceeds 5%. A high error rate may indicate upstream provider outages, misconfigured routes, or authentication issues. | Count > 5% | Count < = 5% |
| `LiteLLM - Proxy Down No Traffic` | This alert is triggered when no proxy traffic is detected, indicating the LiteLLM proxy may be down or unreachable. | Count < = 0 | Count > 0 |
| `LiteLLM - Team Budget Exhausted` | This alert is triggered when the remaining budget for any team drops to zero or below, indicating the team has exhausted its allocated spend and new requests may be rejected. | Count < = 0 | Count > 0 |
## Installing the LiteLLM app
import AppInstall from '../../reuse/apps/app-install-v2.md';
## Upgrading the LiteLLM app
import AppUpdate from '../../reuse/apps/app-update.md';
## Uninstalling the LiteLLM app
import AppUninstall from '../../reuse/apps/app-uninstall.md';
## Create monitors for LiteLLM app
import CreateMonitors from '../../reuse/apps/create-monitors.md';
### LiteLLM alerts
| Name | Description | Alert Condition | Recover Condition |
|:--|:--|:----------------------------------------------------|:--------------------------------------------------------|
| `LiteLLM - Callback Failures` | This alert is triggered when the callback logging failure rate exceeds the threshold, indicating issues with observability pipelines such as logging or webhook callbacks. | Count > 0.01 | Count < = 0.01 |
| `LiteLLM - High End-to-End Latency` | This alert is triggered when the average end-to-end request latency exceeds 25 seconds (warning) or 30 seconds (critical). High latency can indicate slow upstream LLM providers, network issues, or proxy overload. | Warning: Count > 25000ms, Critical: Count > 30000ms | Warning: Count < = 25000ms, Critical: Count < = 30000ms |
| `LiteLLM - High Global Error Rate` | This alert is triggered when the percentage of failed requests relative to total requests exceeds 5%. A high error rate may indicate upstream provider outages, misconfigured routes, or authentication issues. | Count > 5% | Count < = 5% |
| `LiteLLM - Proxy Down No Traffic` | This alert is triggered when no proxy traffic is detected, indicating the LiteLLM proxy may be down or unreachable. | Count < = 0 | Count > 0 |
| `LiteLLM - Team Budget Exhausted` | This alert is triggered when the remaining budget for any team drops to zero or below, indicating the team has exhausted its allocated spend and new requests may be rejected. | Count < = 0 | Count > 0 |
## Installing the LiteLLM app
import AppInstall from '../../reuse/apps/app-install-v2.md';
## Upgrading the LiteLLM app
import AppUpdate from '../../reuse/apps/app-update.md';
## Uninstalling the LiteLLM app
import AppUninstall from '../../reuse/apps/app-uninstall.md';