---
id: apache-opentelemetry
title: Apache - OpenTelemetry Collector
sidebar_label: Apache - OTel Collector
description: Learn about the Sumo Logic OpenTelemetry app for Apache.
slug: /help/docs/integrations/web-servers/opentelemetry/apache-opentelemetry/
canonical: https://www.sumologic.com/help/docs/integrations/web-servers/opentelemetry/apache-opentelemetry/
---
import useBaseUrl from '@docusaurus/useBaseUrl';
import Tabs from '@theme/Tabs';
import TabItem from '@theme/TabItem';
})
}) The [Apache](https://httpd.apache.org/ABOUT_APACHE.html) app is a unified logs and metrics app that helps you monitor the availability, performance, health, and resource utilization of Apache web server farms. Preconfigured dashboards and searches provide visibility into your environment for real-time or historical analysis: visitor locations, visitor access types, traffic patterns, errors, web server operations, resource utilization, and access from known malicious sources.
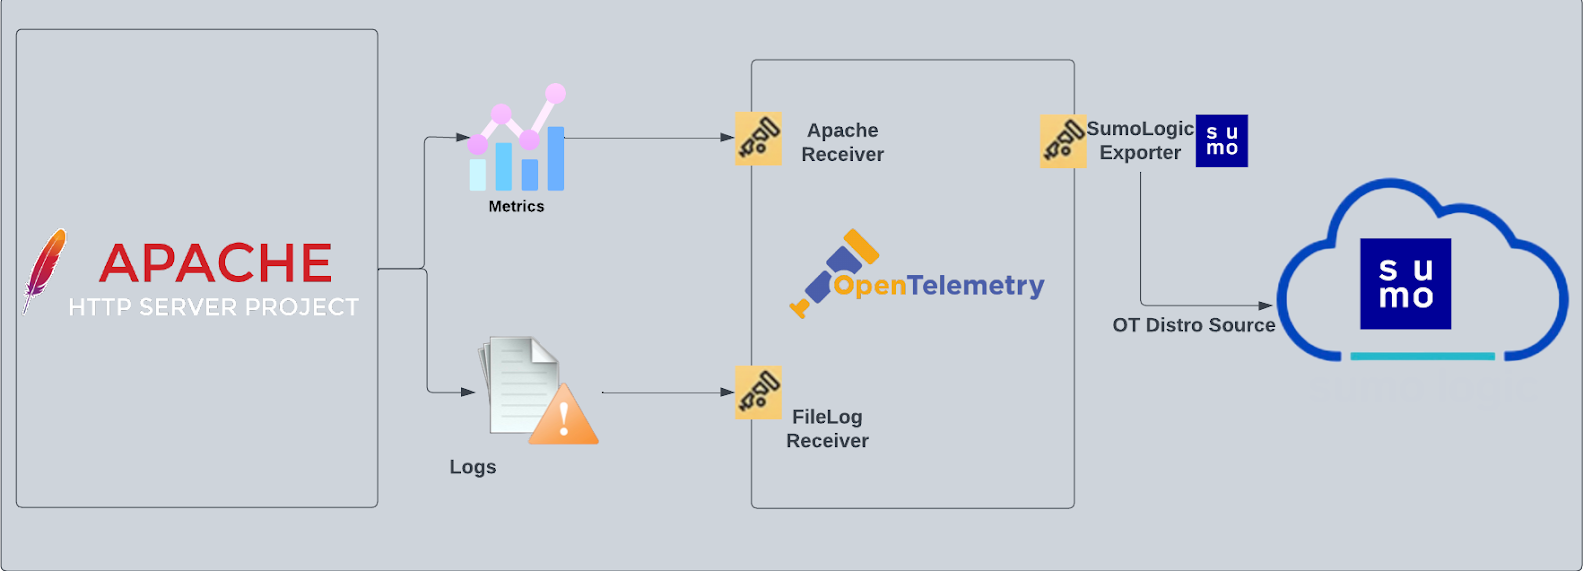
The diagram below illustrates the components of the Apache collection for each web server. OpenTelemetry collector runs on the same host as Apache, and uses the [Apache Receiver](https://github.com/open-telemetry/opentelemetry-collector-contrib/tree/main/receiver/apachereceiver) to obtain Apache metrics, and the [Sumo Logic OpenTelemetry Exporter](https://github.com/open-telemetry/opentelemetry-collector-contrib/tree/main/exporter/sumologicexporter) to send the metrics to Sumo Logic. Apache logs are sent to Sumo Logic through a [filelog receiver](https://github.com/open-telemetry/opentelemetry-collector-contrib/tree/main/receiver/filelogreceiver).
The [Apache](https://httpd.apache.org/ABOUT_APACHE.html) app is a unified logs and metrics app that helps you monitor the availability, performance, health, and resource utilization of Apache web server farms. Preconfigured dashboards and searches provide visibility into your environment for real-time or historical analysis: visitor locations, visitor access types, traffic patterns, errors, web server operations, resource utilization, and access from known malicious sources.
The diagram below illustrates the components of the Apache collection for each web server. OpenTelemetry collector runs on the same host as Apache, and uses the [Apache Receiver](https://github.com/open-telemetry/opentelemetry-collector-contrib/tree/main/receiver/apachereceiver) to obtain Apache metrics, and the [Sumo Logic OpenTelemetry Exporter](https://github.com/open-telemetry/opentelemetry-collector-contrib/tree/main/exporter/sumologicexporter) to send the metrics to Sumo Logic. Apache logs are sent to Sumo Logic through a [filelog receiver](https://github.com/open-telemetry/opentelemetry-collector-contrib/tree/main/receiver/filelogreceiver).
 The Sumo Logic app for Apache assumes:
- The [NCSA extended/combined log file format ](https://httpd.apache.org/docs/current/mod/mod_log_config.html)has been configured for Apache access logs and the default error log format for Apache Access logs and Apache Error logs. For a list of metrics that are collected and used by the app, see [Apache Metrics](https://github.com/open-telemetry/opentelemetry-collector-contrib/blob/main/receiver/apachereceiver/documentation.md).
:::info
This app includes [built-in monitors](#apache-alerts). For details on creating custom monitors, refer to [Create monitors for Apache app](#create-monitors-for-apache-app).
:::
## Fields Creation in Sumo Logic for Apache
Following are the [Fields](/docs/manage/fields/) which will be created as part of Apache app installation, if not already present.
- **`webengine.cluster.name`**. User configured. Enter a name to uniquely identify your Apache web server cluster. This web server cluster name will be shown in the Sumo Logic dashboards.
- **`webengine.system`**. Has fixed value of **apache**.
- **`sumo.datasource`**. Has fixed value of **apache**.
- **`webengine.node.name`**. Has the value of host name of the machine which is being monitored.
## Prerequisites
### For metrics collection
The receiver used gets stats from an Apache Web Server instance using the `server-status?auto` endpoint. This receiver supports `Apache Web Server version 2.4+`.
**Receive server statistics** by configuring the server's `httpd.conf` file to [enable status support](https://httpd.apache.org/docs/2.4/mod/mod_status.html).
### For logs collection
**Configure the Apache log files**:
1. Configure the logging of access logs and error logs via the instructions described in the [Apache Documentation](https://httpd.apache.org/docs/2.4/logs.html).
1. Locate your local `httpd.conf` configuration file in the Apache directory. After determining the location of the conf file, modify the `httpd.conf` configuration file logging parameters if required.
* For access logs, the following directive is to be noted:
- **CustomLog**. Access log file path and format (standard common and combined).
* For error logs, following directives are to be noted:
- **ErrorLog**. Error log file path.
- **LogLevel**. To control the number of messages logged to the `error_log`.
Ensure that the otelcol has adequate permissions to access all log file paths. Execute the following command for the same:
```
sudo setfacl -R -m d:u:otelcol-sumo:r-x,u:otelcol-sumo:r-x,g:otelcol-sumo:r-x
```
import LogsCollectionPrereqisites from '../../../reuse/apps/logs-collection-prereqisites.md';
For Windows systems, log files which are collected should be accessible by the SYSTEM group. Use the following set of PowerShell commands if the SYSTEM group does not have access.
```
$NewAcl = Get-Acl -Path ""
# Set properties
$identity = "NT AUTHORITY\SYSTEM"
$fileSystemRights = "ReadAndExecute"
$type = "Allow"
# Create new rule
$fileSystemAccessRuleArgumentList = $identity, $fileSystemRights, $type
$fileSystemAccessRule = New-Object -TypeName System.Security.AccessControl.FileSystemAccessRule -ArgumentList $fileSystemAccessRuleArgumentList
# Apply new rule
$NewAcl.SetAccessRule($fileSystemAccessRule)
Set-Acl -Path "" -AclObject $NewAcl
```
## Collection configuration and app installation
Follow these steps to set up and deploy the source template to collect data in Sumo Logic from a remotely managed OpenTelemetry collector.
### Step 1: Set up remotely managed OpenTelemetry collector
import OtelCollectorInstallation from '../../../reuse/apps/opentelemetry/otel-collector-installation.md';
:::note
If you want to configure your source locally, you can do so by downloading the YAML file. For details, see [Configure OpenTelemetry collectors locally](/docs/integrations/sumo-apps/opentelemetry-collector-insights/#configure-opentelemetry-collectors-locally).
:::
### Step 2: Configure the source template
import ApacheConfigureSourceTemplate from '../../../reuse/send-data/apache-configure-source-template.md';
import TimestampParsing from '../../../reuse/apps/opentelemetry/timestamp-parsing.md';
import ProcessingRules from '../../../reuse/opentelemetry/processing-rules.md';
### Step 3: Push the source template to the desired remotely managed collectors
import DataConfiguration from '../../../reuse/apps/opentelemetry/data-configuration.md';
## Sample log messages
```sh title="Access Logs"
192.168.29.177 - - [26/Apr/2021:12:18:32 +0530] "GET /server-status HTTP/1.1" 404 196
```
```sh title="Error Logs
[Mon Apr 26 09:52:58.188858 2021] [core:notice] [pid 530] AH00094: Command line: '/usr/sbin/httpd -D FOREGROUND'
```
## Sample metrics
```json
{
"queryId":"A",
"server_name":"localhost",
"_source":"apache-otel-metric",
"state":"dnslookup",
"webengine.cluster":"apache_otel_cluster",
"sumo.datasource":"apache",
"deployment.environment":"user_apache_env",
"_contentType":"Carbon2",
"metric":"apache.scoreboard",
"_collectorId":"000000000C9802CD",
"_sourceId":"0000000042E3AAB3",
"webengine.system":"apache",
"unit":"{workers}",
"_collector":"Labs - apache-otel",
"max":100,
"min":0,
"avg":18.64,
"sum":1100,
"latest":1,
"count":59
}
```
## Sample queries
### Log query
This sample logs query is from the **Top 5 Clients Causing 4xx Errors** panel of the **Apache - Web server Operations** dashboard.
```sumo title="Query String"
webengine.system=apache webengine.cluster.name=* HTTP (40* OR 41* OR 42* OR 43* OR 44* or 45* or 49*)
| json "log" nodrop | if (_raw matches "{*", log, _raw) as mesg
| parse regex field=mesg "^(?\d{1,3}\.\d{1,3}\.\d{1,3}\.\d{1,3})" nodrop
| parse regex field=mesg "(?[A-Z]+)\s(?\S+)\sHTTP\/[\d\.]+[\\n]*\"\s(?\d+)\s(?[\d-]+)" nodrop
| parse regex field=mesg "(?[A-Z]+)\s(?\S+)\sHTTP\/[\d\.]+[\\n]*\"\s(?\d+)\s(?[\d-]+)\s\"(?.*?)\"\s\"(?.+?)\".*" nodrop
| where status_code matches "4*"
| count as count by src_ip
| sort count, src_ip asc
| limit 5
```
### Metrics query
This is a sample metrics query is from the **Waiting** panel of the **Request State Analysis** dashboard.
```sql
sumo.datasource=apache metric=apache.scoreboard state=waiting webengine.cluster.name=* webengine.node.name=* | sum by webengine.cluster.name
```
## Viewing Apache dashboards
All dashboards have a set of filters that you can apply to the entire dashboard. Use these filters to drill down and examine the data to a granular level.
- You can change the time range for a dashboard or panel by selecting a predefined interval from a drop-down list, choosing a recently used time range, or specifying custom dates and times. [Learn more](/docs/dashboards/set-custom-time-ranges/).
- You can use template variables to drill down and examine the data on a granular level. For more information, see [Filtering Dashboards with Template Variables](/docs/dashboards/filter-template-variables/).
### Overview
The **Apache - Overview** Dashboard provides an at-a-glance view of the activity and health of the Apache web server farms, and servers by monitoring uptime, requests, response, traffic, visitor geographic locations, and critical error messages.
Use this dashboard to:
- Get an at-a-glance view of the state of all your Apache web servers.
- Identify the top URLs causing errors.
- Identify the top critical error messages.
The Sumo Logic app for Apache assumes:
- The [NCSA extended/combined log file format ](https://httpd.apache.org/docs/current/mod/mod_log_config.html)has been configured for Apache access logs and the default error log format for Apache Access logs and Apache Error logs. For a list of metrics that are collected and used by the app, see [Apache Metrics](https://github.com/open-telemetry/opentelemetry-collector-contrib/blob/main/receiver/apachereceiver/documentation.md).
:::info
This app includes [built-in monitors](#apache-alerts). For details on creating custom monitors, refer to [Create monitors for Apache app](#create-monitors-for-apache-app).
:::
## Fields Creation in Sumo Logic for Apache
Following are the [Fields](/docs/manage/fields/) which will be created as part of Apache app installation, if not already present.
- **`webengine.cluster.name`**. User configured. Enter a name to uniquely identify your Apache web server cluster. This web server cluster name will be shown in the Sumo Logic dashboards.
- **`webengine.system`**. Has fixed value of **apache**.
- **`sumo.datasource`**. Has fixed value of **apache**.
- **`webengine.node.name`**. Has the value of host name of the machine which is being monitored.
## Prerequisites
### For metrics collection
The receiver used gets stats from an Apache Web Server instance using the `server-status?auto` endpoint. This receiver supports `Apache Web Server version 2.4+`.
**Receive server statistics** by configuring the server's `httpd.conf` file to [enable status support](https://httpd.apache.org/docs/2.4/mod/mod_status.html).
### For logs collection
**Configure the Apache log files**:
1. Configure the logging of access logs and error logs via the instructions described in the [Apache Documentation](https://httpd.apache.org/docs/2.4/logs.html).
1. Locate your local `httpd.conf` configuration file in the Apache directory. After determining the location of the conf file, modify the `httpd.conf` configuration file logging parameters if required.
* For access logs, the following directive is to be noted:
- **CustomLog**. Access log file path and format (standard common and combined).
* For error logs, following directives are to be noted:
- **ErrorLog**. Error log file path.
- **LogLevel**. To control the number of messages logged to the `error_log`.
Ensure that the otelcol has adequate permissions to access all log file paths. Execute the following command for the same:
```
sudo setfacl -R -m d:u:otelcol-sumo:r-x,u:otelcol-sumo:r-x,g:otelcol-sumo:r-x
```
import LogsCollectionPrereqisites from '../../../reuse/apps/logs-collection-prereqisites.md';
For Windows systems, log files which are collected should be accessible by the SYSTEM group. Use the following set of PowerShell commands if the SYSTEM group does not have access.
```
$NewAcl = Get-Acl -Path ""
# Set properties
$identity = "NT AUTHORITY\SYSTEM"
$fileSystemRights = "ReadAndExecute"
$type = "Allow"
# Create new rule
$fileSystemAccessRuleArgumentList = $identity, $fileSystemRights, $type
$fileSystemAccessRule = New-Object -TypeName System.Security.AccessControl.FileSystemAccessRule -ArgumentList $fileSystemAccessRuleArgumentList
# Apply new rule
$NewAcl.SetAccessRule($fileSystemAccessRule)
Set-Acl -Path "" -AclObject $NewAcl
```
## Collection configuration and app installation
Follow these steps to set up and deploy the source template to collect data in Sumo Logic from a remotely managed OpenTelemetry collector.
### Step 1: Set up remotely managed OpenTelemetry collector
import OtelCollectorInstallation from '../../../reuse/apps/opentelemetry/otel-collector-installation.md';
:::note
If you want to configure your source locally, you can do so by downloading the YAML file. For details, see [Configure OpenTelemetry collectors locally](/docs/integrations/sumo-apps/opentelemetry-collector-insights/#configure-opentelemetry-collectors-locally).
:::
### Step 2: Configure the source template
import ApacheConfigureSourceTemplate from '../../../reuse/send-data/apache-configure-source-template.md';
import TimestampParsing from '../../../reuse/apps/opentelemetry/timestamp-parsing.md';
import ProcessingRules from '../../../reuse/opentelemetry/processing-rules.md';
### Step 3: Push the source template to the desired remotely managed collectors
import DataConfiguration from '../../../reuse/apps/opentelemetry/data-configuration.md';
## Sample log messages
```sh title="Access Logs"
192.168.29.177 - - [26/Apr/2021:12:18:32 +0530] "GET /server-status HTTP/1.1" 404 196
```
```sh title="Error Logs
[Mon Apr 26 09:52:58.188858 2021] [core:notice] [pid 530] AH00094: Command line: '/usr/sbin/httpd -D FOREGROUND'
```
## Sample metrics
```json
{
"queryId":"A",
"server_name":"localhost",
"_source":"apache-otel-metric",
"state":"dnslookup",
"webengine.cluster":"apache_otel_cluster",
"sumo.datasource":"apache",
"deployment.environment":"user_apache_env",
"_contentType":"Carbon2",
"metric":"apache.scoreboard",
"_collectorId":"000000000C9802CD",
"_sourceId":"0000000042E3AAB3",
"webengine.system":"apache",
"unit":"{workers}",
"_collector":"Labs - apache-otel",
"max":100,
"min":0,
"avg":18.64,
"sum":1100,
"latest":1,
"count":59
}
```
## Sample queries
### Log query
This sample logs query is from the **Top 5 Clients Causing 4xx Errors** panel of the **Apache - Web server Operations** dashboard.
```sumo title="Query String"
webengine.system=apache webengine.cluster.name=* HTTP (40* OR 41* OR 42* OR 43* OR 44* or 45* or 49*)
| json "log" nodrop | if (_raw matches "{*", log, _raw) as mesg
| parse regex field=mesg "^(?\d{1,3}\.\d{1,3}\.\d{1,3}\.\d{1,3})" nodrop
| parse regex field=mesg "(?[A-Z]+)\s(?\S+)\sHTTP\/[\d\.]+[\\n]*\"\s(?\d+)\s(?[\d-]+)" nodrop
| parse regex field=mesg "(?[A-Z]+)\s(?\S+)\sHTTP\/[\d\.]+[\\n]*\"\s(?\d+)\s(?[\d-]+)\s\"(?.*?)\"\s\"(?.+?)\".*" nodrop
| where status_code matches "4*"
| count as count by src_ip
| sort count, src_ip asc
| limit 5
```
### Metrics query
This is a sample metrics query is from the **Waiting** panel of the **Request State Analysis** dashboard.
```sql
sumo.datasource=apache metric=apache.scoreboard state=waiting webengine.cluster.name=* webengine.node.name=* | sum by webengine.cluster.name
```
## Viewing Apache dashboards
All dashboards have a set of filters that you can apply to the entire dashboard. Use these filters to drill down and examine the data to a granular level.
- You can change the time range for a dashboard or panel by selecting a predefined interval from a drop-down list, choosing a recently used time range, or specifying custom dates and times. [Learn more](/docs/dashboards/set-custom-time-ranges/).
- You can use template variables to drill down and examine the data on a granular level. For more information, see [Filtering Dashboards with Template Variables](/docs/dashboards/filter-template-variables/).
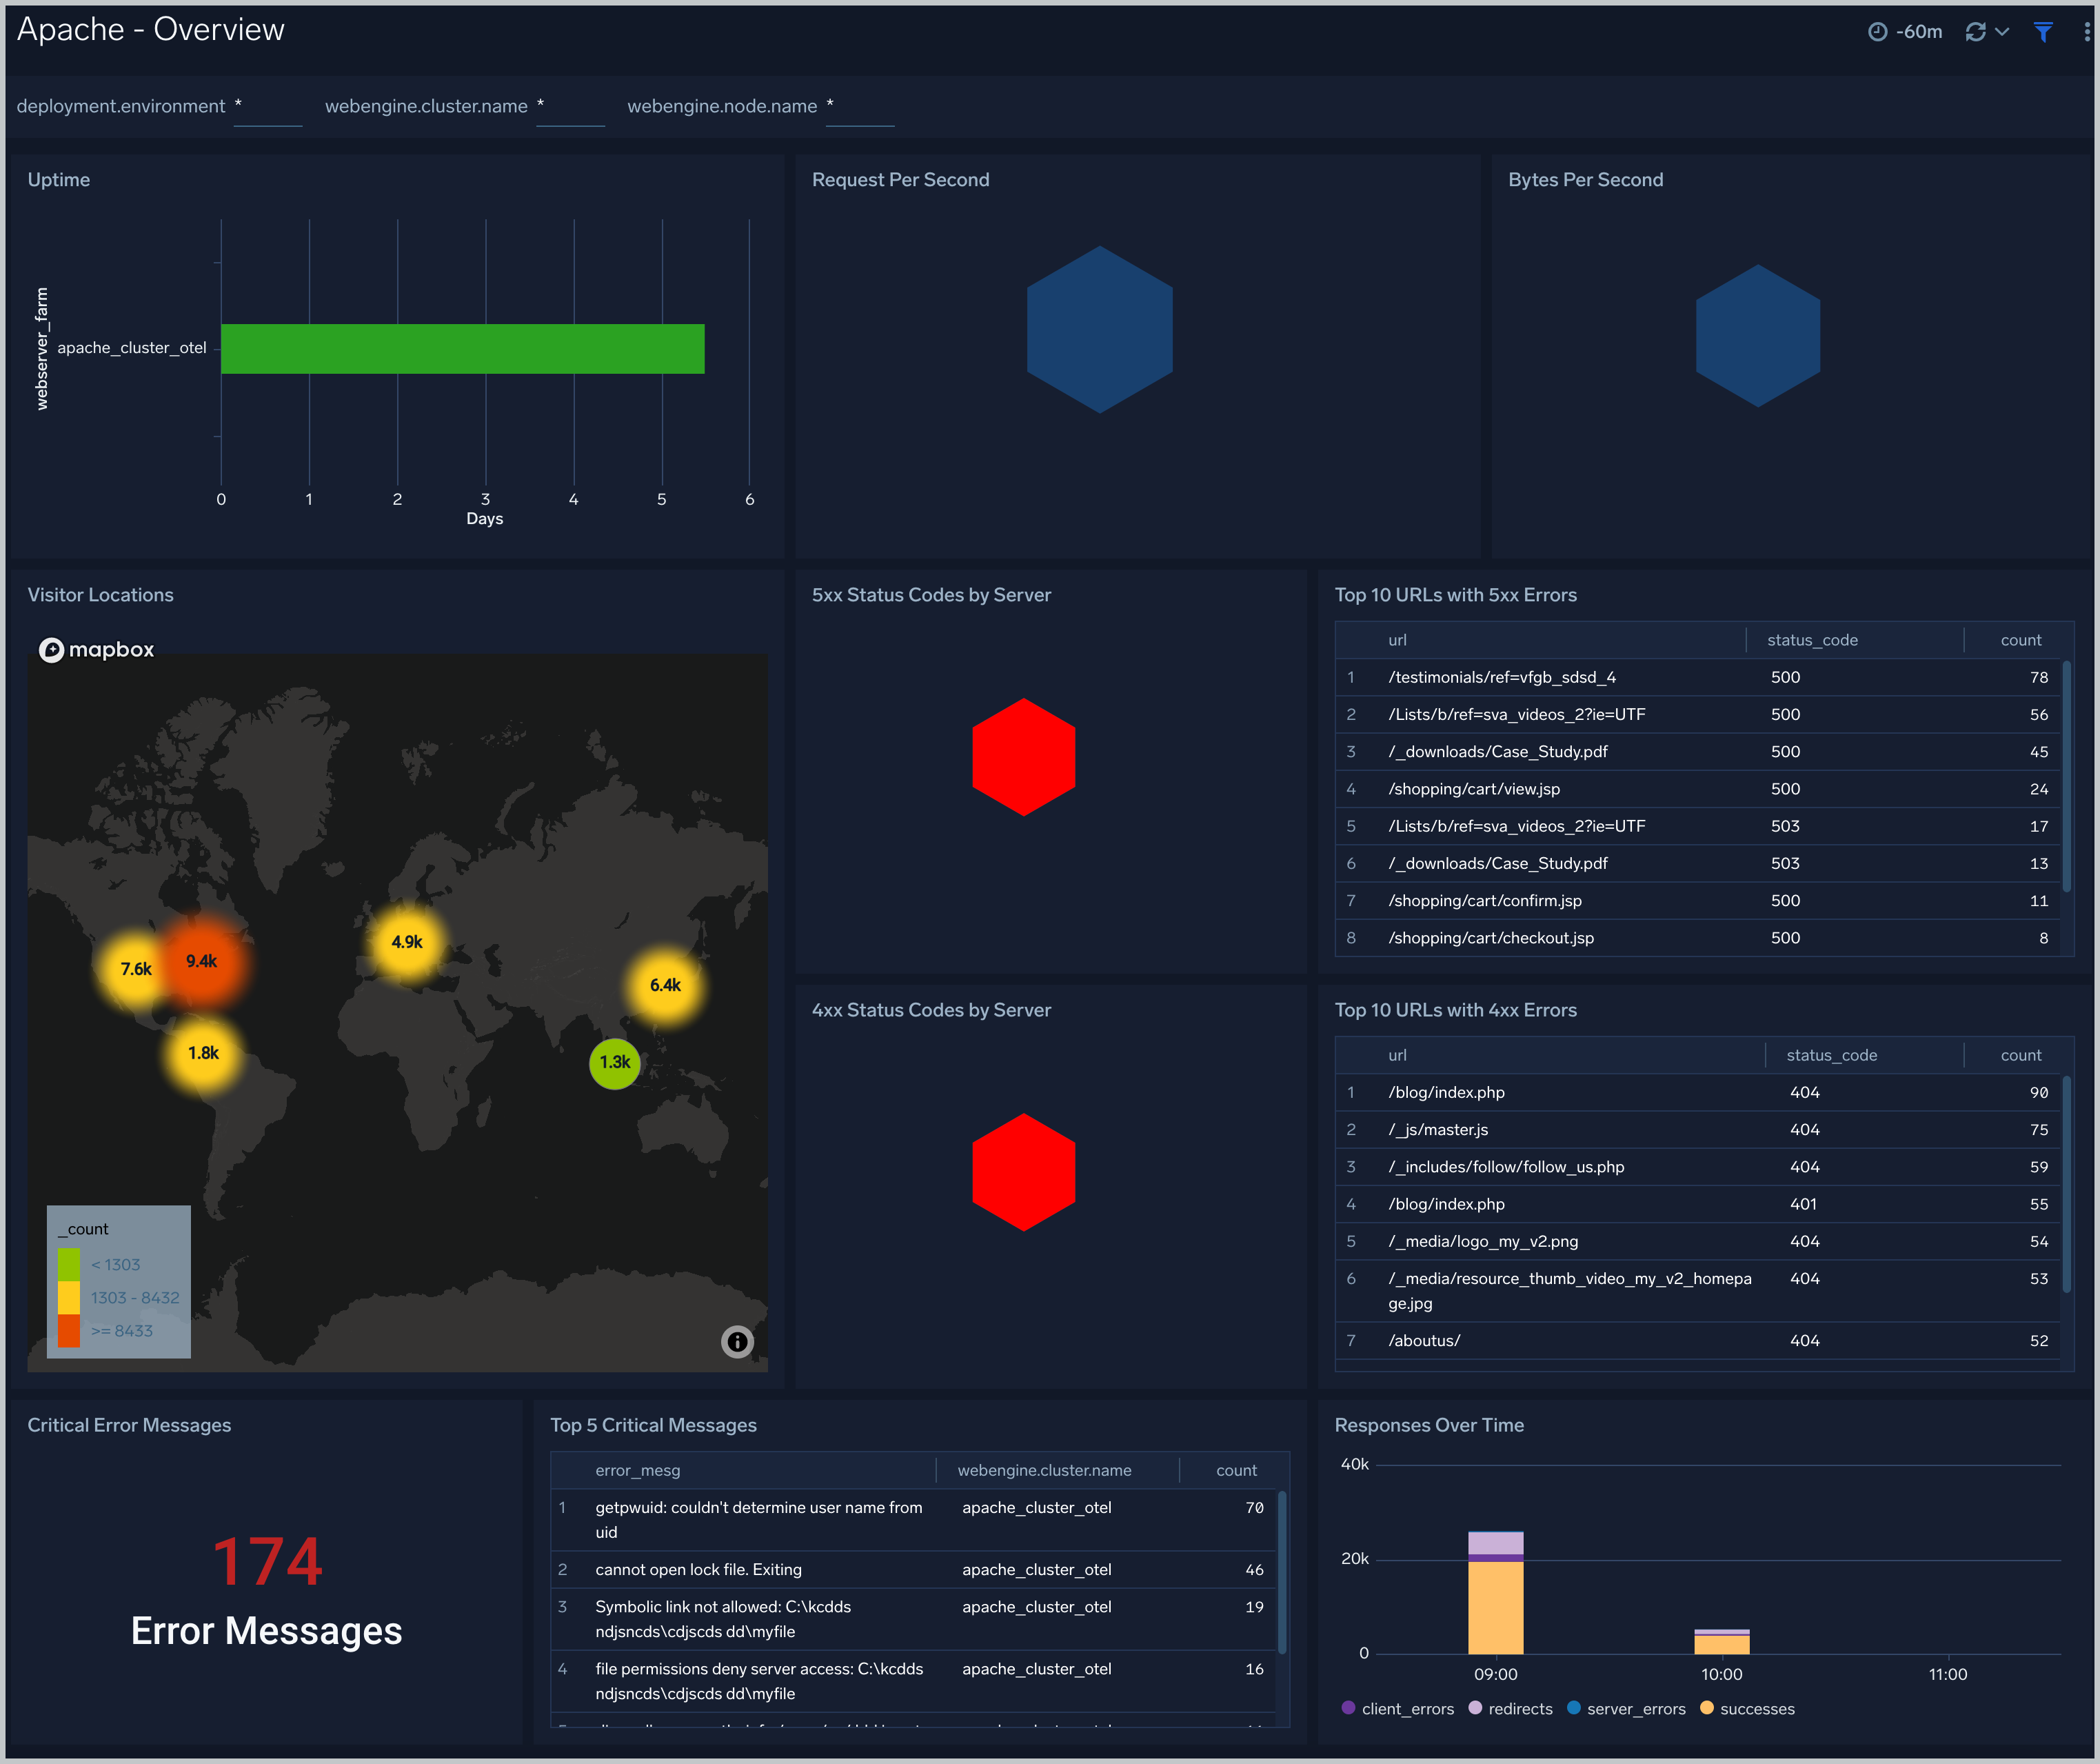
### Overview
The **Apache - Overview** Dashboard provides an at-a-glance view of the activity and health of the Apache web server farms, and servers by monitoring uptime, requests, response, traffic, visitor geographic locations, and critical error messages.
Use this dashboard to:
- Get an at-a-glance view of the state of all your Apache web servers.
- Identify the top URLs causing errors.
- Identify the top critical error messages.
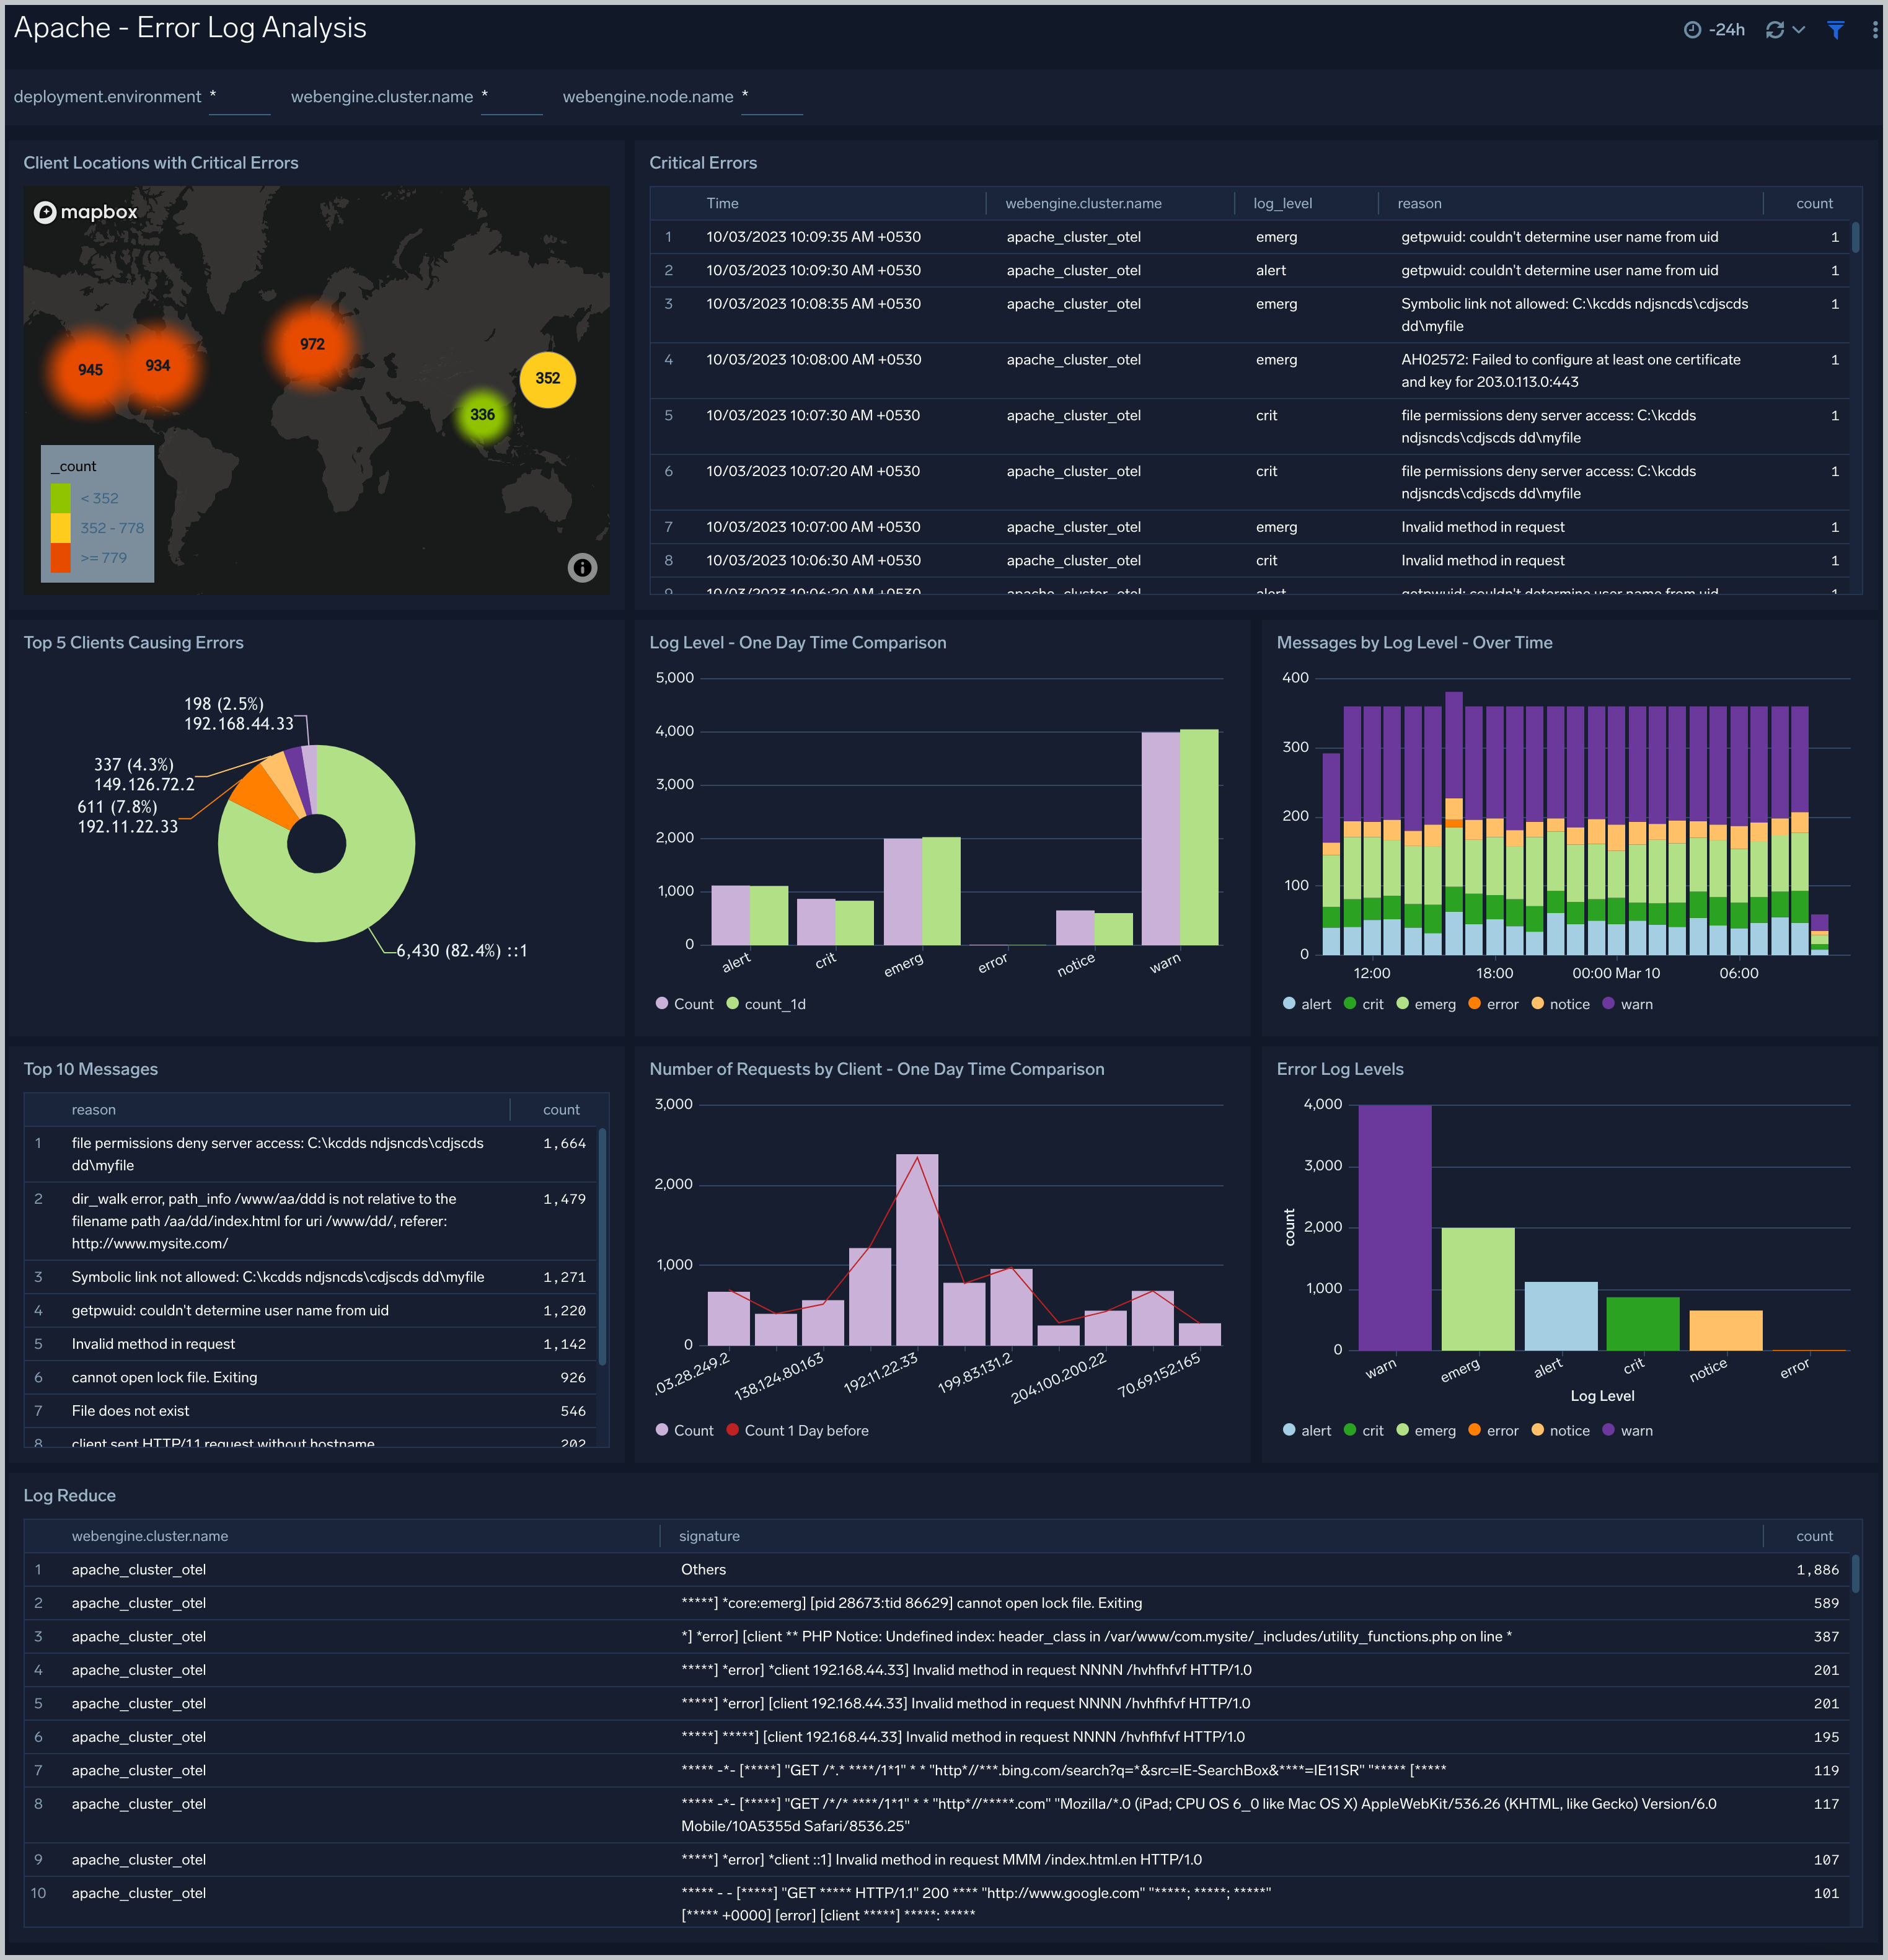
 ### Error Log Analysis
The **Apache - Error Log Analysis** dashboard provides a high-level view of error log levels, clients causing errors, critical error messages and trends.
Use this dashboard to:
- Quickly identify critical errors affecting your Apache web servers.
- Analyze types and patterns of log messages in your Apache web servers.
- Identify clients causing the most errors.
- Monitor trends in error logs and identify outliers.
### Error Log Analysis
The **Apache - Error Log Analysis** dashboard provides a high-level view of error log levels, clients causing errors, critical error messages and trends.
Use this dashboard to:
- Quickly identify critical errors affecting your Apache web servers.
- Analyze types and patterns of log messages in your Apache web servers.
- Identify clients causing the most errors.
- Monitor trends in error logs and identify outliers.
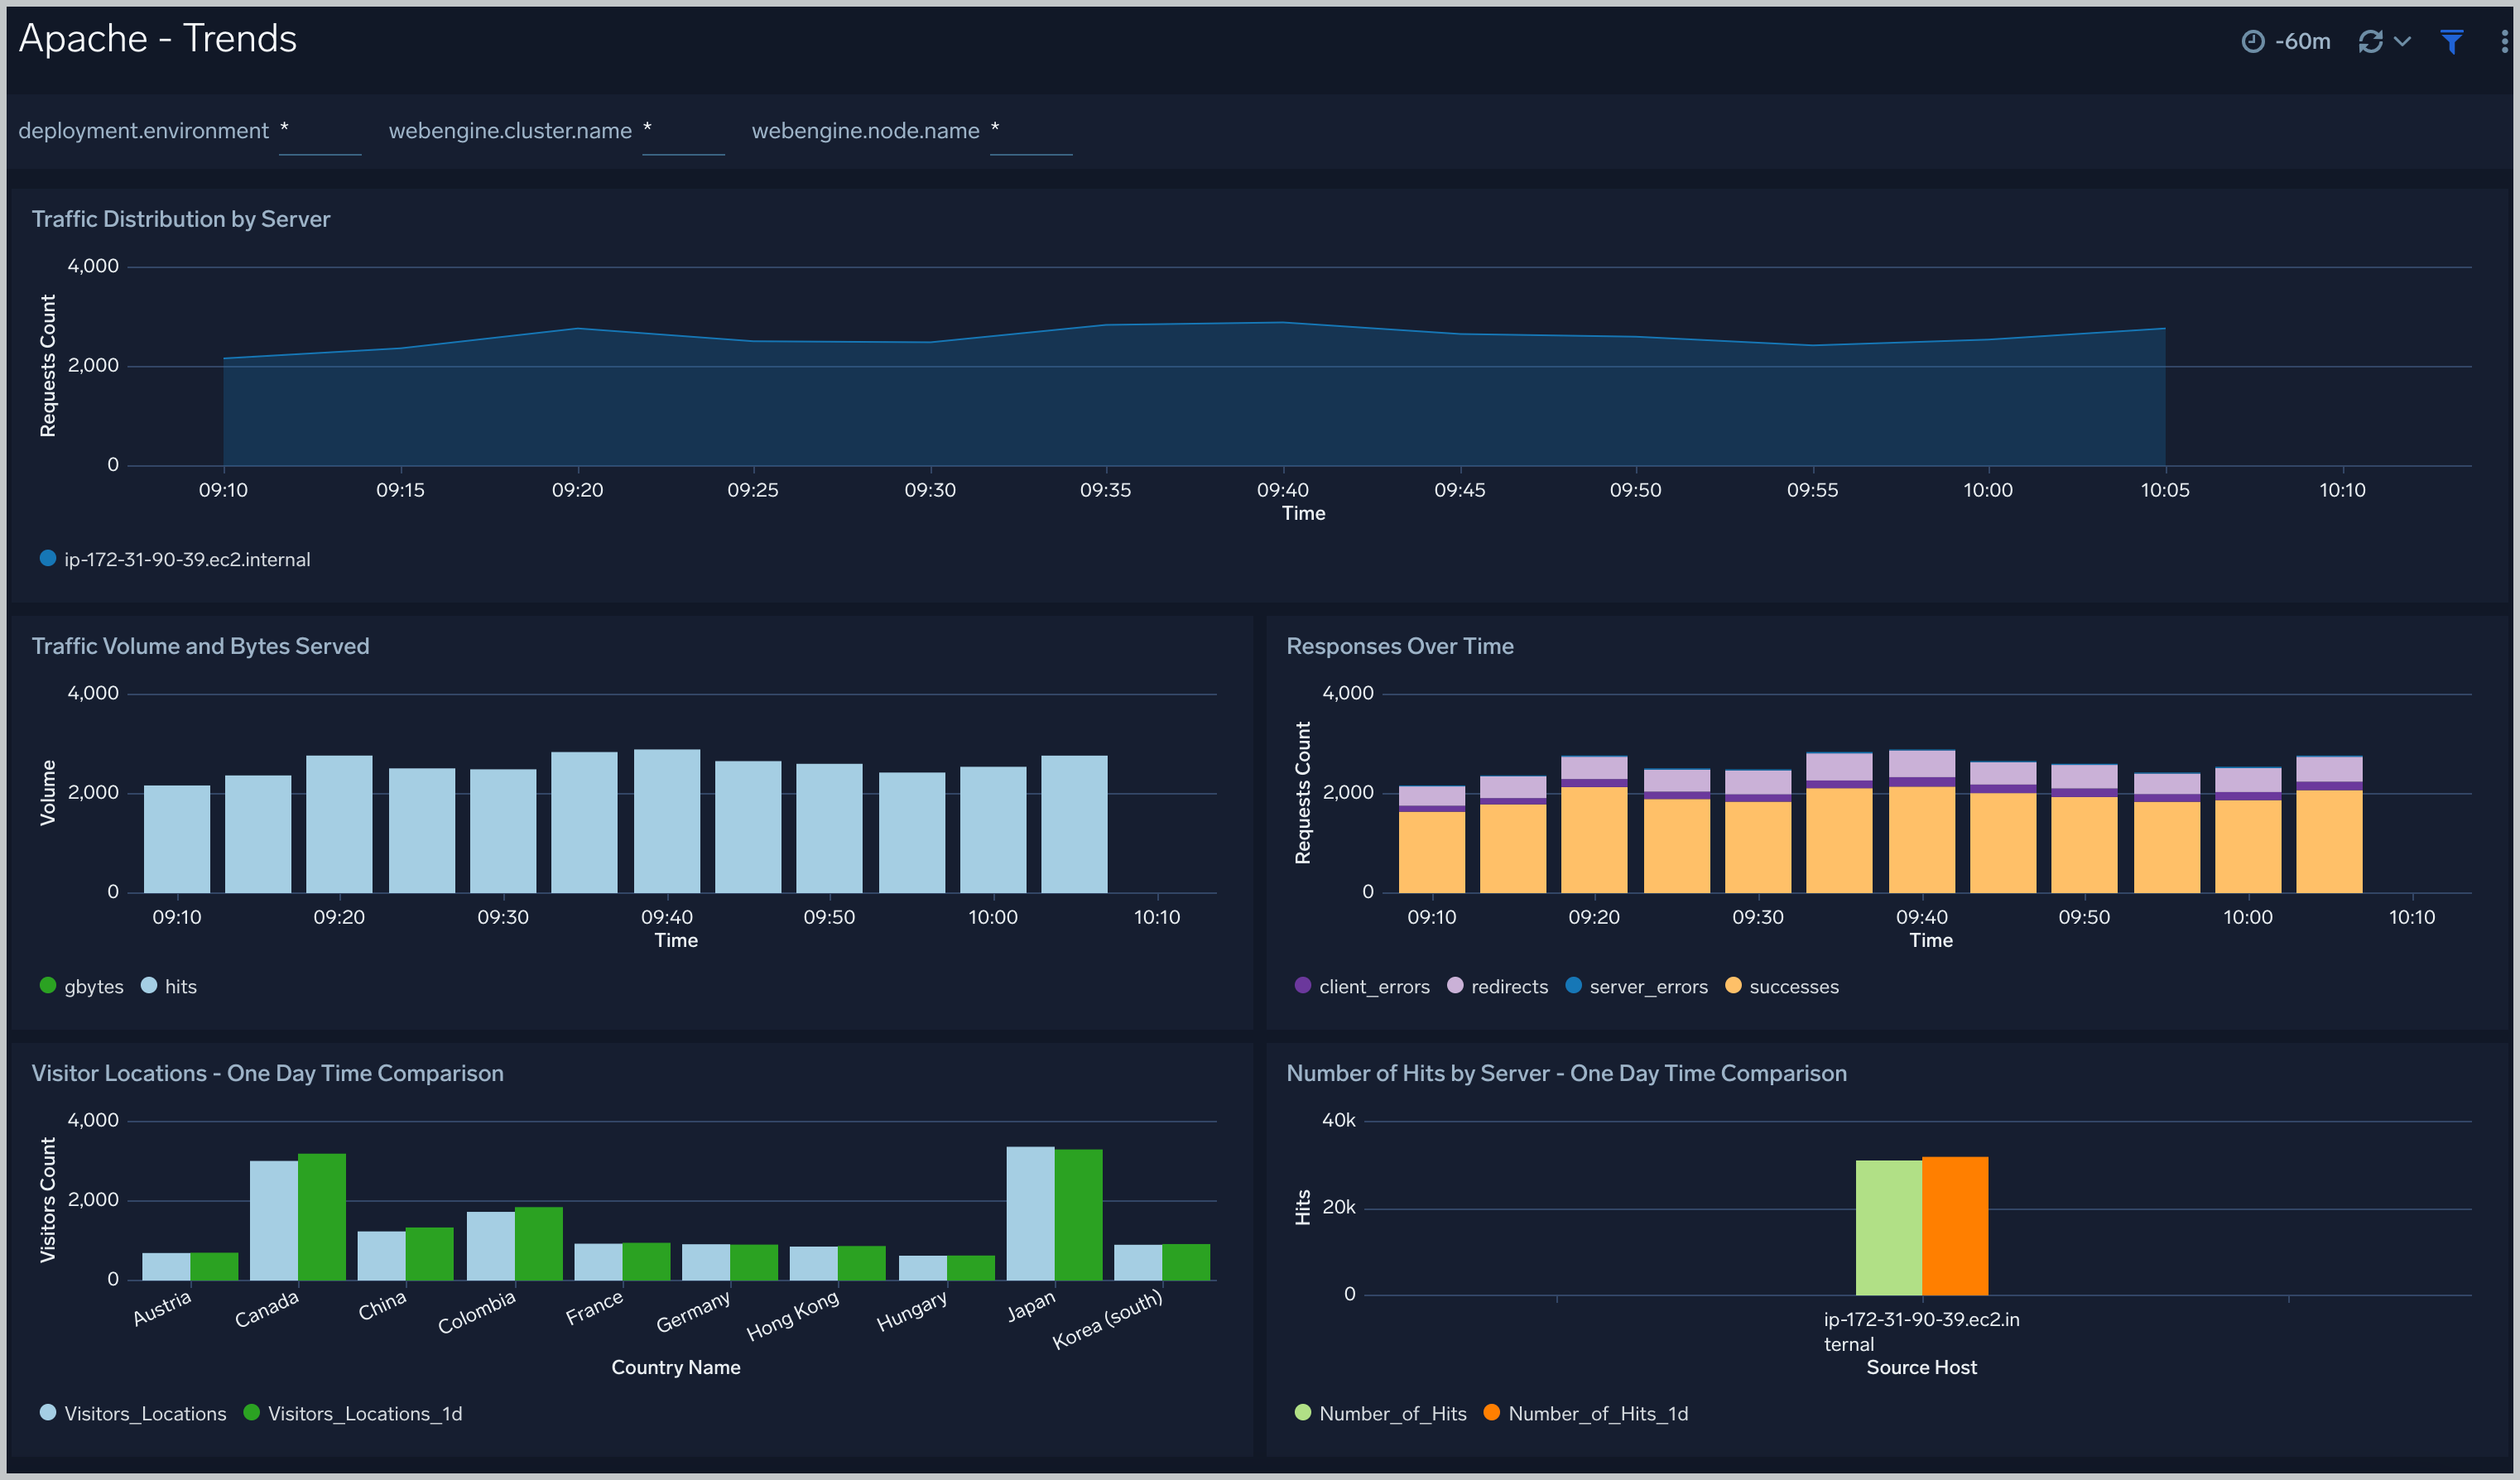
 ### Trends
The **Apache - Trends** dashboard provides trends around HTTP responses, server hits, visitor locations, traffic volume and distribution. Use this dashboard to monitor trends and identify outliers.
### Trends
The **Apache - Trends** dashboard provides trends around HTTP responses, server hits, visitor locations, traffic volume and distribution. Use this dashboard to monitor trends and identify outliers.
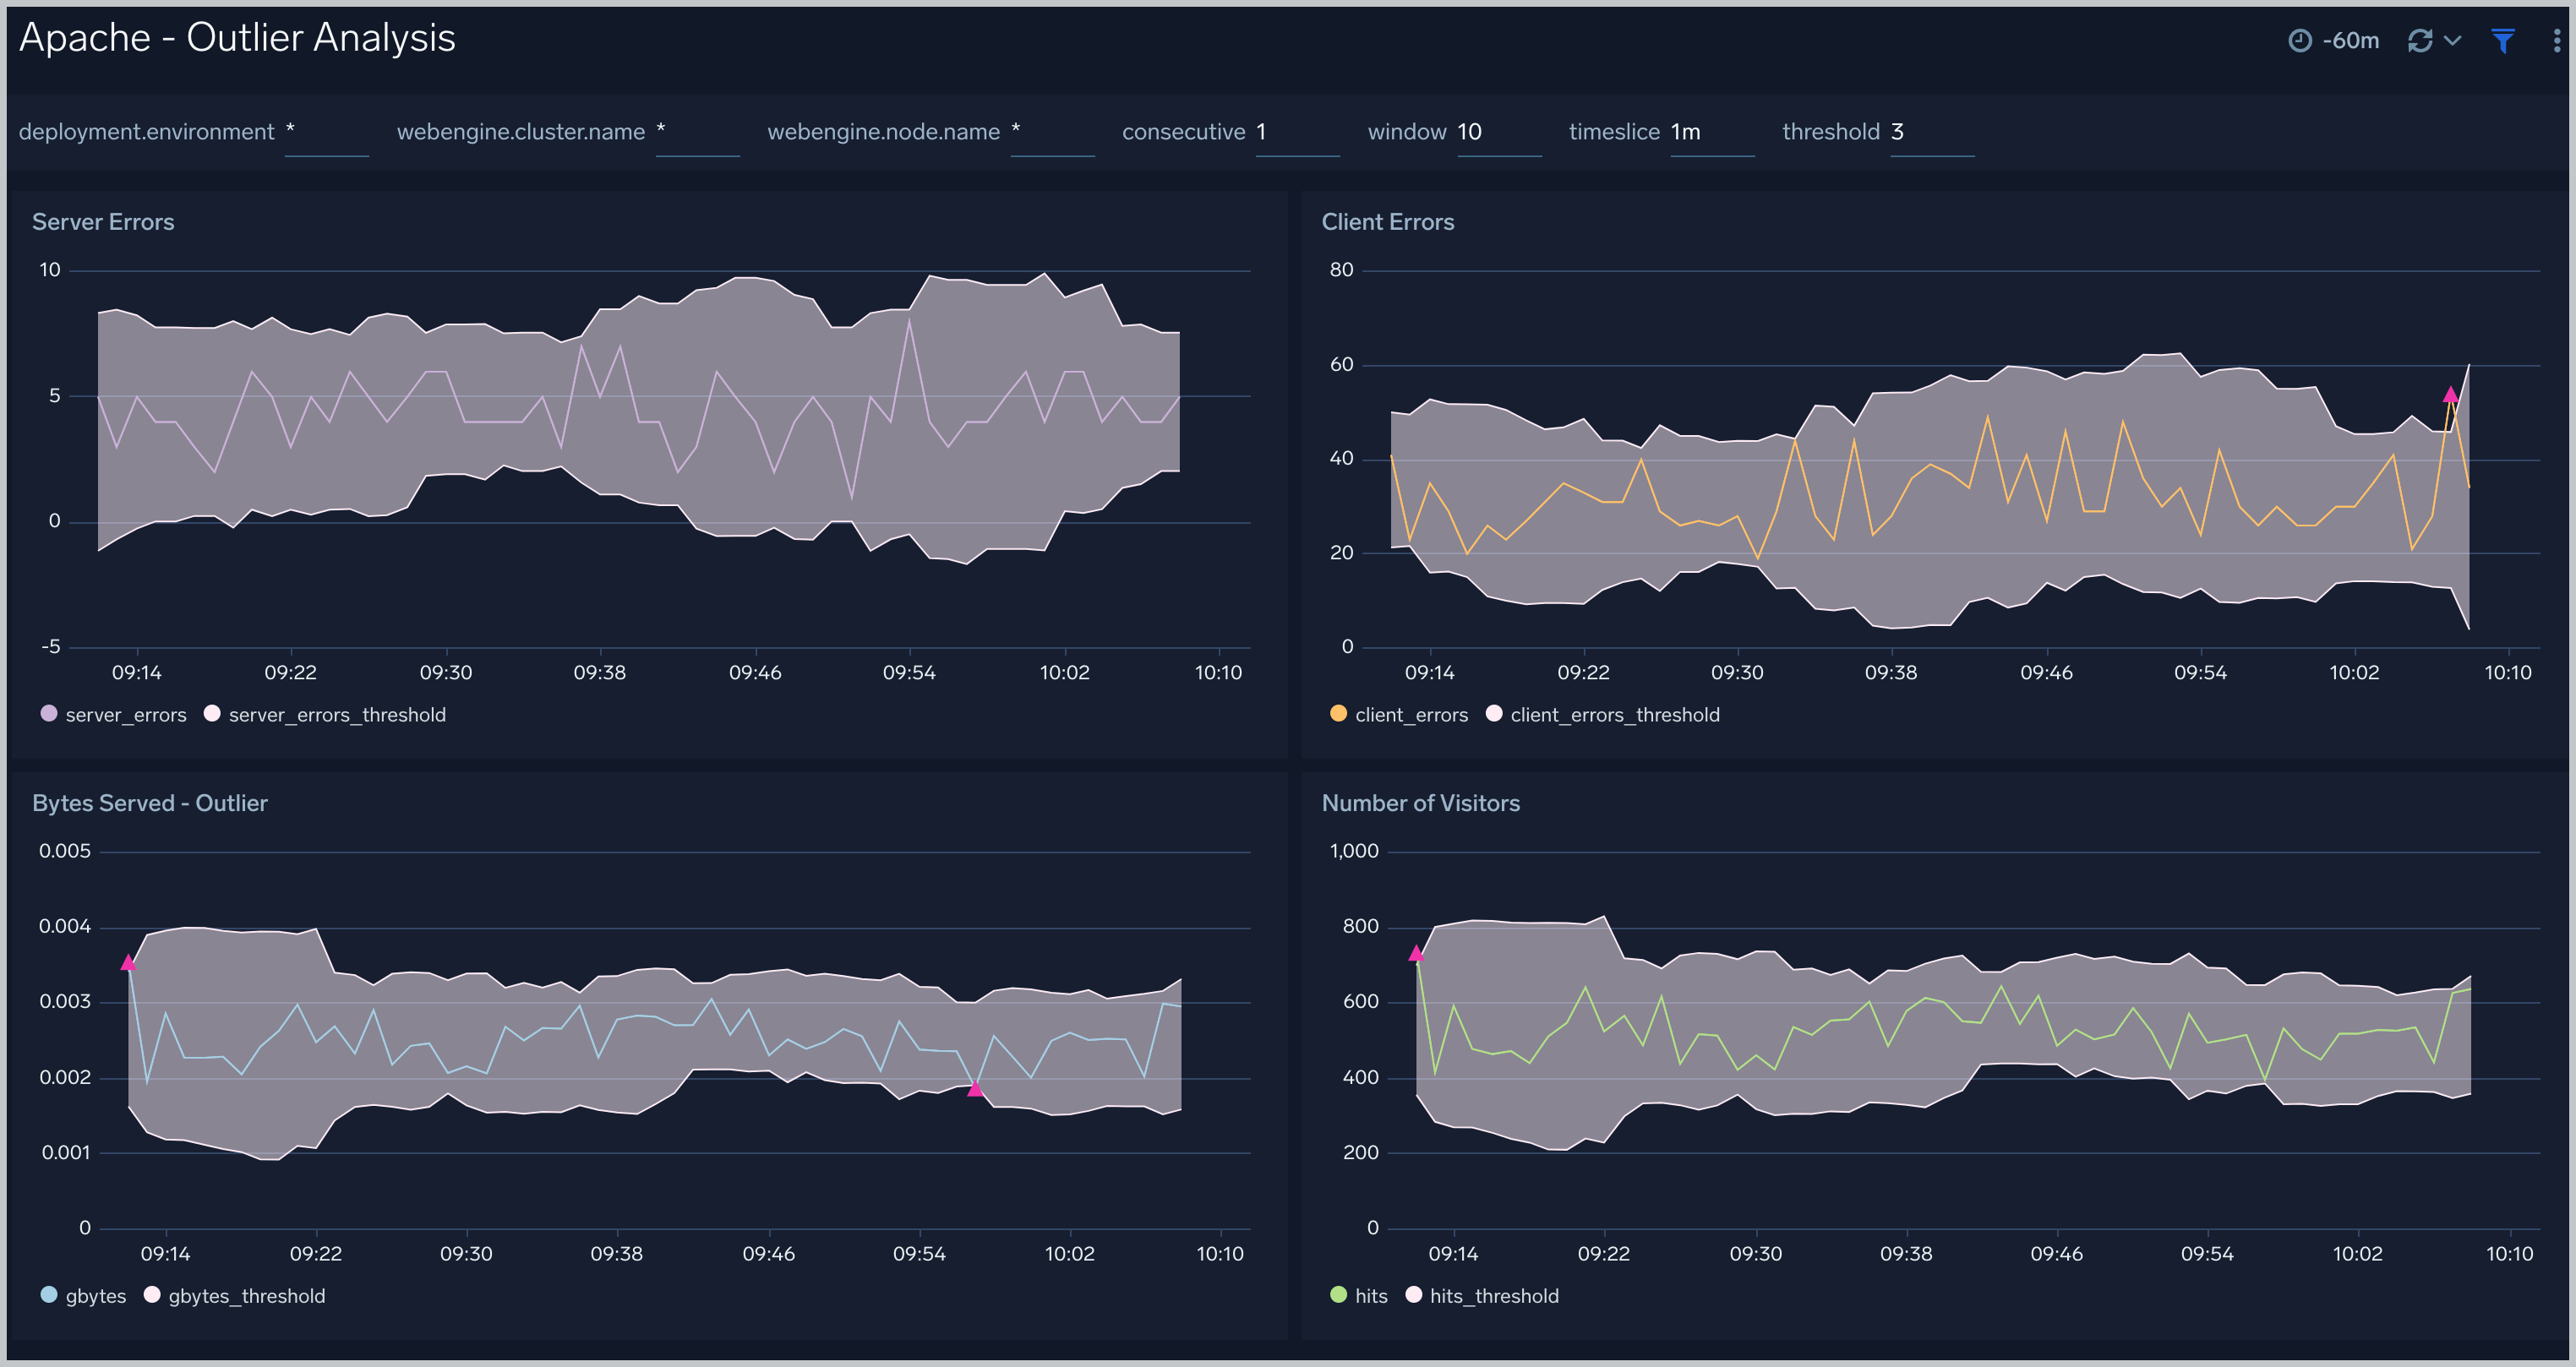
 ### Outlier Analysis
The **Apache - Outlier Analysis** dashboard helps you quickly identify outliers for key Apache metrics such bytes served, number of visitors, server errors, and client errors. Use this dashboard to automatically detect outliers in the operations of your Apache web servers and take corrective actions if needed.
### Outlier Analysis
The **Apache - Outlier Analysis** dashboard helps you quickly identify outliers for key Apache metrics such bytes served, number of visitors, server errors, and client errors. Use this dashboard to automatically detect outliers in the operations of your Apache web servers and take corrective actions if needed.
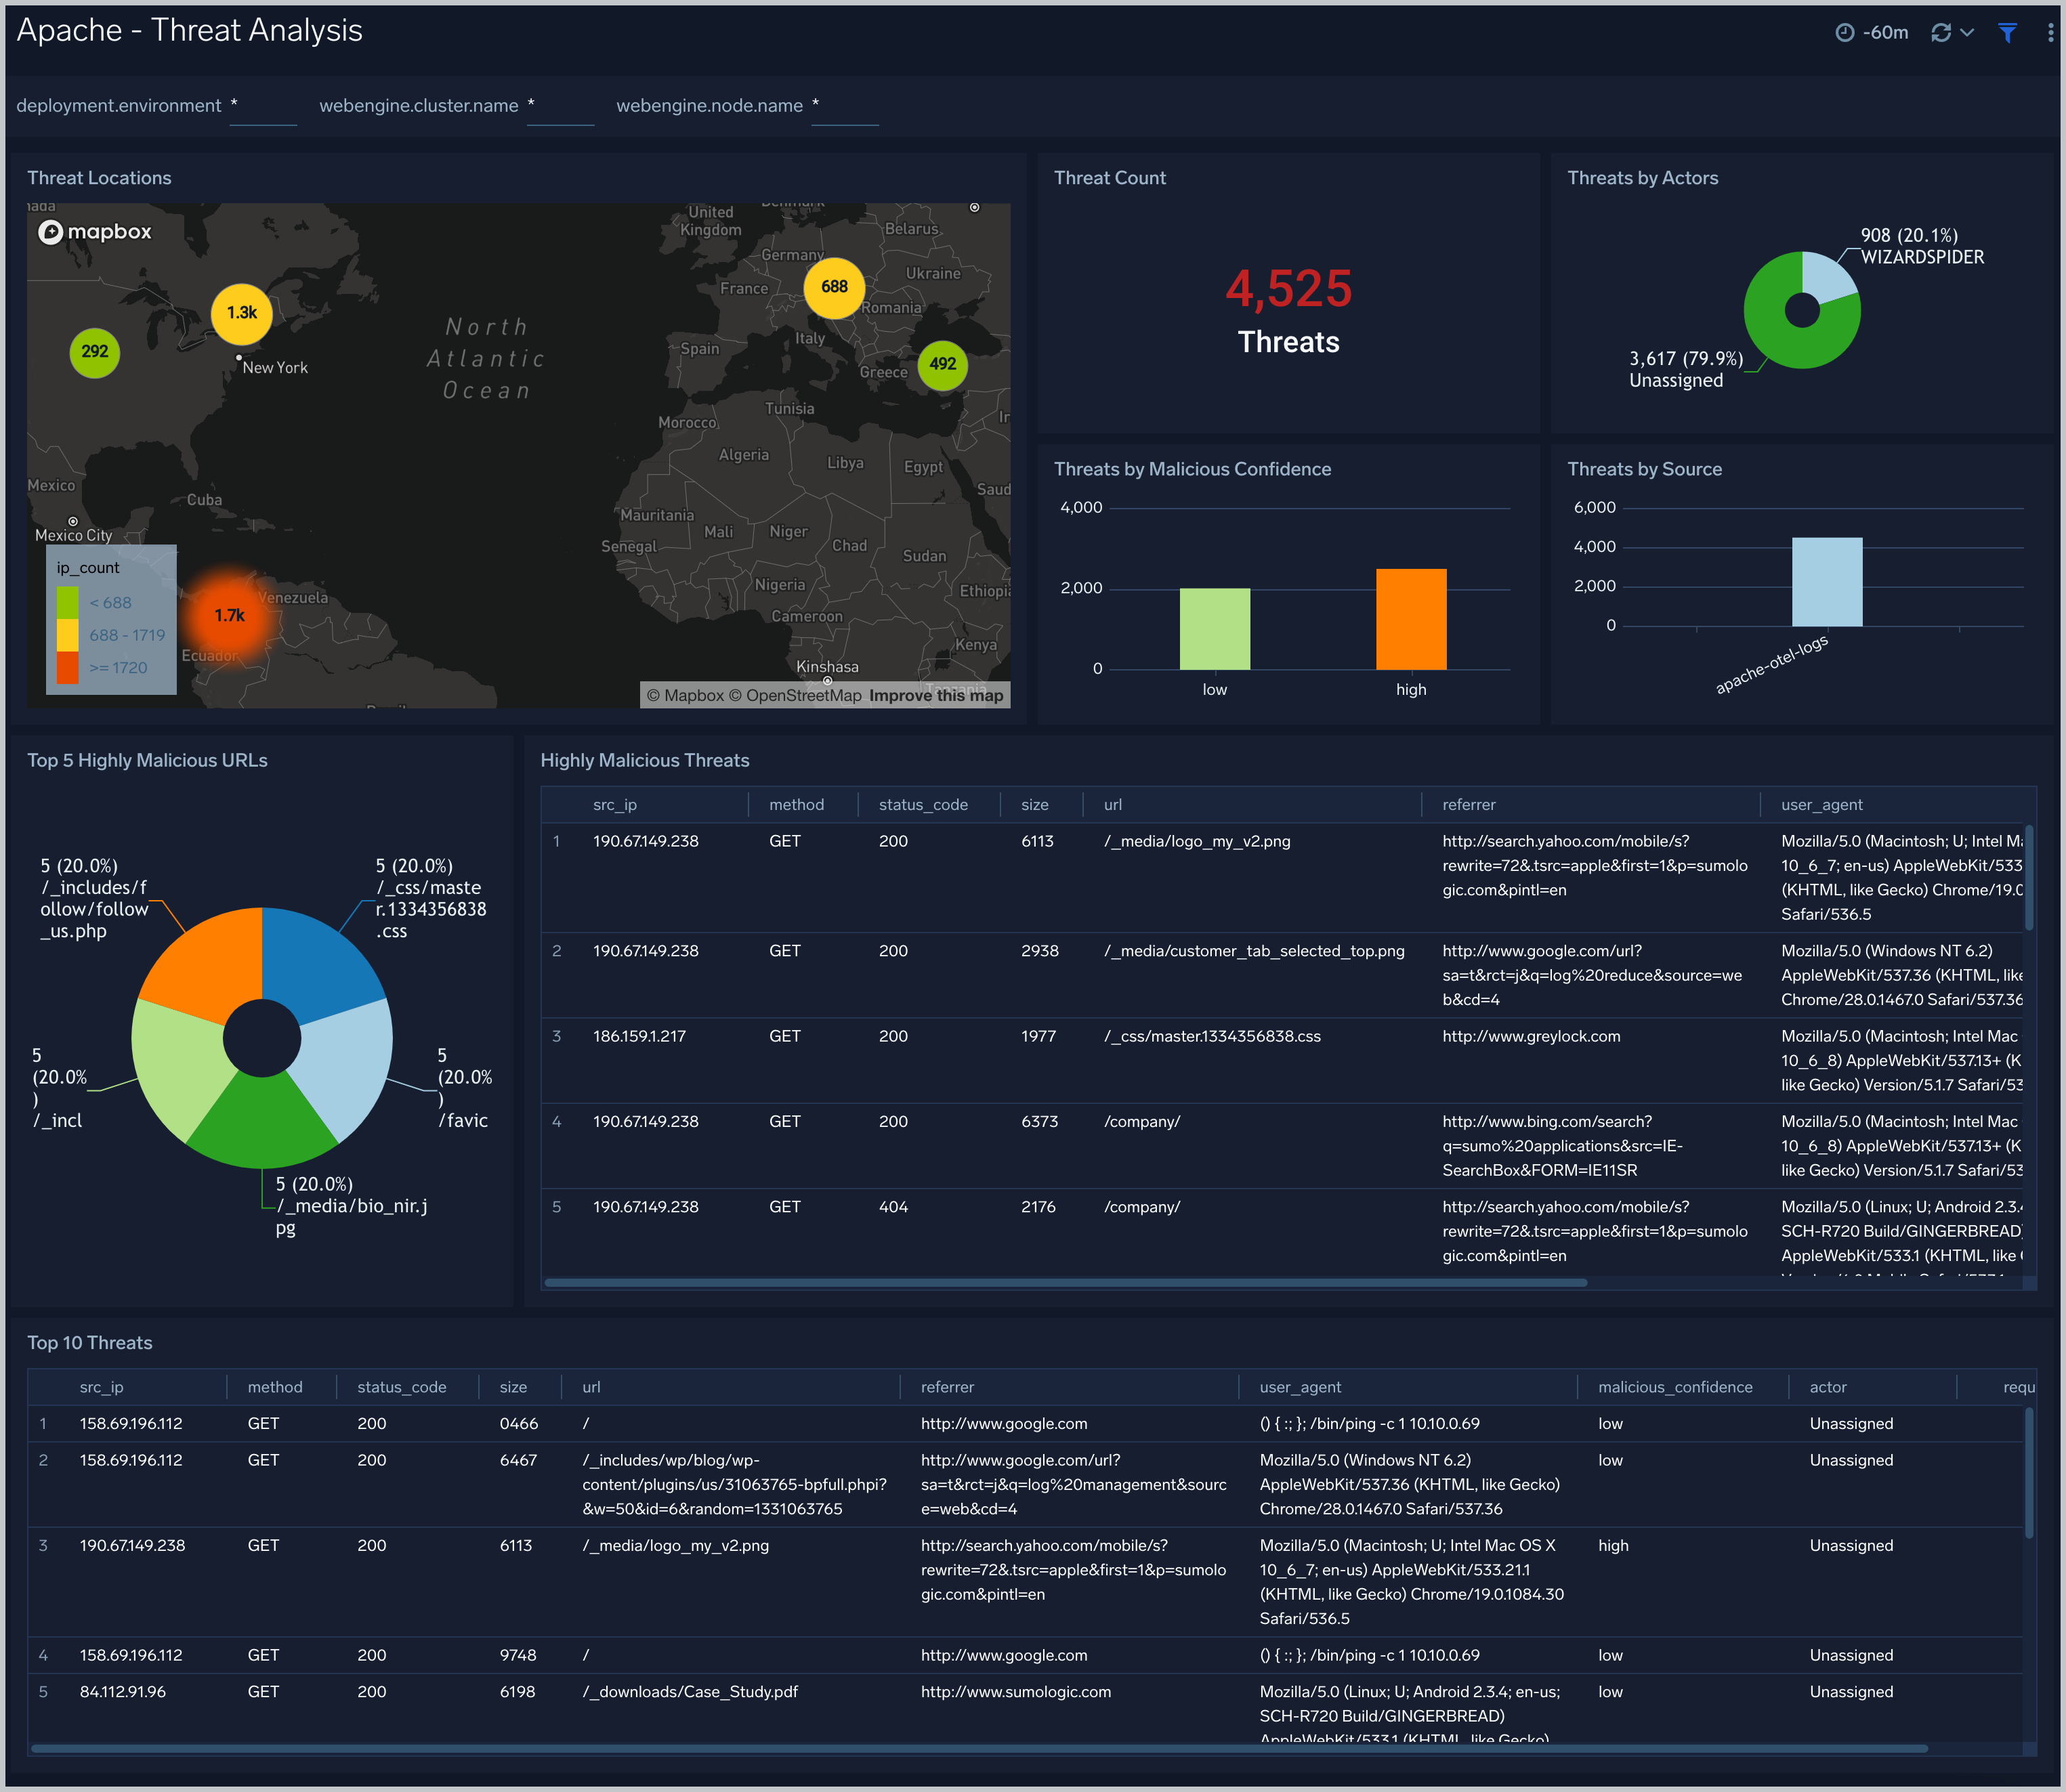
 ### Threat Analysis
The **Apache - Threat Analysis** dashboard provides an at-a-glance view of incoming threats to your Apache servers based on known malicious IP addresses. Dashboard panels displays the insights on the threat counts, geographic locations, actors, threat severity, and URLS accessed. Use this dashboard to identify threats from incoming traffic based on incoming client IP addresses and discover potential IOCs.
### Threat Analysis
The **Apache - Threat Analysis** dashboard provides an at-a-glance view of incoming threats to your Apache servers based on known malicious IP addresses. Dashboard panels displays the insights on the threat counts, geographic locations, actors, threat severity, and URLS accessed. Use this dashboard to identify threats from incoming traffic based on incoming client IP addresses and discover potential IOCs.
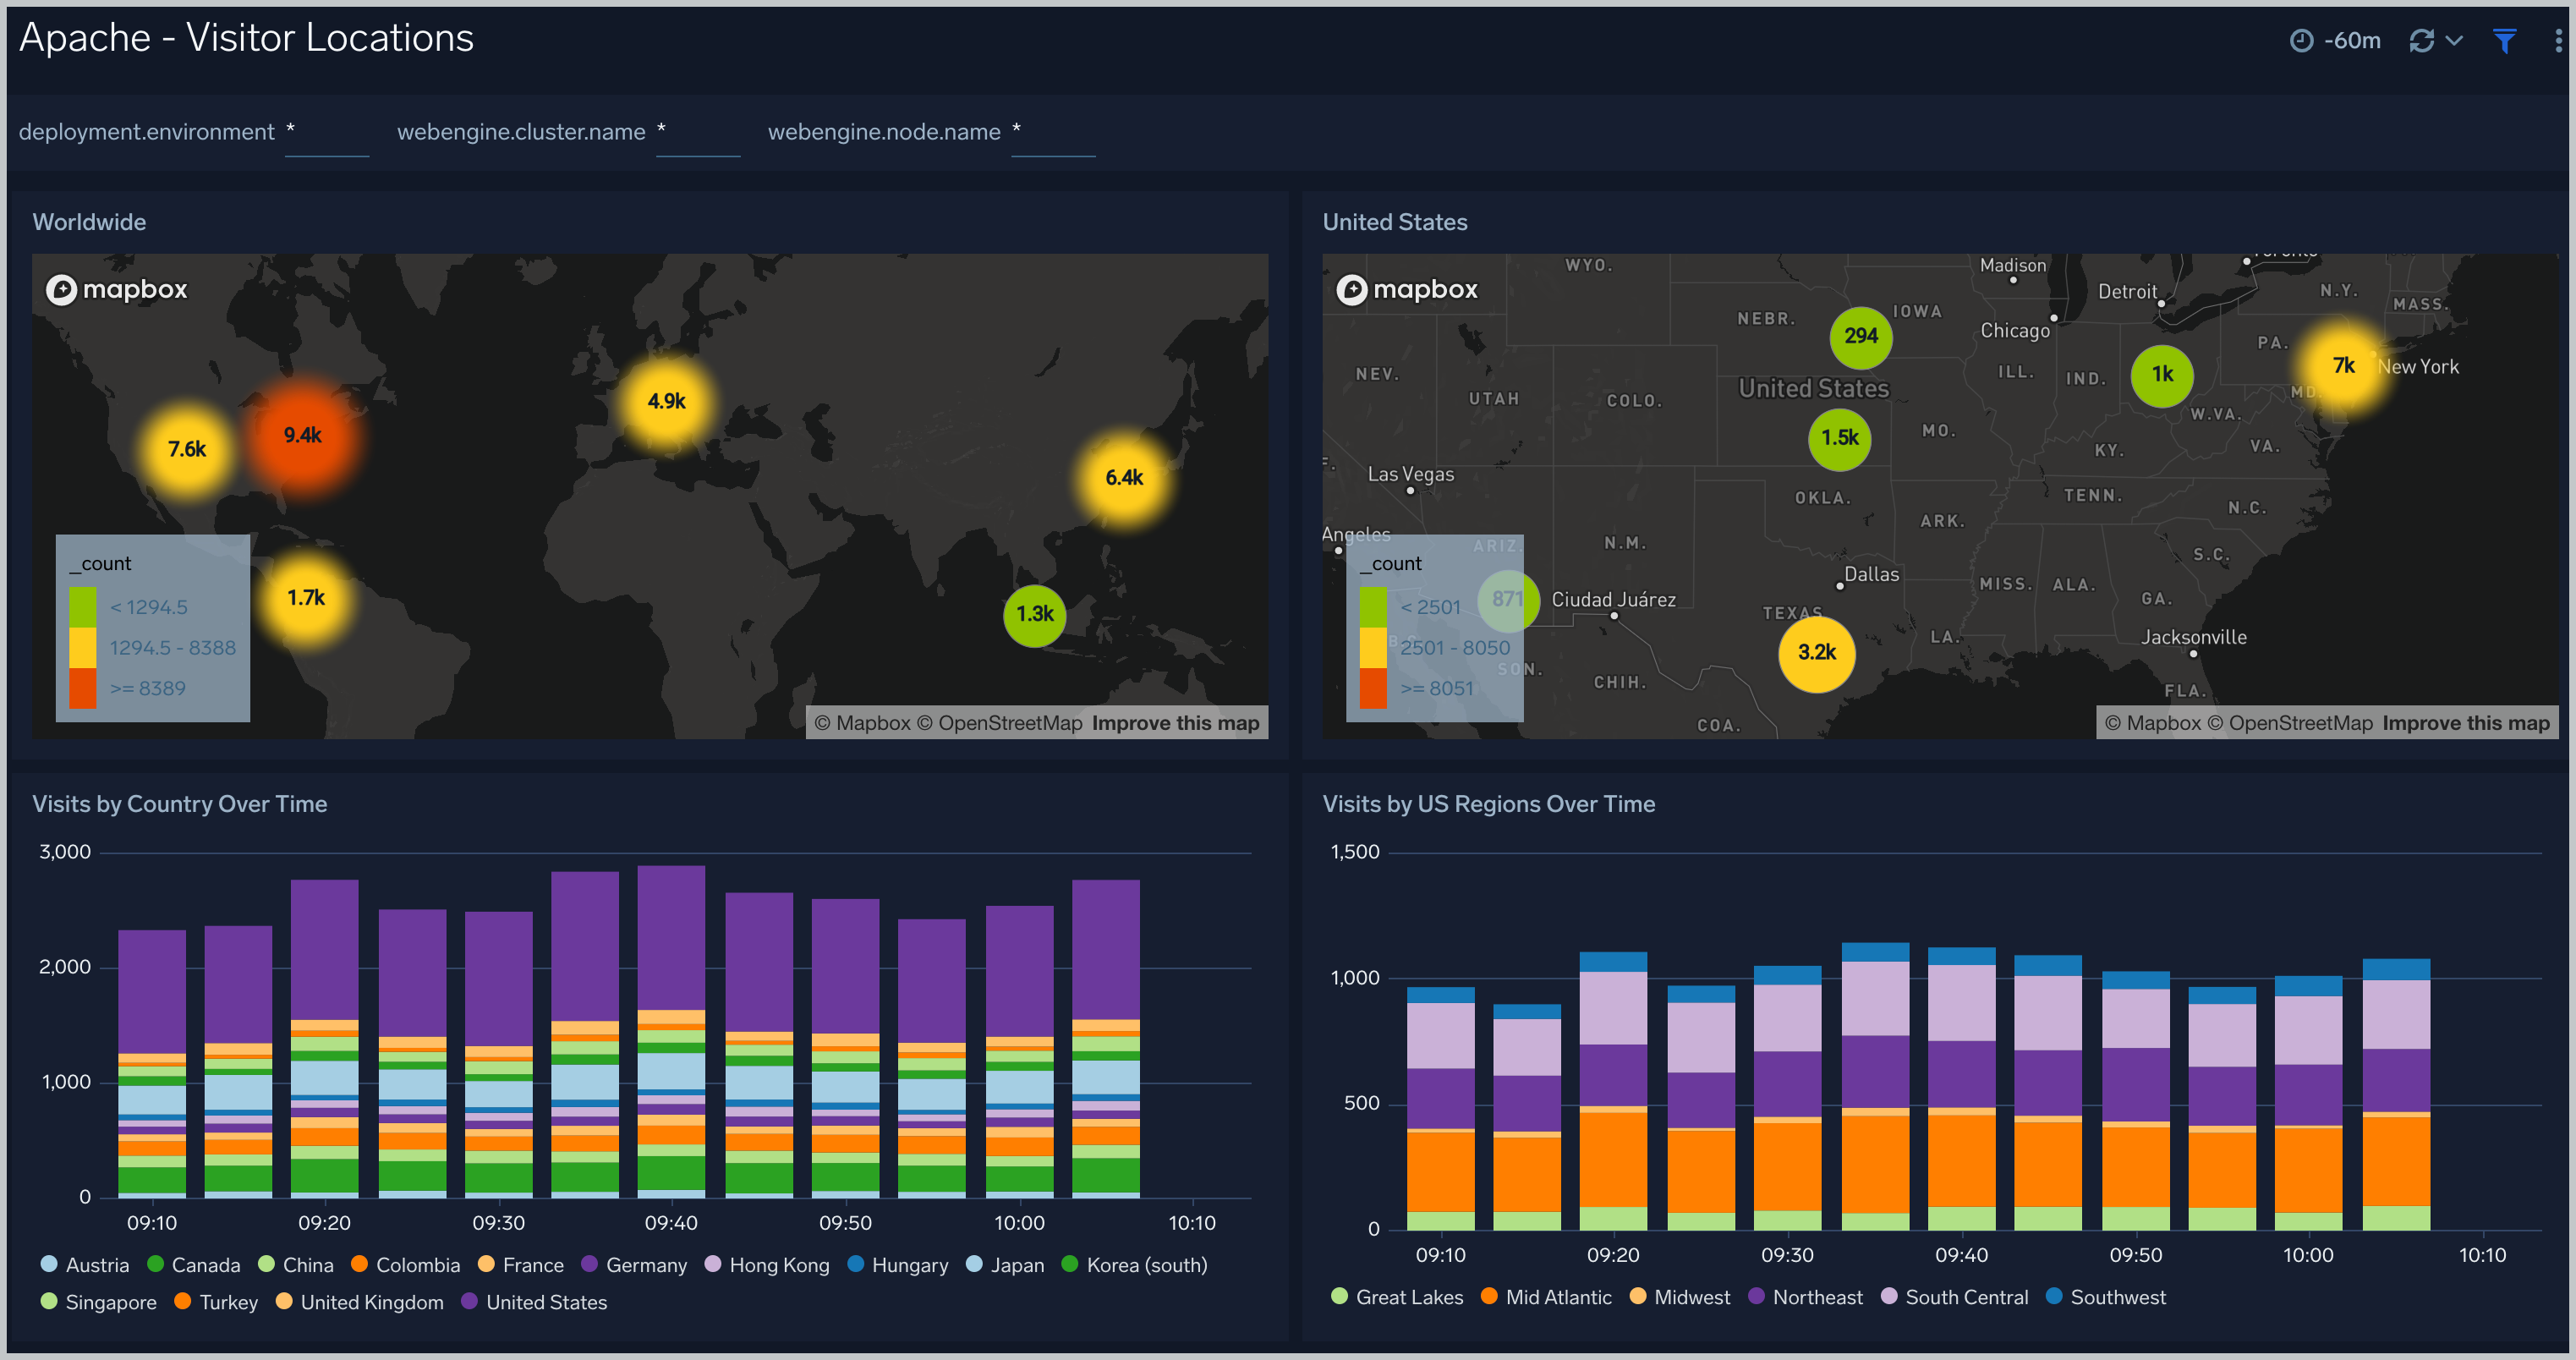
 ### Visitor Locations
The **Apache - Visitor Locations** dashboard provides a high-level view of Apache visitor geographic locations both worldwide and in the United States. Use this dashboard to obtain insights into geographic locations of your user base.
### Visitor Locations
The **Apache - Visitor Locations** dashboard provides a high-level view of Apache visitor geographic locations both worldwide and in the United States. Use this dashboard to obtain insights into geographic locations of your user base.
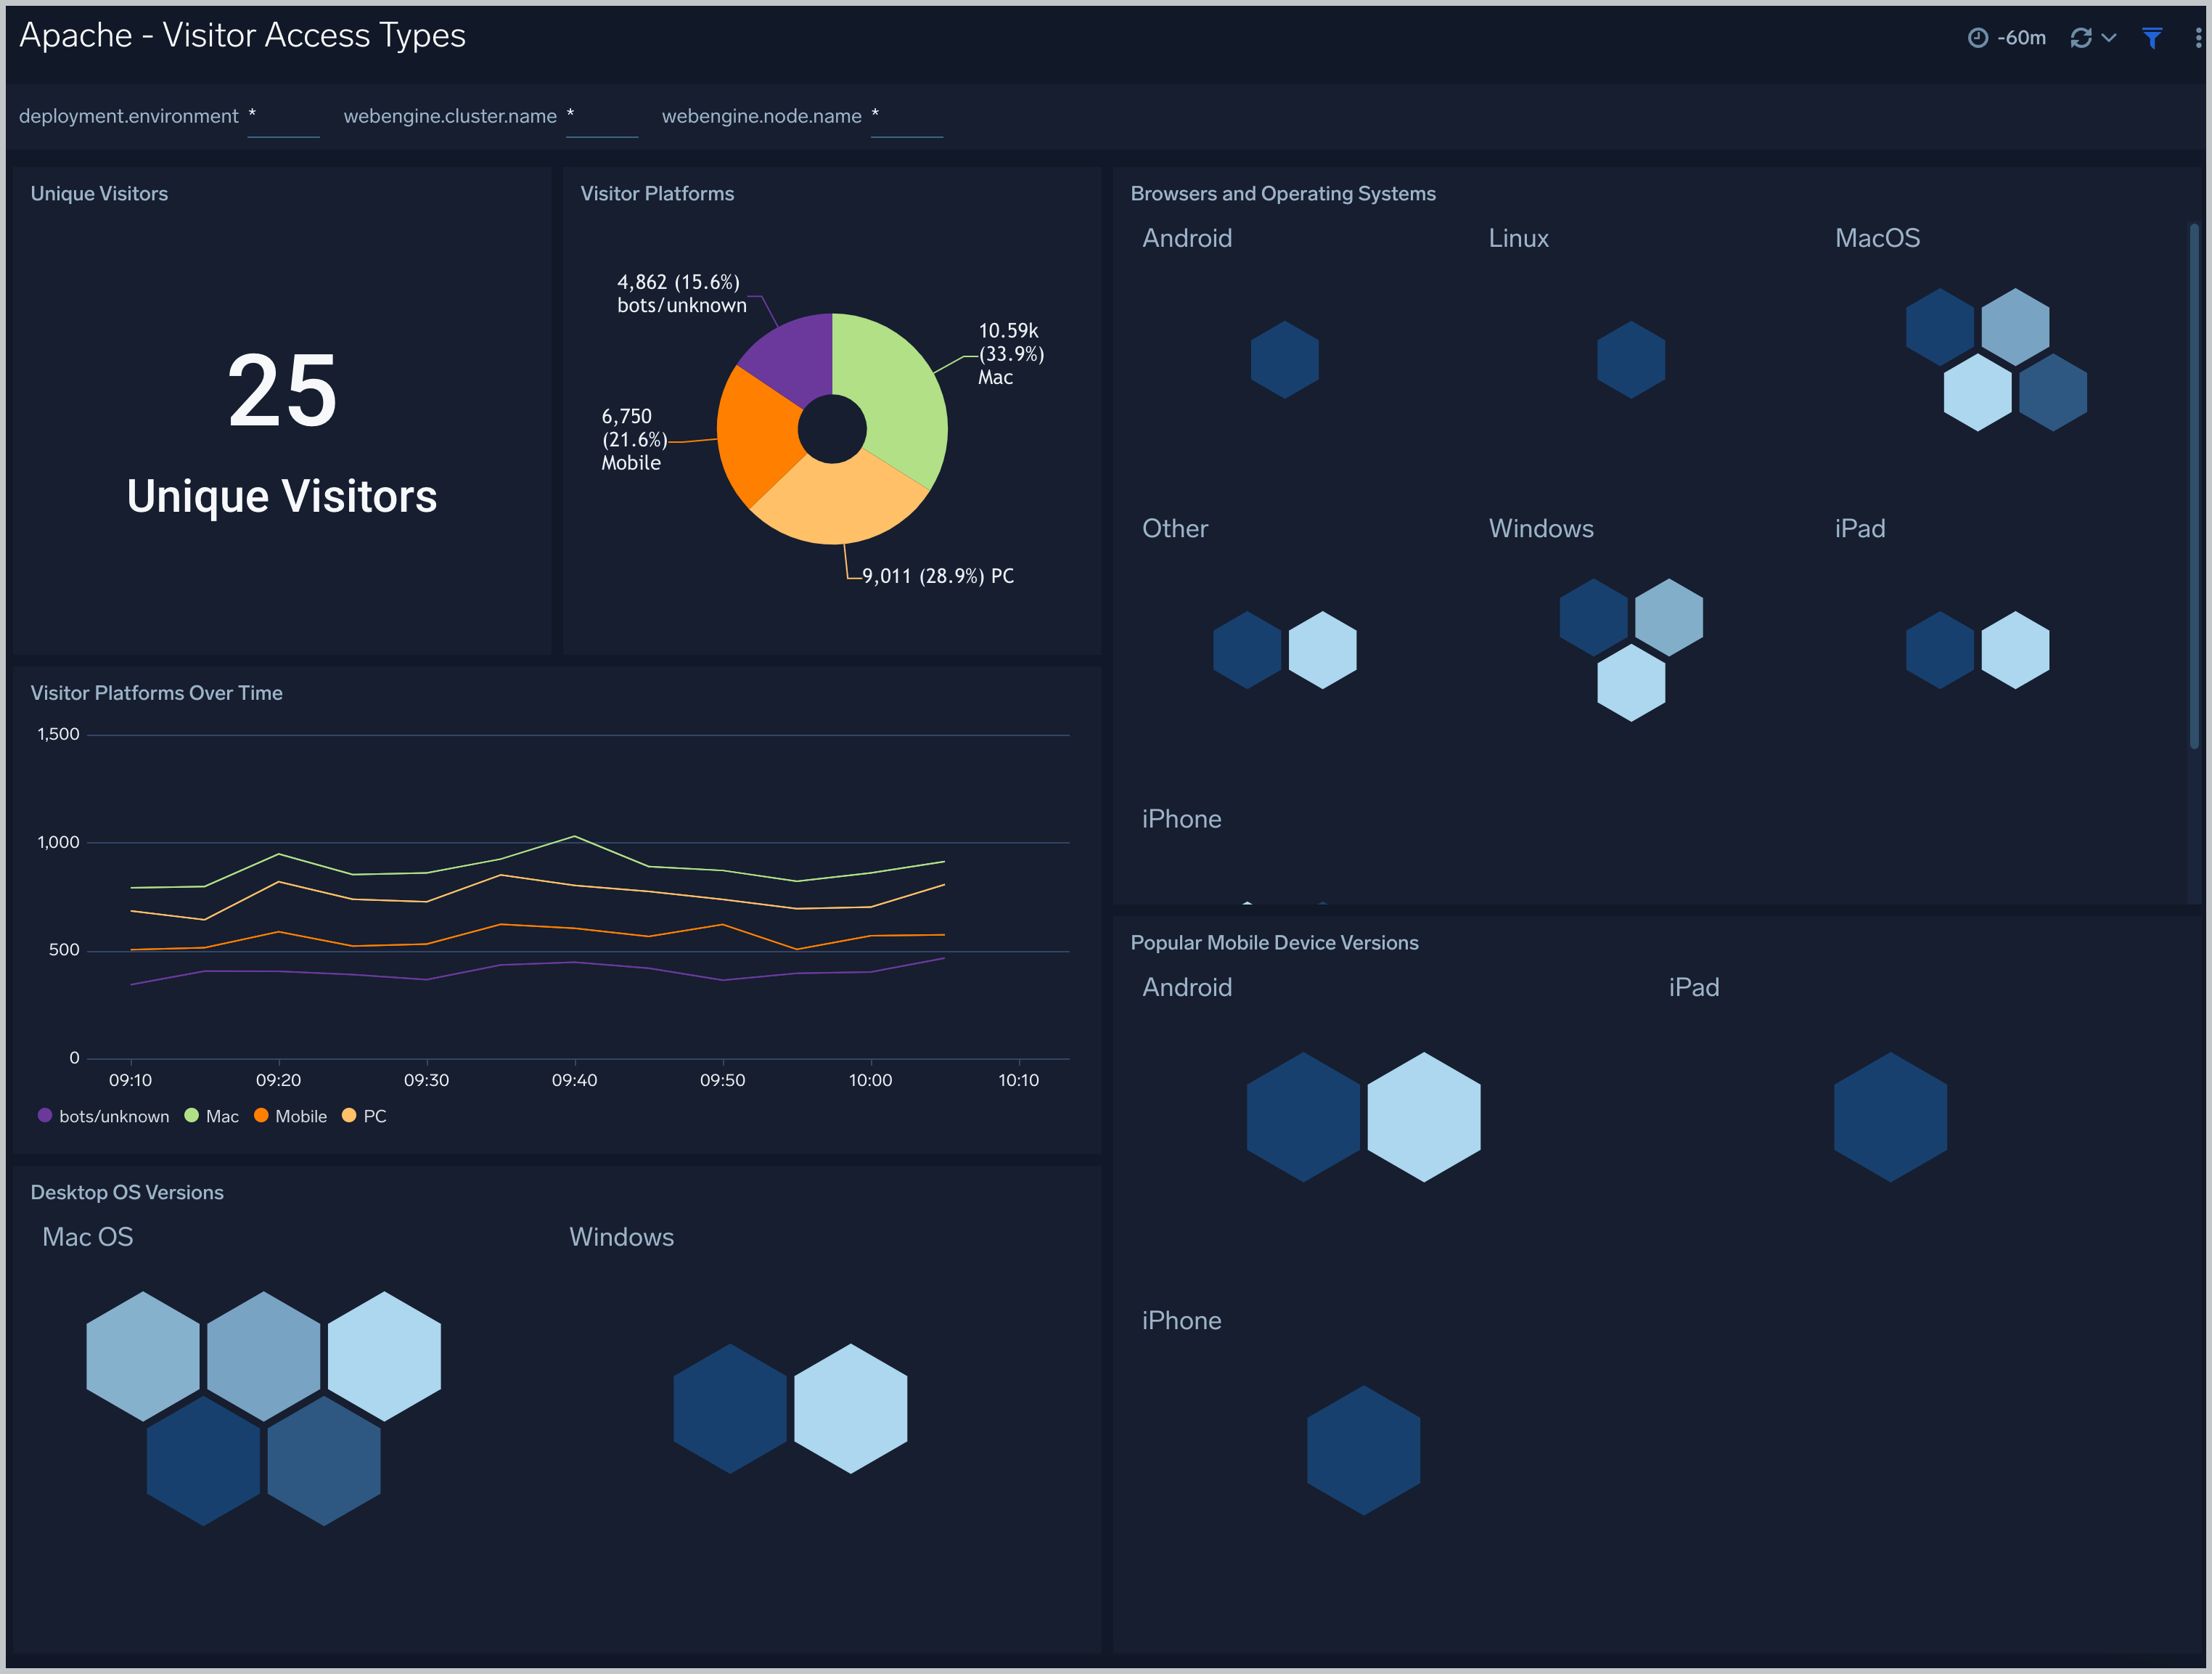
 ### Visitor Access Types
The **Apache - Visitor Access Types** dashboard provides insights into visitor platform types, browsers, device types, and operating systems. Use this dashboard to understand the platform and browsers that are being used to access your applications.
### Visitor Access Types
The **Apache - Visitor Access Types** dashboard provides insights into visitor platform types, browsers, device types, and operating systems. Use this dashboard to understand the platform and browsers that are being used to access your applications.
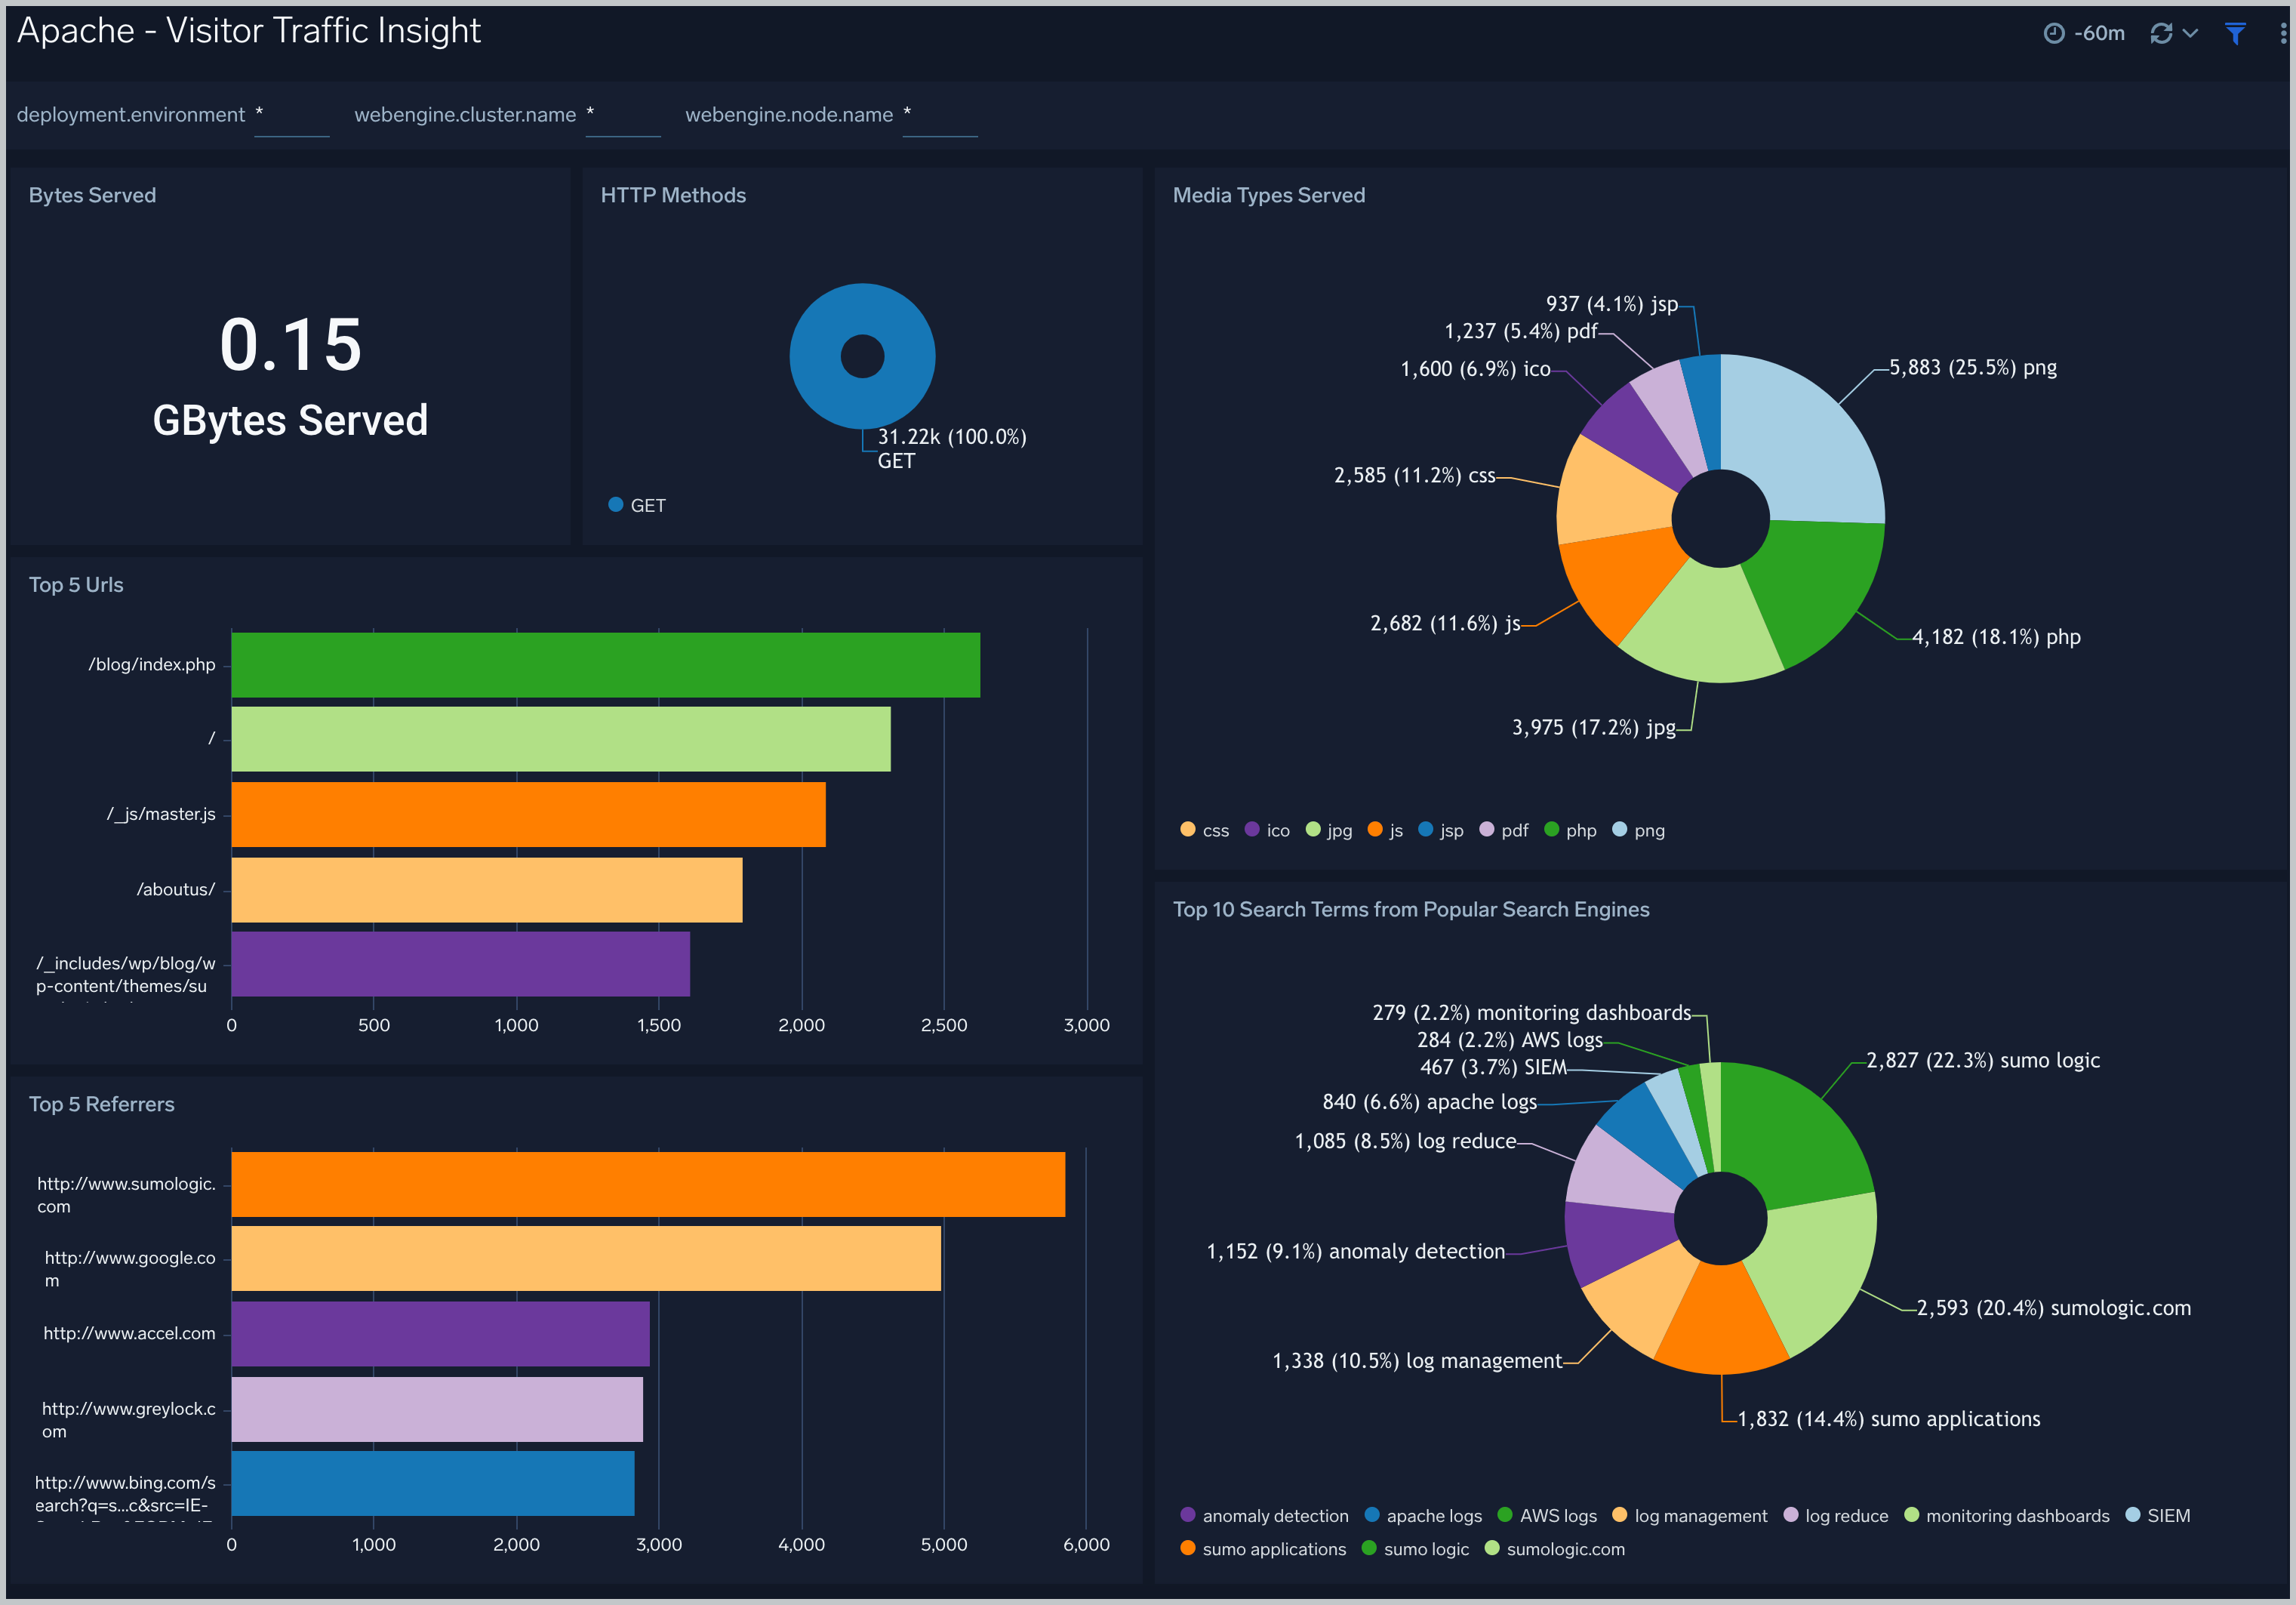
 ### Visitor Traffic Insight
The **Apache - Visitor Traffic Insight** dashboard provides summarized information on the top URLs, referrers, search terms, and media types served. Use this dashboard to understand the content types of content that are frequently requested by users.
### Visitor Traffic Insight
The **Apache - Visitor Traffic Insight** dashboard provides summarized information on the top URLs, referrers, search terms, and media types served. Use this dashboard to understand the content types of content that are frequently requested by users.
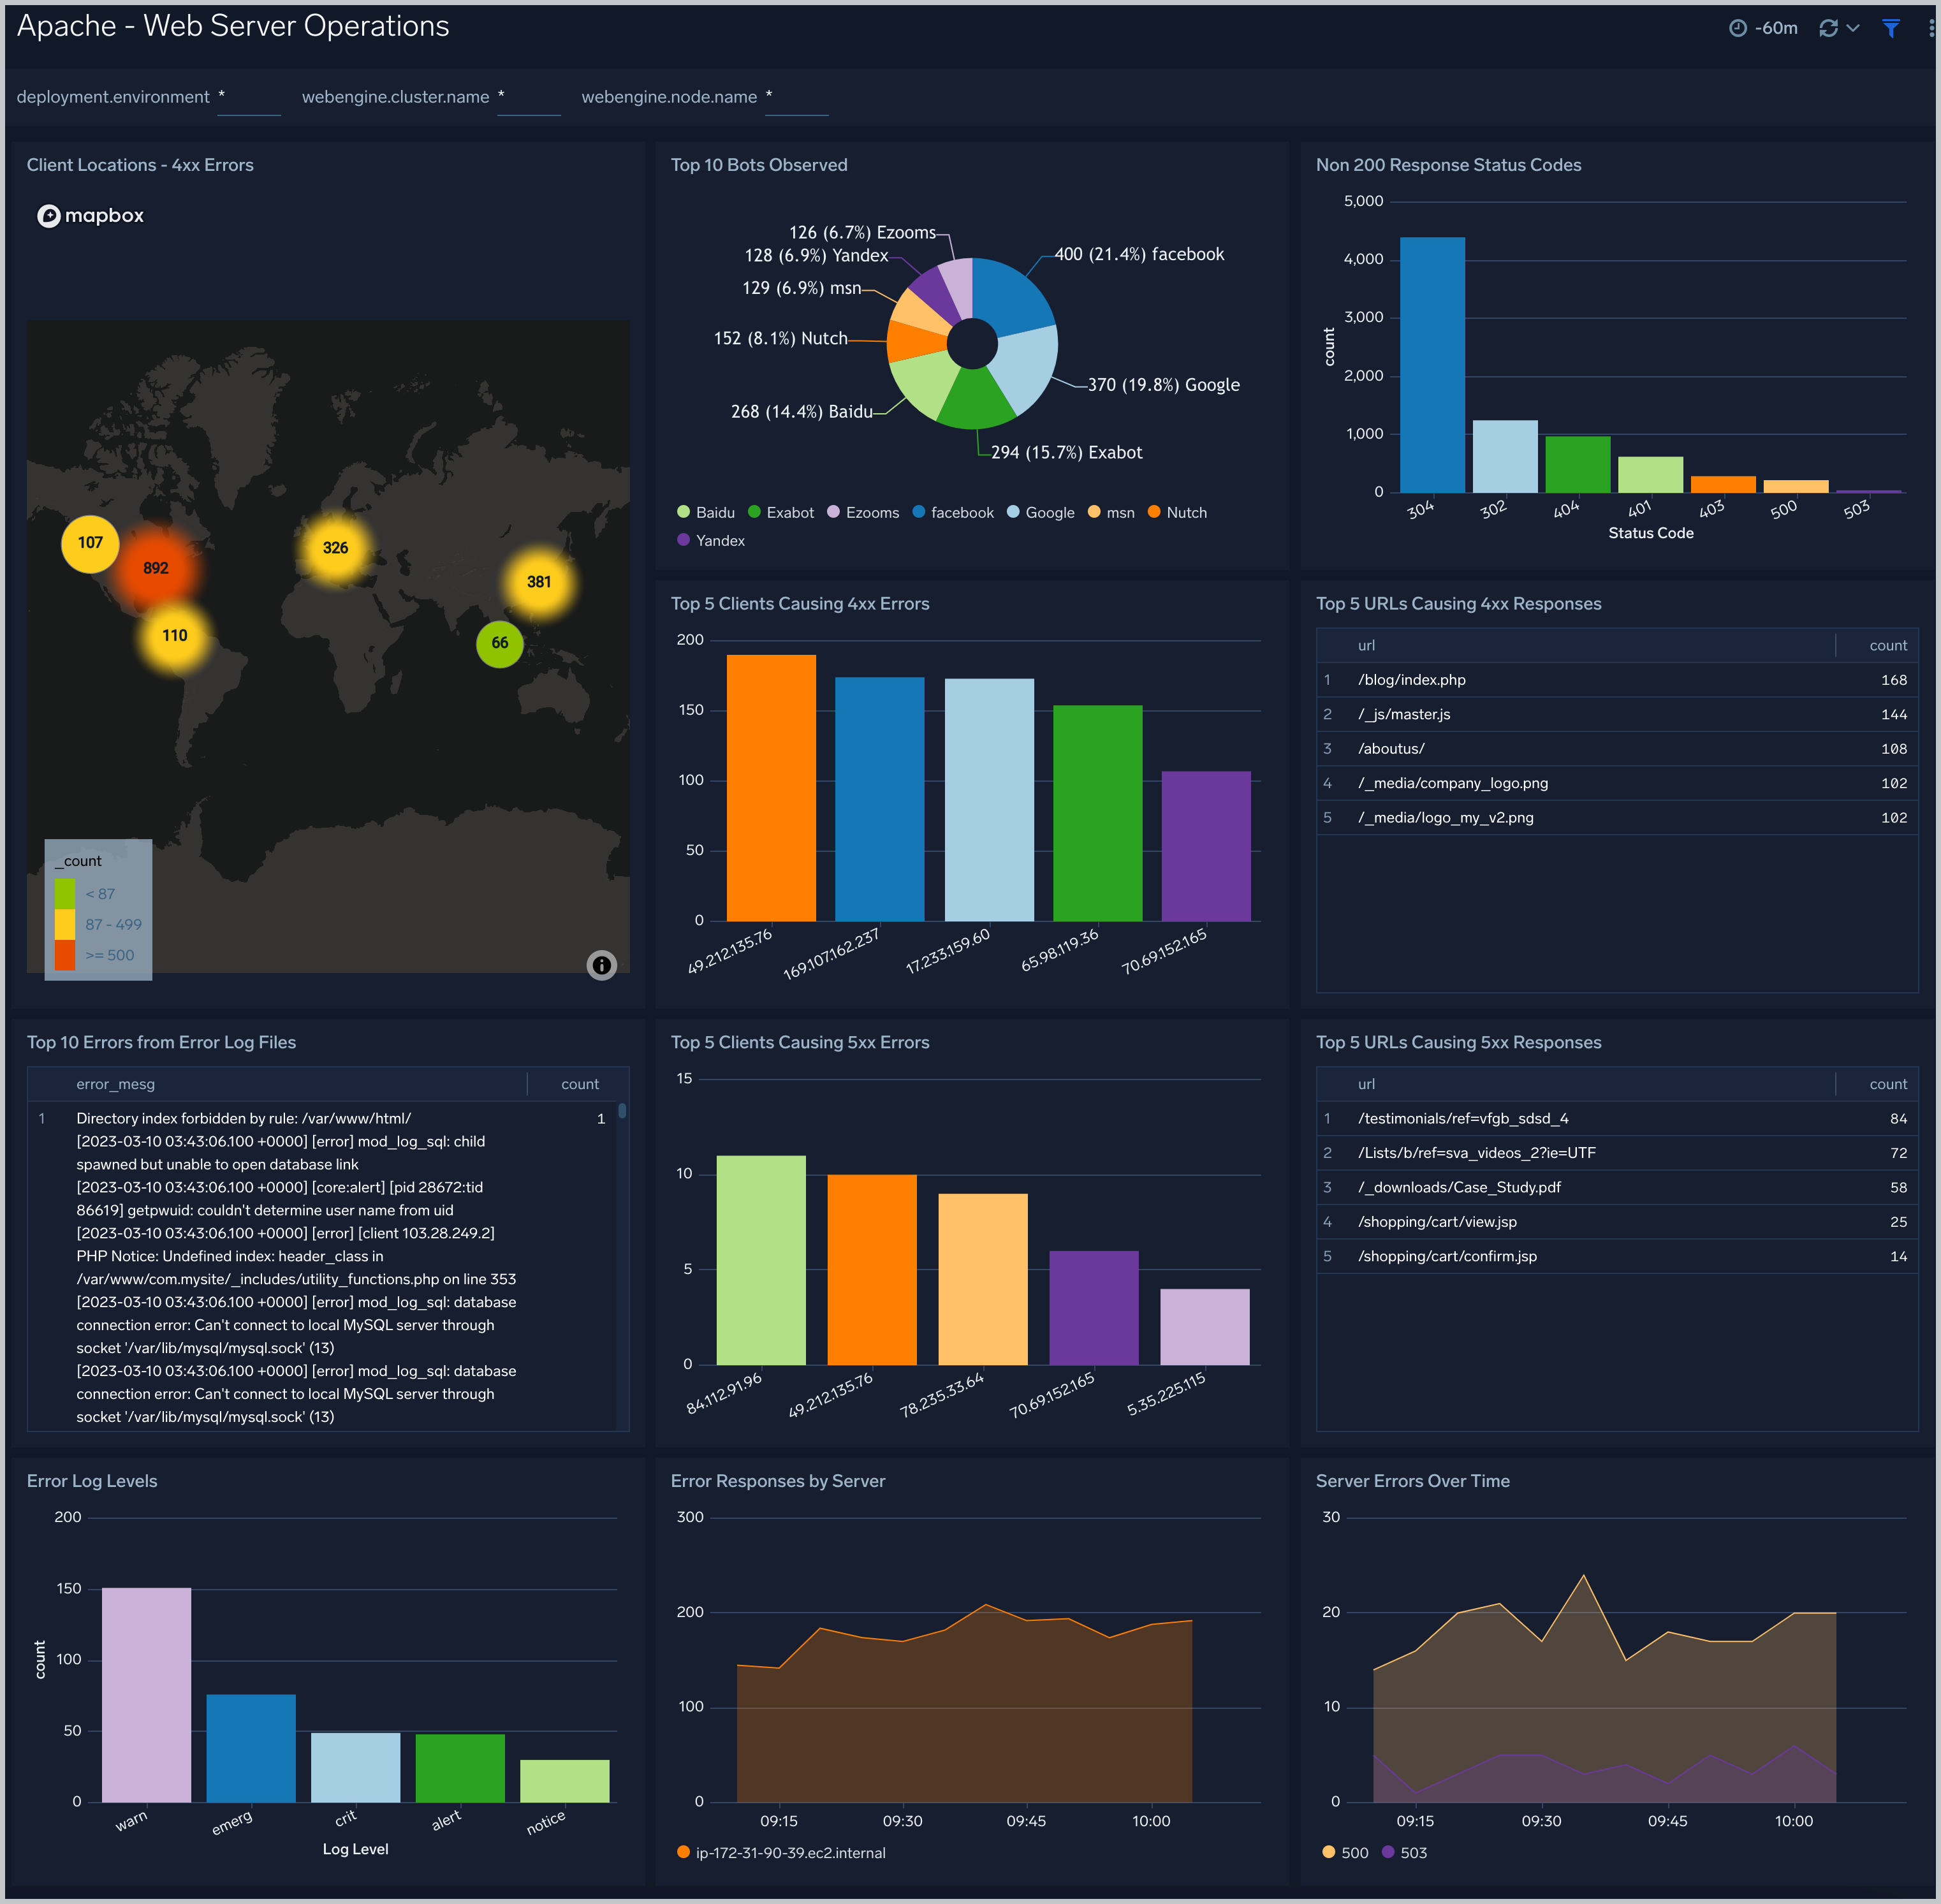
 ### Web Server Operations
The **Apache - Web Server Operations** dashboard provides an at-a-glance view of the operations of your Apache web servers. Dashboard panels show information on bots, geographic locations, errors, and URLs. Use this dashboard to get insights into client locations, bots, and response codes.
### Web Server Operations
The **Apache - Web Server Operations** dashboard provides an at-a-glance view of the operations of your Apache web servers. Dashboard panels show information on bots, geographic locations, errors, and URLs. Use this dashboard to get insights into client locations, bots, and response codes.
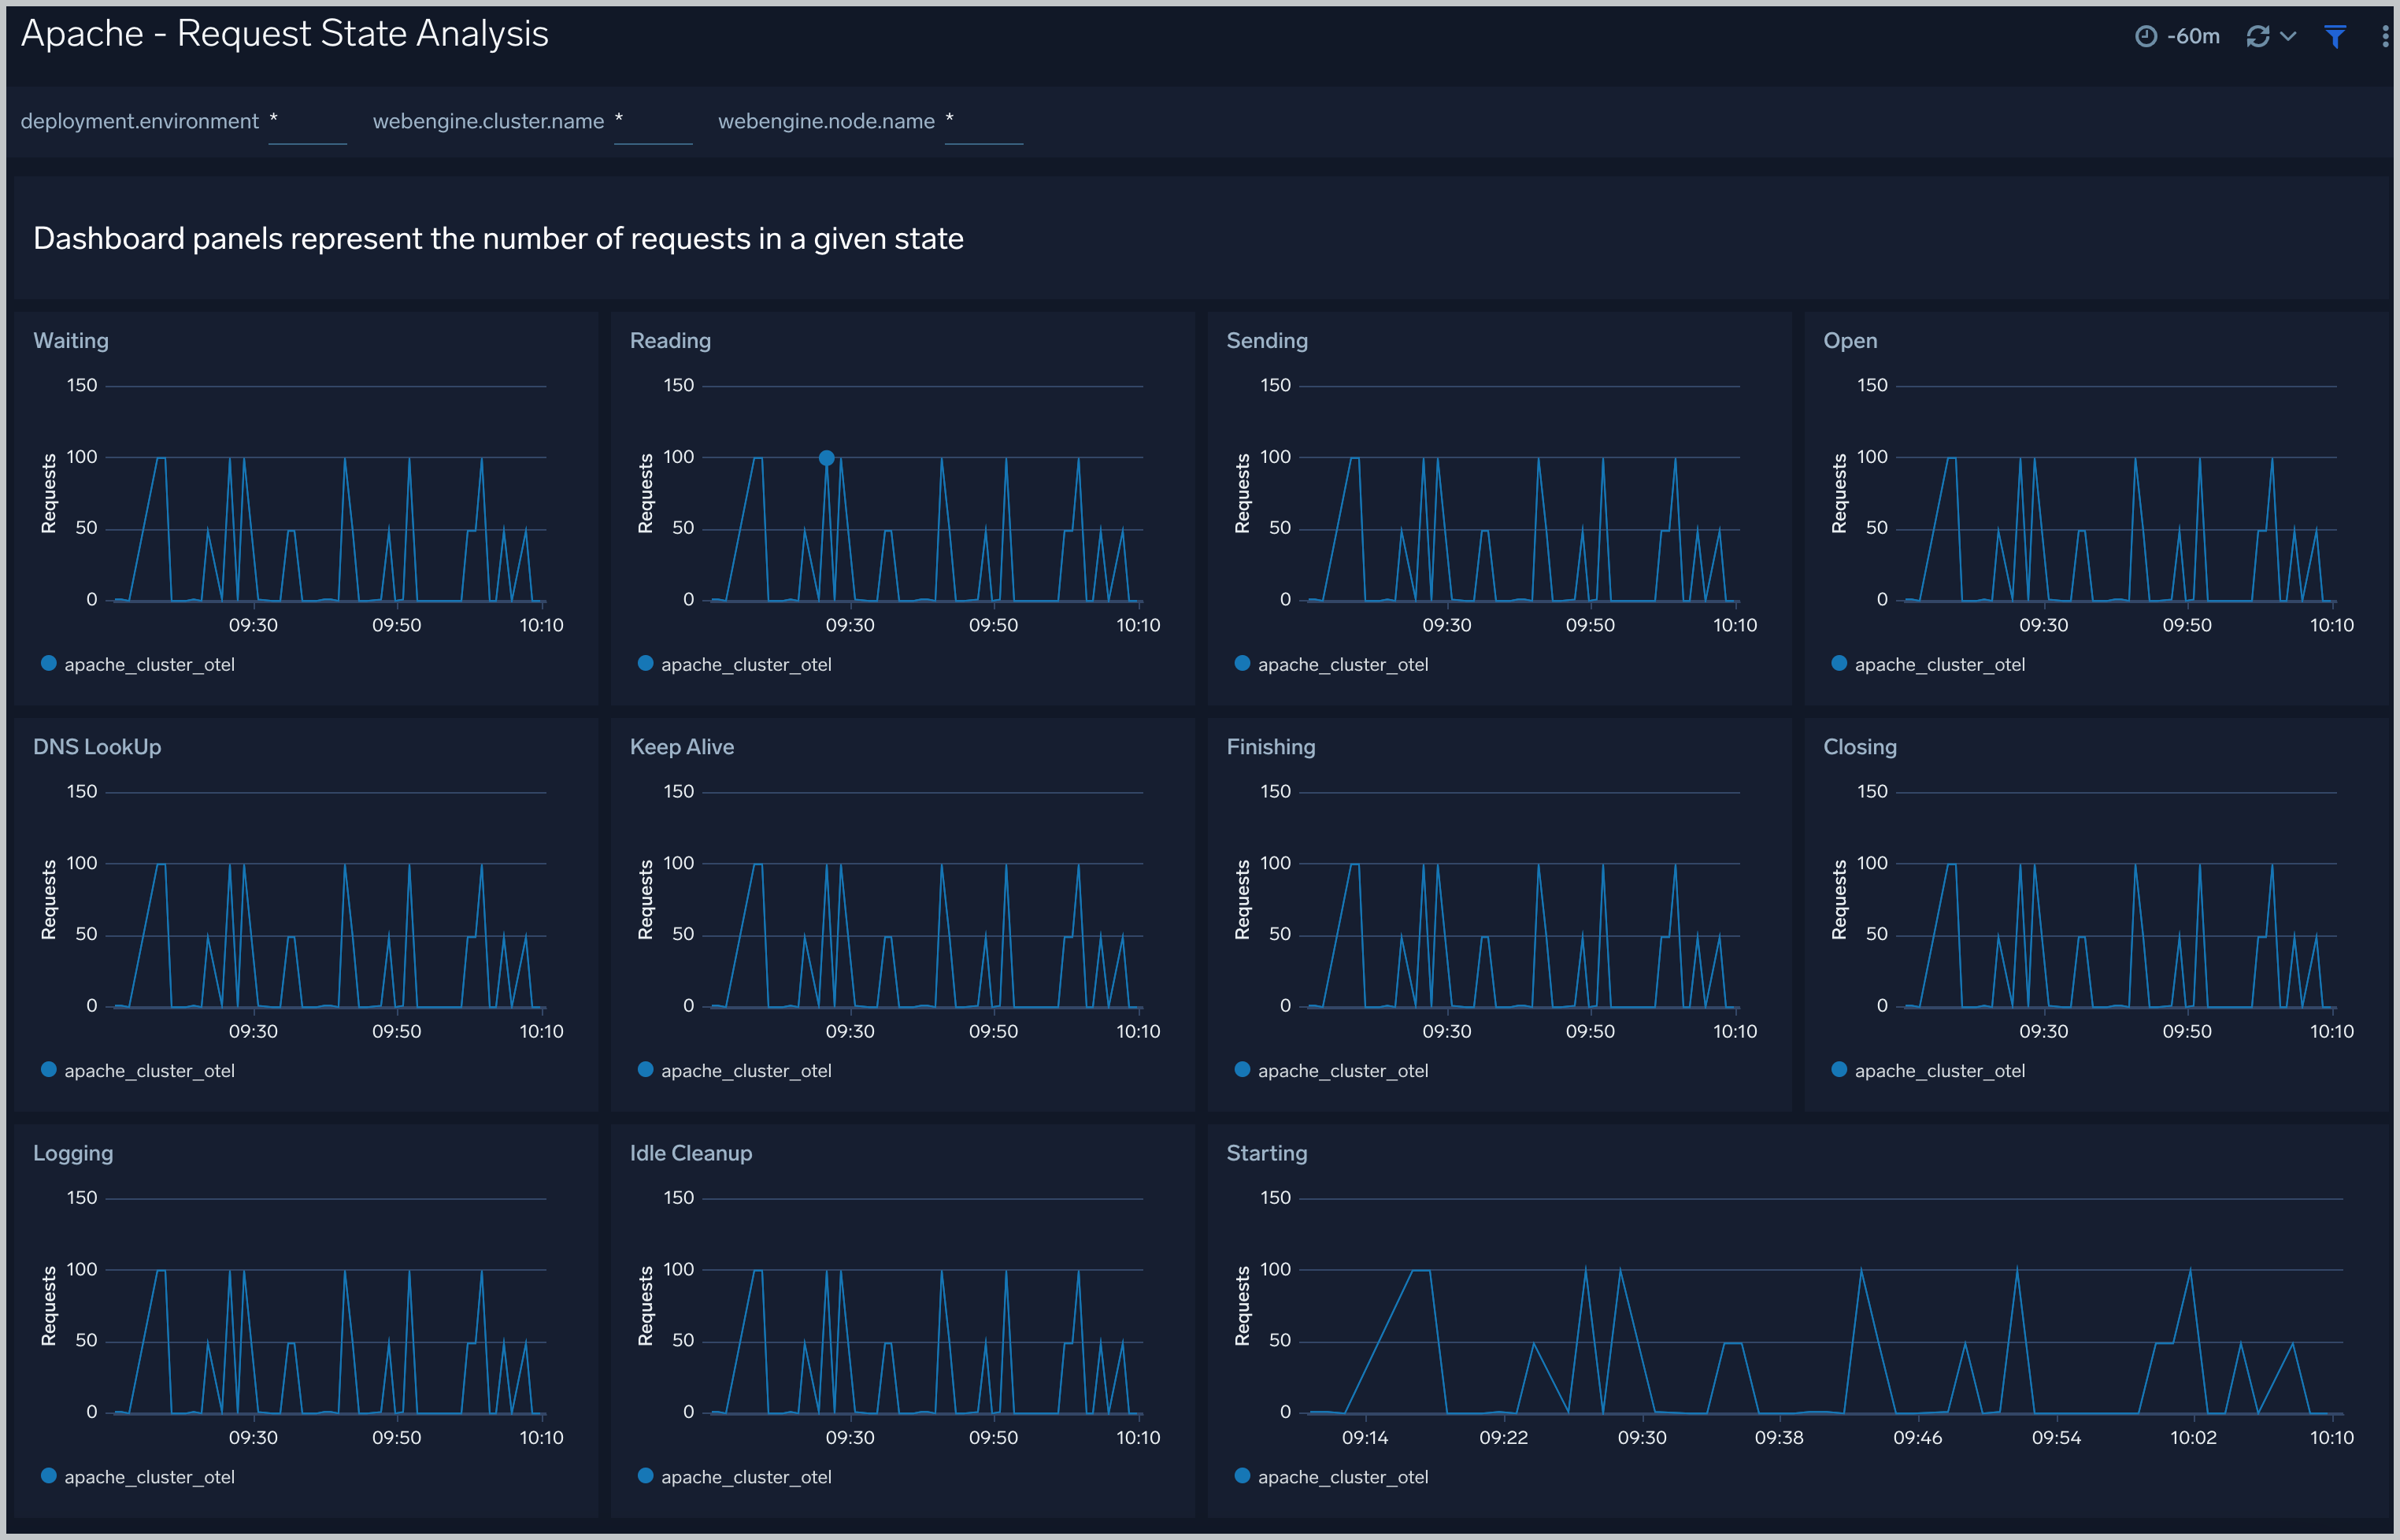
 ### Request State Analysis
The **Apache - Request State Analysis** dashboard shows trends around the state of incoming requests to your Apache web servers. Use this dashboard to monitor the state of requests being handled by worker threads over time and take remedial actions to optimize your web servers if needed.
### Request State Analysis
The **Apache - Request State Analysis** dashboard shows trends around the state of incoming requests to your Apache web servers. Use this dashboard to monitor the state of requests being handled by worker threads over time and take remedial actions to optimize your web servers if needed.
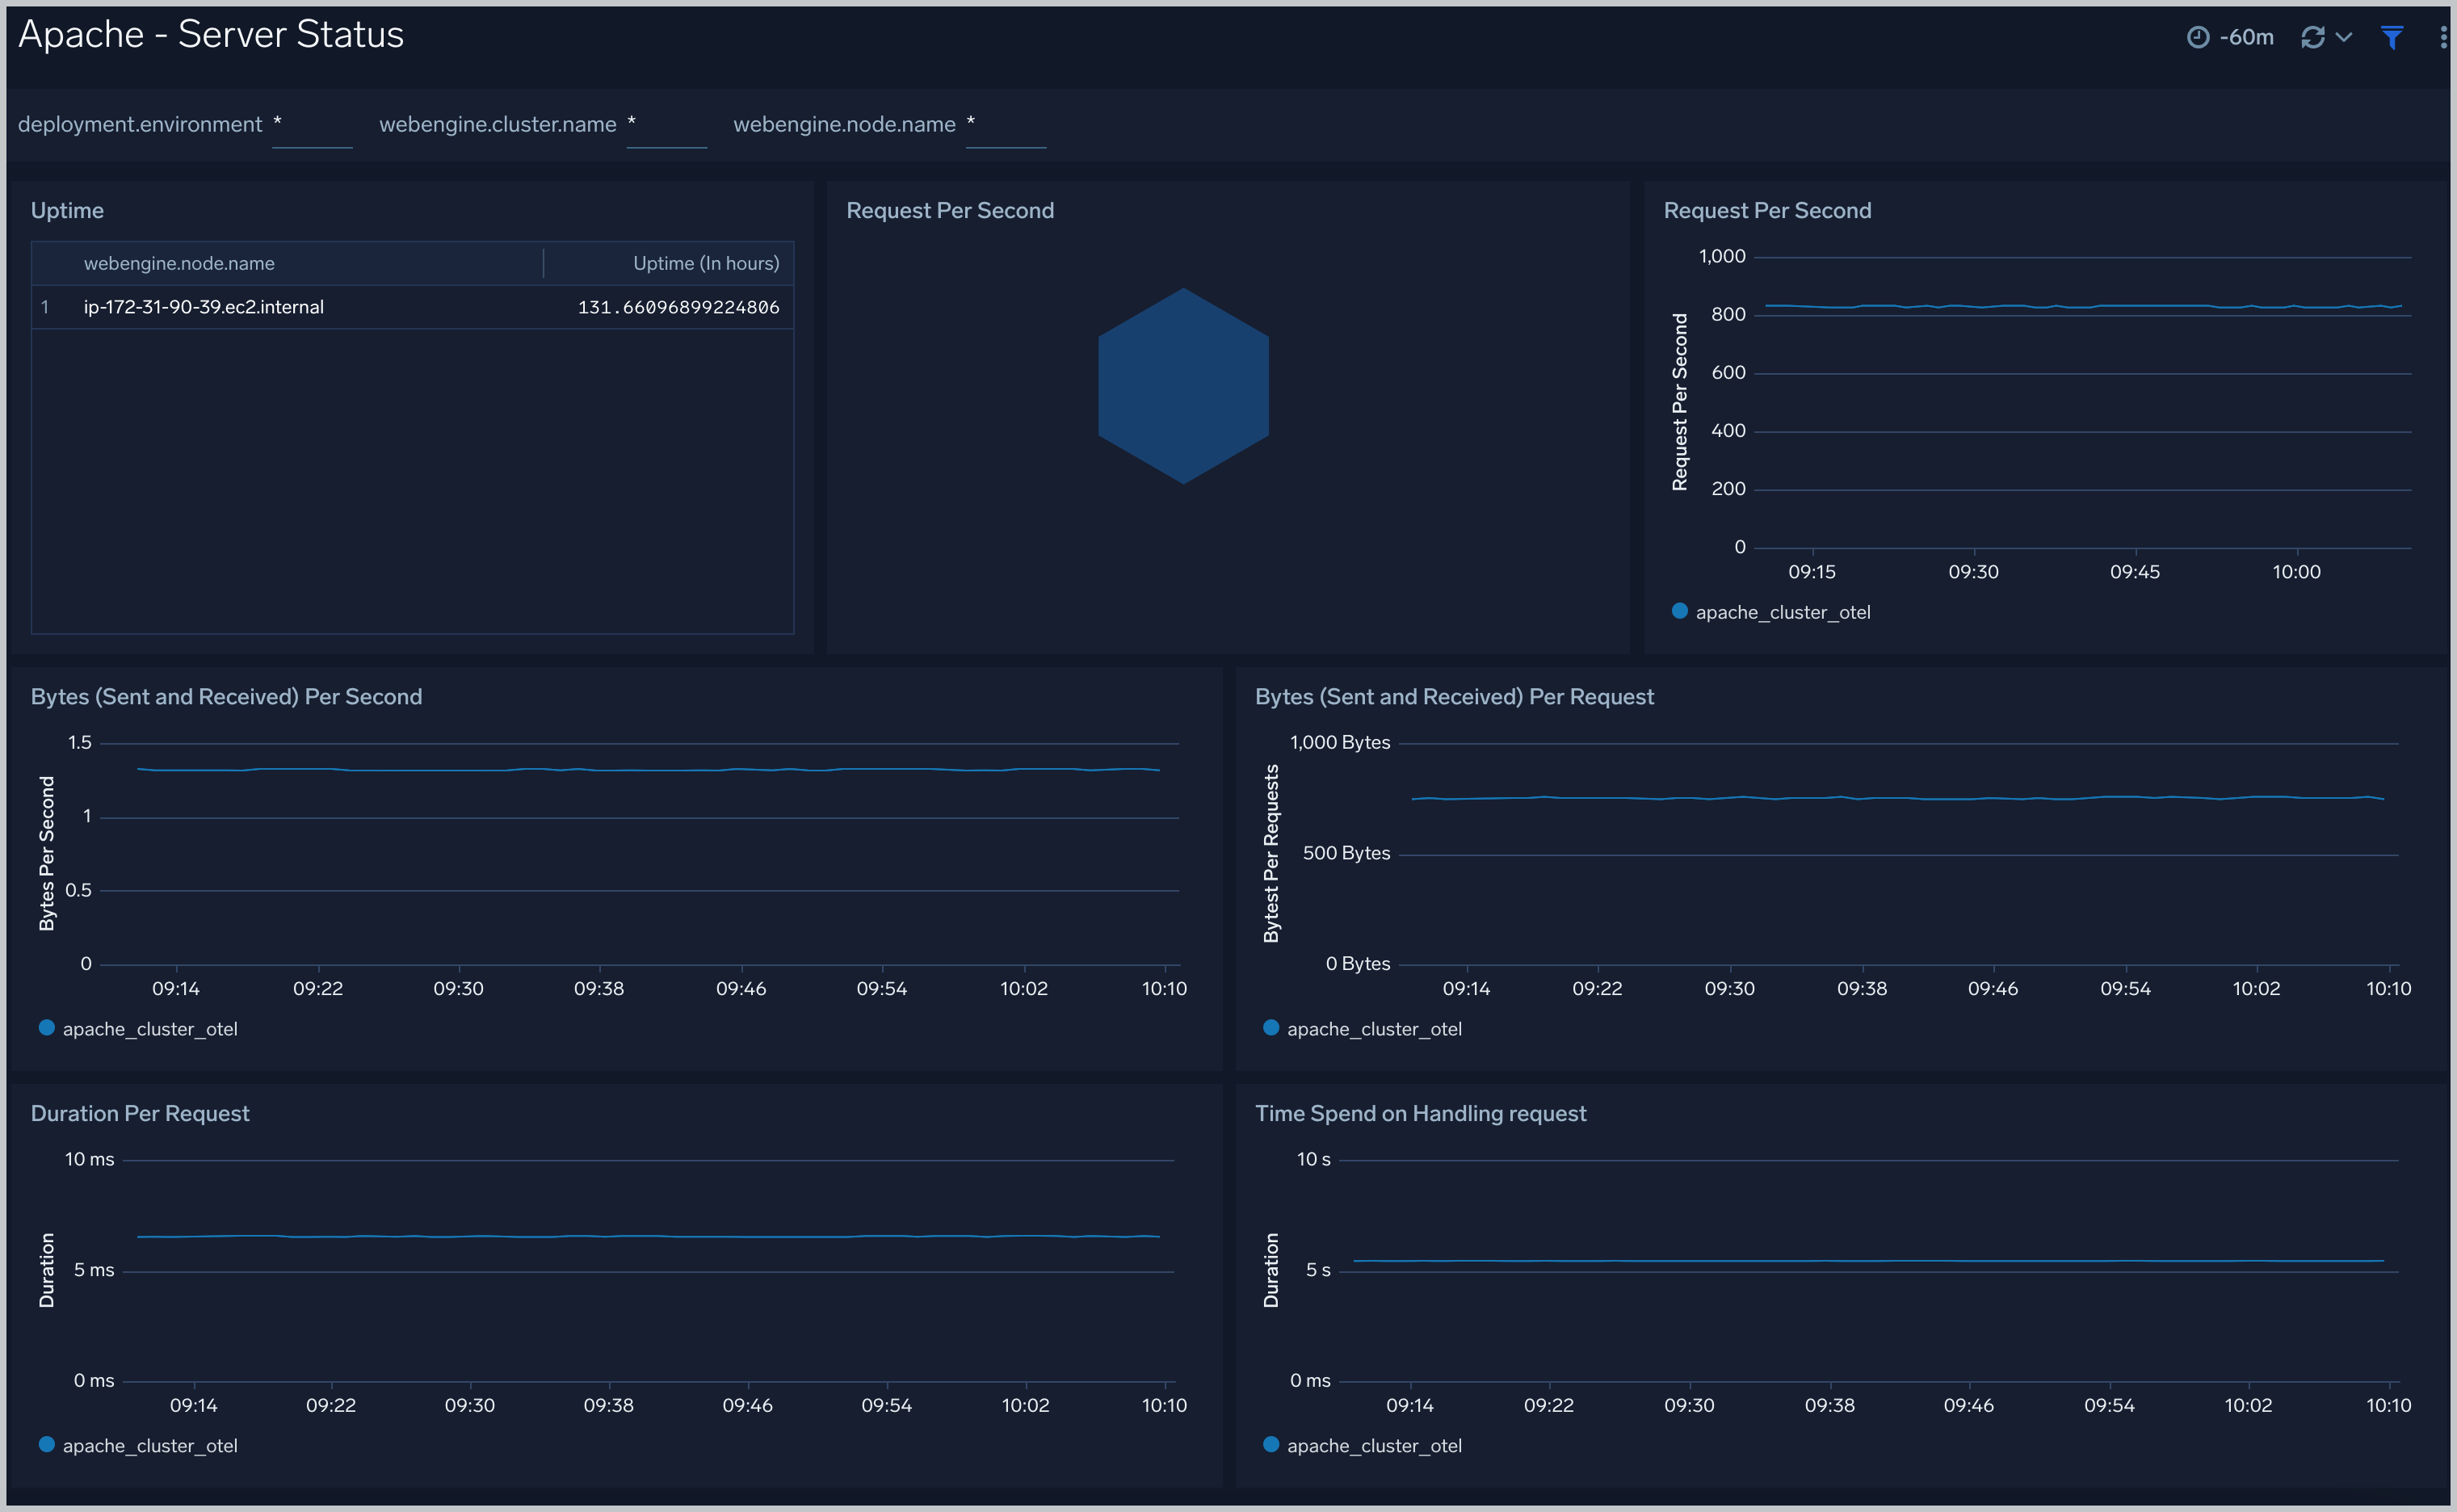
 ### Server Status
The **Apache - Server Status** dashboard shows information related to the state of your Apache server and includes information such as requests and bytes served and latency. information on the number of requests served, time taken to serve the request, and bytes served.
Use this dashboard to:
- Monitor server uptime.
- Monitor web server performance.
### Server Status
The **Apache - Server Status** dashboard shows information related to the state of your Apache server and includes information such as requests and bytes served and latency. information on the number of requests served, time taken to serve the request, and bytes served.
Use this dashboard to:
- Monitor server uptime.
- Monitor web server performance.
 ## Create monitors for Apache app
import CreateMonitors from '../../../reuse/apps/create-monitors.md';
### Apache alerts
| Alert Name | Alert Description and conditions | Alert Condition | Recover Condition |
|:--|:--|:--|:--|
| `Apache - Access from Highly Malicious Sources Alert` | This alert gets triggered when an Apache server is accessed from highly malicious IP addresses. | Count >= 1 | Count < 1 |
| `Apache - Critical Error Messages Alert` | This alert gets triggered when we detect critical error messages for a given Apache server. | Count >= 1 | Count < 1 |
| `Apache - High Client (HTTP 4xx) Error Rate Alert` | This alert gets triggered when there are too many HTTP requests (>5%) with a response status of 4xx. | Count >= 1 | Count < 1 |
| `Apache - High CPU Utilization Alert` | This alert gets triggered when cpu utilization exceeds threshold. | Count >= 85 | Count < 85 |
| `Apache - High Server (HTTP 5xx) Error Rate Alert` | This alert gets triggered when there are too many HTTP requests (>5%) with a response status of 5xx. | Count >= 1 | Count < 1 |
| `Apache - Server Restarted Alert` | This alert gets triggered when an Apache server has restarted by detecting if the uptime metric is less than 600 seconds. | Count < = 600 | Count > 600 |
## Create monitors for Apache app
import CreateMonitors from '../../../reuse/apps/create-monitors.md';
### Apache alerts
| Alert Name | Alert Description and conditions | Alert Condition | Recover Condition |
|:--|:--|:--|:--|
| `Apache - Access from Highly Malicious Sources Alert` | This alert gets triggered when an Apache server is accessed from highly malicious IP addresses. | Count >= 1 | Count < 1 |
| `Apache - Critical Error Messages Alert` | This alert gets triggered when we detect critical error messages for a given Apache server. | Count >= 1 | Count < 1 |
| `Apache - High Client (HTTP 4xx) Error Rate Alert` | This alert gets triggered when there are too many HTTP requests (>5%) with a response status of 4xx. | Count >= 1 | Count < 1 |
| `Apache - High CPU Utilization Alert` | This alert gets triggered when cpu utilization exceeds threshold. | Count >= 85 | Count < 85 |
| `Apache - High Server (HTTP 5xx) Error Rate Alert` | This alert gets triggered when there are too many HTTP requests (>5%) with a response status of 5xx. | Count >= 1 | Count < 1 |
| `Apache - Server Restarted Alert` | This alert gets triggered when an Apache server has restarted by detecting if the uptime metric is less than 600 seconds. | Count < = 600 | Count > 600 |