---
id: apache-tomcat-opentelemetry
title: Apache Tomcat - OpenTelemetry Collector
sidebar_label: Apache Tomcat - OTel Collector
description: Learn about the Sumo Logic OpenTelemetry app for Apache Tomcat.
slug: /help/docs/integrations/web-servers/opentelemetry/apache-tomcat-opentelemetry/
canonical: https://www.sumologic.com/help/docs/integrations/web-servers/opentelemetry/apache-tomcat-opentelemetry/
---
import useBaseUrl from '@docusaurus/useBaseUrl';
import Tabs from '@theme/Tabs';
import TabItem from '@theme/TabItem';
})
}) The [Apache Tomcat](https://tomcat.apache.org/tomcat-8.5-doc/index.html) app is a unified logs and metrics app that helps you monitor the availability, performance, health, and resource utilization of your Apache Tomcat servers. Preconfigured dashboards provide insight into visitor locations, traffic patterns, errors, resource utilization, garbage collection, web server operations, and access from known malicious sources.
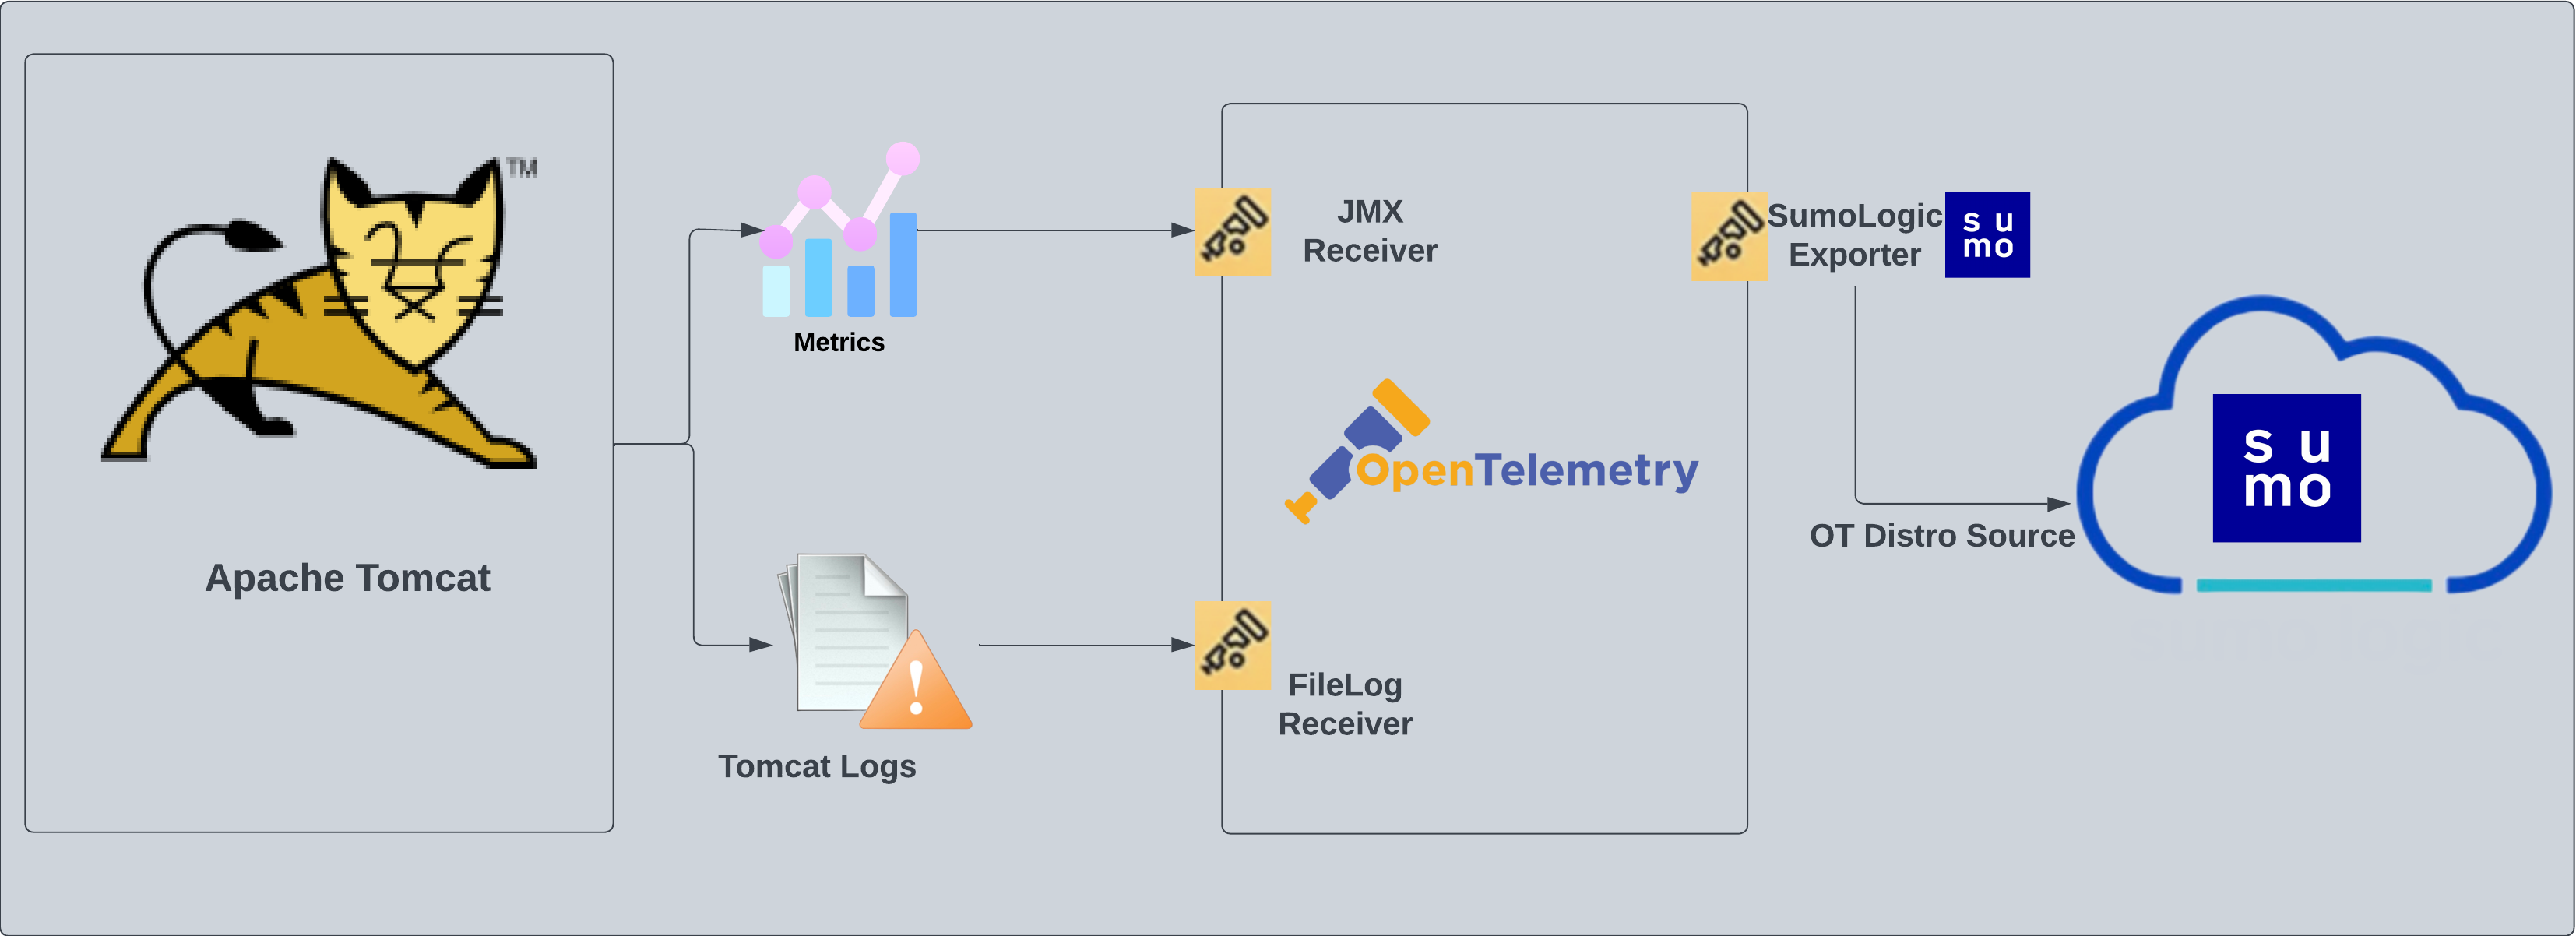
Tomcat logs are sent to Sumo Logic through the OpenTelemetry [filelog receiver](https://github.com/open-telemetry/opentelemetry-collector-contrib/tree/main/receiver/filelogreceiver) and metrics are sent through the [JMX](https://github.com/open-telemetry/opentelemetry-collector-contrib/tree/main/receiver/jmxreceiver) receiver with the `target_system` set as [`tomcat`](https://github.com/open-telemetry/opentelemetry-java-contrib/blob/main/jmx-metrics/docs/target-systems/tomcat.md).
The [Apache Tomcat](https://tomcat.apache.org/tomcat-8.5-doc/index.html) app is a unified logs and metrics app that helps you monitor the availability, performance, health, and resource utilization of your Apache Tomcat servers. Preconfigured dashboards provide insight into visitor locations, traffic patterns, errors, resource utilization, garbage collection, web server operations, and access from known malicious sources.
Tomcat logs are sent to Sumo Logic through the OpenTelemetry [filelog receiver](https://github.com/open-telemetry/opentelemetry-collector-contrib/tree/main/receiver/filelogreceiver) and metrics are sent through the [JMX](https://github.com/open-telemetry/opentelemetry-collector-contrib/tree/main/receiver/jmxreceiver) receiver with the `target_system` set as [`tomcat`](https://github.com/open-telemetry/opentelemetry-java-contrib/blob/main/jmx-metrics/docs/target-systems/tomcat.md).
 :::info
This app includes [built-in monitors](#apache-tomcat-alerts). For details on creating custom monitors, refer to [Create monitors for Apache Tomcat app](#create-monitors-for-apache-tomcat-app).
:::
## Fields Created in Sumo Logic for Tomcat
The following are the [Fields](/docs/manage/fields) that will be created as part of the Tomcat App install, if not already present.
- `sumo.datasource`. Has a fixed value of `tomcat`.
- `deployment.environment`. User configured. This is the deployment environment where the Tomcat cluster resides. For example: `dev`, `prod` or `qa`.
- `webengine.cluster.name`. User configured. Set a value of the cluster where your Tomcat instance resides. This will be tagged along with the data sent to Sumo Logic.
- `webengine.system`. Has a fixed value of `tomcat`.
- `webengine.node.name`. Holds the value of the Fully Qualified Domain Name (FQDN) of the machine from which the OpenTelemetry collector is collecting logs and metrics.
### Prerequisites
#### For metric collection
JMX receiver collects Tomcat metrics from Tomcat server as part of the OpenTelemetry Collector (OTC).
1. Follow the instructions in [JMX - OpenTelemetry's prerequisites section](/docs/integrations/app-development/opentelemetry/jmx-opentelemetry/#prerequisites) to download the [JMX Metric Gatherer](https://github.com/open-telemetry/opentelemetry-java-contrib/blob/main/jmx-metrics/README.md). This gatherer is used by the [JMX Receiver](https://github.com/open-telemetry/opentelemetry-collector-contrib/tree/main/receiver/jmxreceiver#details).
2. Set the JMX port by setting it as part of `JAVA_OPTS` for Tomcat startup. Usually it is set in the `/etc/systemd/system/tomcat.service` or `C:\Program Files\apache-tomcat\bin\tomcat.bat` file.
```json
JAVA_OPTS="$JAVA_OPTS -Dcom.sun.management.jmxremote -Dcom.sun.management.jmxremote.port=11099 -Dcom.sun.management.jmxremote.authenticate=true -Dcom.sun.management.jmxremote.ssl=false -Dcom.sun.management.jmxremote.password.file=${TOMCAT_CONF_DIR}/jmx.password -Dcom.sun.management.jmxremote.access.file=${TOMCAT_CONF_DIR}/jmx.access"
```
#### For log collection
The Sumo Logic app for Apache Tomcat uses three types of logs:
1. Tomcat Access logs. [Log format description](https://tomcat.apache.org/tomcat-8.0-doc/config/valve.html). Recommended pattern used is pattern="common".
2. Tomcat Catalina.out logs. [Log format description](https://docs.oracle.com/javase/8/docs/api/java/util/logging/SimpleFormatter.html)
3. Tomcat Garbage Collection (GC) logs. [Log format description](https://stackoverflow.com/questions/4468546/explanation-of-tomcat-gc-log-statements)
By default, Tomcat logs are stored in `/usr/share/tomcat/logs/` The default directory for log files is listed in the `/usr/share/tomcat/conf/logging.properties` file.
import LogsCollectionPrereqisites from '../../../reuse/apps/logs-collection-prereqisites.md';
For Windows systems, log files which are collected should be accessible by the SYSTEM group. Use the following set of PowerShell commands if the SYSTEM group does not have access.
```
$NewAcl = Get-Acl -Path ""
# Set properties
$identity = "NT AUTHORITY\SYSTEM"
$fileSystemRights = "ReadAndExecute"
$type = "Allow"
# Create new rule
$fileSystemAccessRuleArgumentList = $identity, $fileSystemRights, $type
$fileSystemAccessRule = New-Object -TypeName System.Security.AccessControl.FileSystemAccessRule -ArgumentList $fileSystemAccessRuleArgumentList
# Apply new rule
$NewAcl.SetAccessRule($fileSystemAccessRule)
Set-Acl -Path "" -AclObject $NewAcl
```
## Collection configuration and app installation
import ConfigAppInstall from '../../../reuse/apps/opentelemetry/config-app-install.md';
### Step 1: Set up Collector
import SetupColl from '../../../reuse/apps/opentelemetry/set-up-collector.md';
:::info
This app includes [built-in monitors](#apache-tomcat-alerts). For details on creating custom monitors, refer to [Create monitors for Apache Tomcat app](#create-monitors-for-apache-tomcat-app).
:::
## Fields Created in Sumo Logic for Tomcat
The following are the [Fields](/docs/manage/fields) that will be created as part of the Tomcat App install, if not already present.
- `sumo.datasource`. Has a fixed value of `tomcat`.
- `deployment.environment`. User configured. This is the deployment environment where the Tomcat cluster resides. For example: `dev`, `prod` or `qa`.
- `webengine.cluster.name`. User configured. Set a value of the cluster where your Tomcat instance resides. This will be tagged along with the data sent to Sumo Logic.
- `webengine.system`. Has a fixed value of `tomcat`.
- `webengine.node.name`. Holds the value of the Fully Qualified Domain Name (FQDN) of the machine from which the OpenTelemetry collector is collecting logs and metrics.
### Prerequisites
#### For metric collection
JMX receiver collects Tomcat metrics from Tomcat server as part of the OpenTelemetry Collector (OTC).
1. Follow the instructions in [JMX - OpenTelemetry's prerequisites section](/docs/integrations/app-development/opentelemetry/jmx-opentelemetry/#prerequisites) to download the [JMX Metric Gatherer](https://github.com/open-telemetry/opentelemetry-java-contrib/blob/main/jmx-metrics/README.md). This gatherer is used by the [JMX Receiver](https://github.com/open-telemetry/opentelemetry-collector-contrib/tree/main/receiver/jmxreceiver#details).
2. Set the JMX port by setting it as part of `JAVA_OPTS` for Tomcat startup. Usually it is set in the `/etc/systemd/system/tomcat.service` or `C:\Program Files\apache-tomcat\bin\tomcat.bat` file.
```json
JAVA_OPTS="$JAVA_OPTS -Dcom.sun.management.jmxremote -Dcom.sun.management.jmxremote.port=11099 -Dcom.sun.management.jmxremote.authenticate=true -Dcom.sun.management.jmxremote.ssl=false -Dcom.sun.management.jmxremote.password.file=${TOMCAT_CONF_DIR}/jmx.password -Dcom.sun.management.jmxremote.access.file=${TOMCAT_CONF_DIR}/jmx.access"
```
#### For log collection
The Sumo Logic app for Apache Tomcat uses three types of logs:
1. Tomcat Access logs. [Log format description](https://tomcat.apache.org/tomcat-8.0-doc/config/valve.html). Recommended pattern used is pattern="common".
2. Tomcat Catalina.out logs. [Log format description](https://docs.oracle.com/javase/8/docs/api/java/util/logging/SimpleFormatter.html)
3. Tomcat Garbage Collection (GC) logs. [Log format description](https://stackoverflow.com/questions/4468546/explanation-of-tomcat-gc-log-statements)
By default, Tomcat logs are stored in `/usr/share/tomcat/logs/` The default directory for log files is listed in the `/usr/share/tomcat/conf/logging.properties` file.
import LogsCollectionPrereqisites from '../../../reuse/apps/logs-collection-prereqisites.md';
For Windows systems, log files which are collected should be accessible by the SYSTEM group. Use the following set of PowerShell commands if the SYSTEM group does not have access.
```
$NewAcl = Get-Acl -Path ""
# Set properties
$identity = "NT AUTHORITY\SYSTEM"
$fileSystemRights = "ReadAndExecute"
$type = "Allow"
# Create new rule
$fileSystemAccessRuleArgumentList = $identity, $fileSystemRights, $type
$fileSystemAccessRule = New-Object -TypeName System.Security.AccessControl.FileSystemAccessRule -ArgumentList $fileSystemAccessRuleArgumentList
# Apply new rule
$NewAcl.SetAccessRule($fileSystemAccessRule)
Set-Acl -Path "" -AclObject $NewAcl
```
## Collection configuration and app installation
import ConfigAppInstall from '../../../reuse/apps/opentelemetry/config-app-install.md';
### Step 1: Set up Collector
import SetupColl from '../../../reuse/apps/opentelemetry/set-up-collector.md';
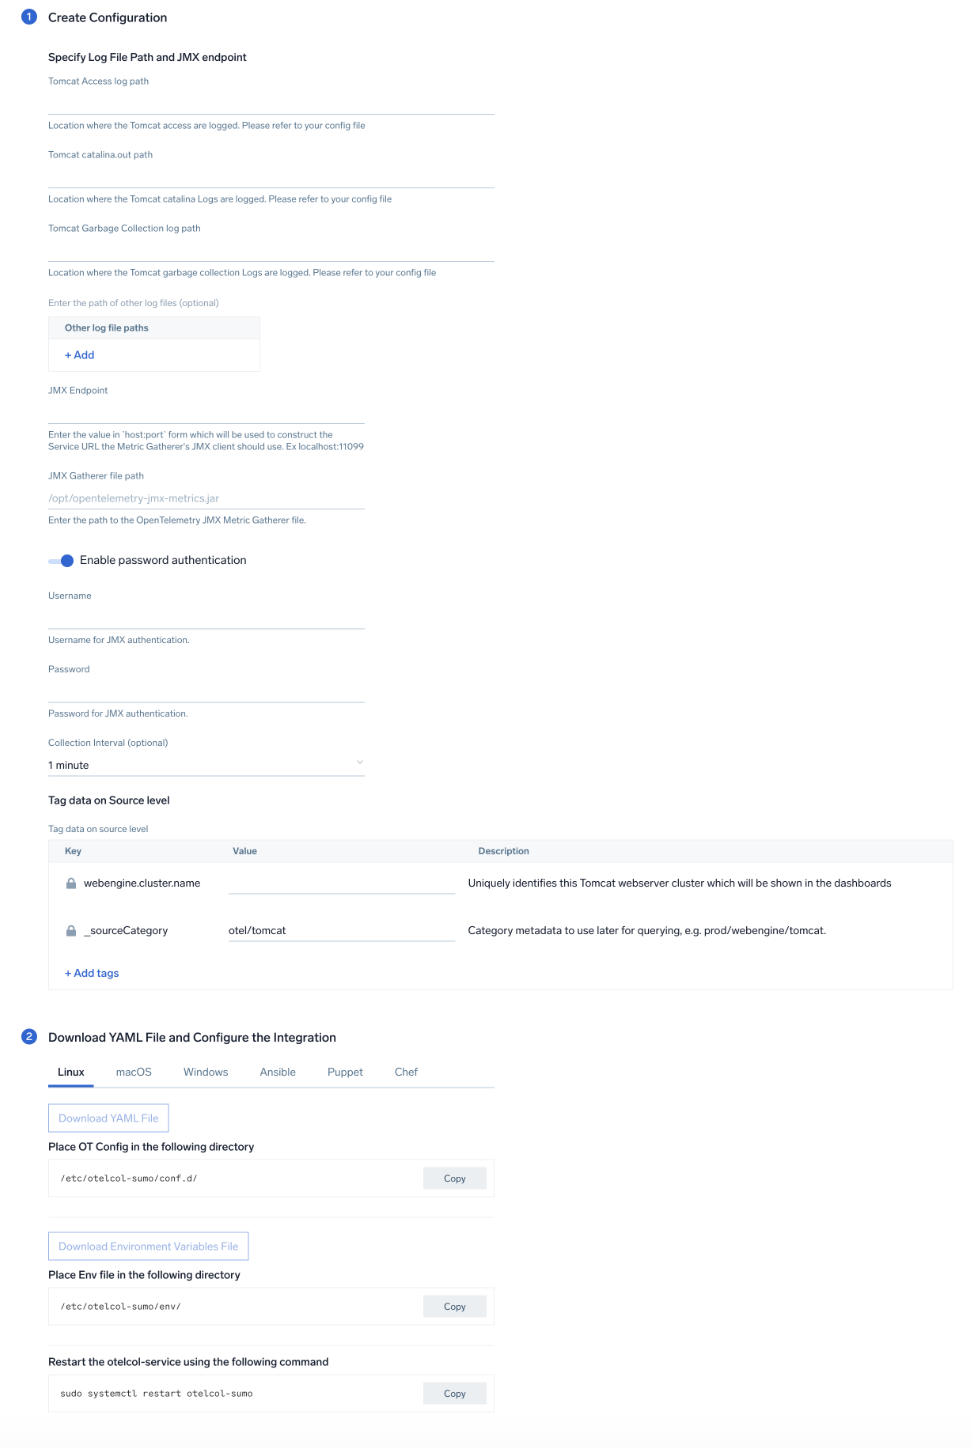
 ### Step 2: Configure integration
In this step, you will configure the YAML required for Tomcat Collection.
The path of the log file configured to capture Tomcat logs is needed to be given here.
The files are typically located in `/usr/share/tomcat/logs/*`. If you're using a customized path, check the Tomcat.conf file for this information.
For metrics, you're required to provide the JMX endpoint (default is `localhost:11099`) along with the `collection_interval` (default is 1 minute).
You can add any custom fields which you want to tag along with the data ingested in Sumo Logic. Click the **Download YAML File** button to get the YAML file.
import CollectorVersionNote from '../../../reuse/apps/opentelemetry/collector-version-note.md';
import EnvVarOpt from '../../../reuse/apps/opentelemetry/env-var-optional.md';
### Step 2: Configure integration
In this step, you will configure the YAML required for Tomcat Collection.
The path of the log file configured to capture Tomcat logs is needed to be given here.
The files are typically located in `/usr/share/tomcat/logs/*`. If you're using a customized path, check the Tomcat.conf file for this information.
For metrics, you're required to provide the JMX endpoint (default is `localhost:11099`) along with the `collection_interval` (default is 1 minute).
You can add any custom fields which you want to tag along with the data ingested in Sumo Logic. Click the **Download YAML File** button to get the YAML file.
import CollectorVersionNote from '../../../reuse/apps/opentelemetry/collector-version-note.md';
import EnvVarOpt from '../../../reuse/apps/opentelemetry/env-var-optional.md';
 ### Step 3: Send logs and metrics to Sumo Logic
import LogsIntro from '../../../reuse/apps/opentelemetry/send-logs-intro.md';
1. Copy the YAML file to `/etc/otelcol-sumo/conf.d/` folder in the Tomcat instance which needs to be monitored.
2. Restart the collector using:
```sh
sudo systemctl restart otelcol-sumo
```
1. Copy the YAML file to `C:\ProgramData\Sumo Logic\OpenTelemetry Collector\config\conf.d` folder in the machine which needs to be monitored.
2. Restart the collector using:
```sh
Restart-Service -Name OtelcolSumo
```
1. Copy the YAML file to `/etc/otelcol-sumo/conf.d/` folder in the Tomcat instance which needs to be monitored.
2. Restart the otelcol-sumo process using the below command:
```sh
otelcol-sumo --config /etc/otelcol-sumo/sumologic.yaml --config "glob:/etc/otelcol-sumo/conf.d/*.yaml"
```
import ChefNoEnv from '../../../reuse/apps/opentelemetry/chef-without-env.md';
import AnsibleNoEnv from '../../../reuse/apps/opentelemetry/ansible-without-env.md';
import PuppetNoEnv from '../../../reuse/apps/opentelemetry/puppet-without-env.md';
import LogsOutro from '../../../reuse/apps/opentelemetry/send-logs-outro.md';
## Sample log messages
```
Dec 13, 2022 03:53:03 PM org.apache.catalina.startup.Catalina start INFO: Server startup in 63394 ms
179.105.33.169 - - [13/Dec/2022:15:53:03 +0000] "PUT /aboutus/ HTTP/1.1" 404 76246453 "http://bing.com/Nutch-1.4" "-"
```
## Sample log queries
```sumo
%"sumo.datasource"=tomcat %"webengine.cluster.name"=*
| json "log" as _rawlog nodrop
| if (isEmpty(_rawlog), _raw, _rawlog) as _raw
| parse regex "(?
### Step 3: Send logs and metrics to Sumo Logic
import LogsIntro from '../../../reuse/apps/opentelemetry/send-logs-intro.md';
1. Copy the YAML file to `/etc/otelcol-sumo/conf.d/` folder in the Tomcat instance which needs to be monitored.
2. Restart the collector using:
```sh
sudo systemctl restart otelcol-sumo
```
1. Copy the YAML file to `C:\ProgramData\Sumo Logic\OpenTelemetry Collector\config\conf.d` folder in the machine which needs to be monitored.
2. Restart the collector using:
```sh
Restart-Service -Name OtelcolSumo
```
1. Copy the YAML file to `/etc/otelcol-sumo/conf.d/` folder in the Tomcat instance which needs to be monitored.
2. Restart the otelcol-sumo process using the below command:
```sh
otelcol-sumo --config /etc/otelcol-sumo/sumologic.yaml --config "glob:/etc/otelcol-sumo/conf.d/*.yaml"
```
import ChefNoEnv from '../../../reuse/apps/opentelemetry/chef-without-env.md';
import AnsibleNoEnv from '../../../reuse/apps/opentelemetry/ansible-without-env.md';
import PuppetNoEnv from '../../../reuse/apps/opentelemetry/puppet-without-env.md';
import LogsOutro from '../../../reuse/apps/opentelemetry/send-logs-outro.md';
## Sample log messages
```
Dec 13, 2022 03:53:03 PM org.apache.catalina.startup.Catalina start INFO: Server startup in 63394 ms
179.105.33.169 - - [13/Dec/2022:15:53:03 +0000] "PUT /aboutus/ HTTP/1.1" 404 76246453 "http://bing.com/Nutch-1.4" "-"
```
## Sample log queries
```sumo
%"sumo.datasource"=tomcat %"webengine.cluster.name"=*
| json "log" as _rawlog nodrop
| if (isEmpty(_rawlog), _raw, _rawlog) as _raw
| parse regex "(?