---
id: haproxy-opentelemetry
title: HAProxy - OpenTelemetry Collector
sidebar_label: HAProxy - OTel Collector
description: Learn about the Sumo Logic OpenTelemetry app for HAProxy.
slug: /help/docs/integrations/web-servers/opentelemetry/haproxy-opentelemetry/
canonical: https://www.sumologic.com/help/docs/integrations/web-servers/opentelemetry/haproxy-opentelemetry/
---
import useBaseUrl from '@docusaurus/useBaseUrl';
import Tabs from '@theme/Tabs';
import TabItem from '@theme/TabItem';
})
}) The [HAProxy](https://docs.haproxy.org/2.6/intro.html) app is a unified logs and metrics app designed to help you monitor the availability, performance, health, and resource utilization of HAProxy server farms. It provides preconfigured dashboards and searches that offer visibility into your environment for real-time and historical analysis: visitor locations, HTTP error codes percentage, backend and frontend server statistics, traffic patterns, errors, server operations, and access from known malicious sources.
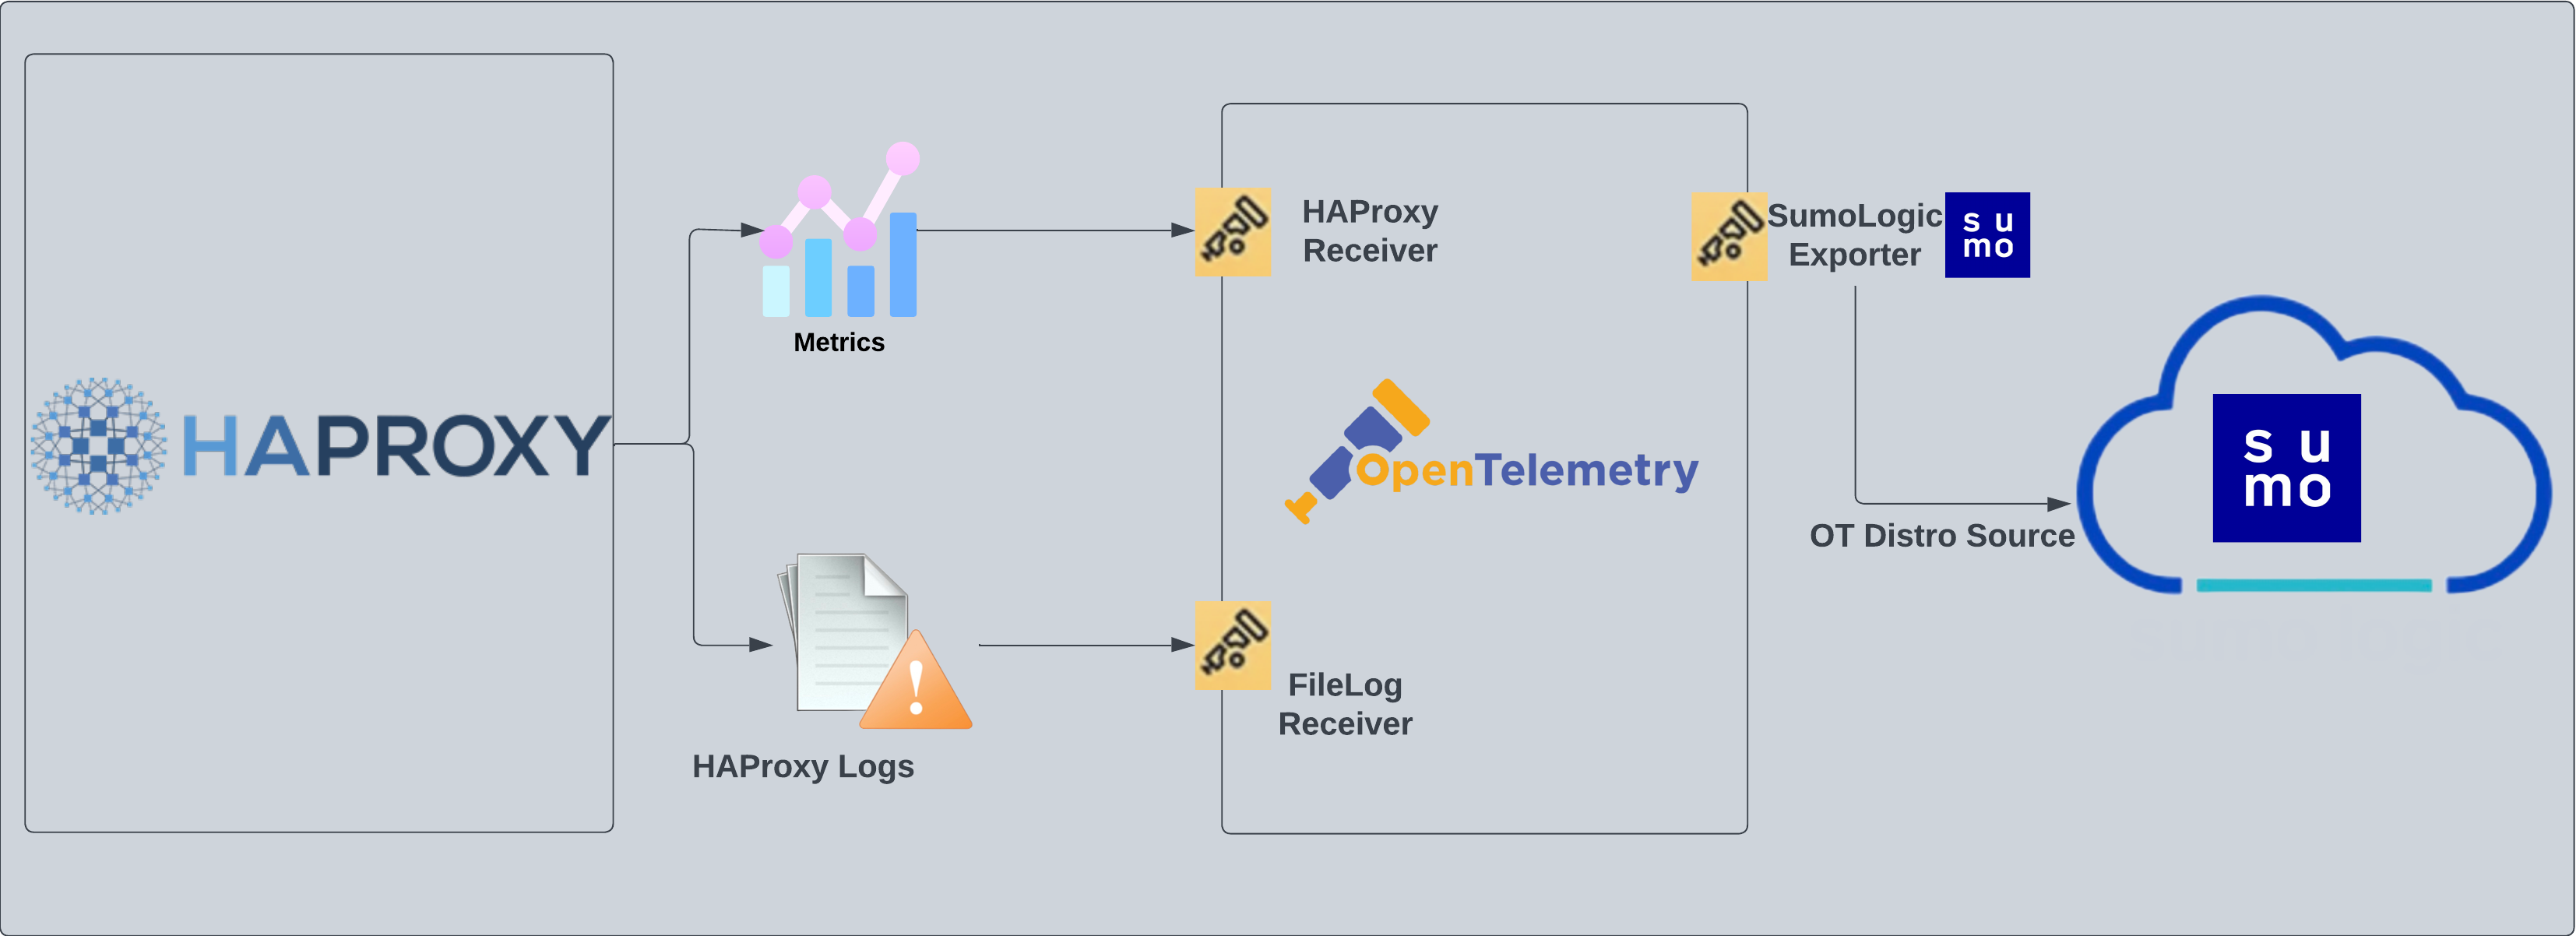
The OpenTelemetry collector runs on the same host as HAProxy, where it uses the [HAProxy Receiver](https://github.com/open-telemetry/opentelemetry-collector-contrib/tree/main/receiver/haproxyreceiver) and the [Sumo Logic OpenTelemetry Exporter](https://github.com/open-telemetry/opentelemetry-collector-contrib/tree/main/exporter/sumologicexporter) to send the metrics to Sumo Logic. HAProxy logs are sent to Sumo Logic through the OpenTelemetry [filelog receiver](https://github.com/open-telemetry/opentelemetry-collector-contrib/tree/main/receiver/filelogreceiver).
The [HAProxy](https://docs.haproxy.org/2.6/intro.html) app is a unified logs and metrics app designed to help you monitor the availability, performance, health, and resource utilization of HAProxy server farms. It provides preconfigured dashboards and searches that offer visibility into your environment for real-time and historical analysis: visitor locations, HTTP error codes percentage, backend and frontend server statistics, traffic patterns, errors, server operations, and access from known malicious sources.
The OpenTelemetry collector runs on the same host as HAProxy, where it uses the [HAProxy Receiver](https://github.com/open-telemetry/opentelemetry-collector-contrib/tree/main/receiver/haproxyreceiver) and the [Sumo Logic OpenTelemetry Exporter](https://github.com/open-telemetry/opentelemetry-collector-contrib/tree/main/exporter/sumologicexporter) to send the metrics to Sumo Logic. HAProxy logs are sent to Sumo Logic through the OpenTelemetry [filelog receiver](https://github.com/open-telemetry/opentelemetry-collector-contrib/tree/main/receiver/filelogreceiver).
 ## HAProxy log types
The app supports logs from the open source version of HAProxy. This app is tested on the `2.3.9` version of HAProxy.
The HAProxy logs are generated in files as configured in the configuration file `/etc/haproxy/haproxy.cfg` ([learn more](https://www.haproxy.com/blog/introduction-to-haproxy-logging/)).
:::info
This app includes [built-in monitors](#haproxy-alerts). For details on creating custom monitors, refer to the [Create monitors for HAProxy app](#create-monitors-for-haproxy-app).
:::
## Fields Create in Sumo Logic for HAProxy
Following are the [Fields](/docs/manage/fields/) which will be created as part of HAProxy App install if not already present.
- **`sumo.datasource`**. Has fixed value of **haproxy**.
- **`webengine.system`**. Has fixed value of **haproxy**.
- **`webengine.cluster.name`**. User configured. Enter a name to identify the HAProxy cluster. This cluster name will be shown in the Sumo Logic dashboards.
- **`webengine.node.name`**. Has the value of host name of the machine which is being monitored.
- **`deployment.environment`**. User configured. This is the deployment environment where the Memcache cluster resides. For example: dev, prod, or qa.
## Prerequisites
### For metrics collection
The receiver used gets stats from an HAProxy instance using the `stats` endpoint. This receiver supports HAProxy version 2.3.9 and later.
**Receive server statistics** by configuring the server's `haproxy.cfg` file to [enable stats support](https://www.haproxy.com/documentation/haproxy-configuration-manual/latest/#4-stats%20enable).
### For logs collection
This section provides instructions for configuring log collection for HAProxy running on a non-Kubernetes environment for the Sumo Logic app for HAProxy.
By default, HAProxy logs are forwarded to Syslog. This needs to be changed to send the logs to files. Configuration in the file `/etc/haproxy/haproxy.cfg` is needed to be modified to send logs to files.
1. HAProxy logs have several levels of verbosity. To select a level, set your loglevel to one of the following:
- **emerg**. Errors such as running out of operating system file descriptors.
- **alert**. Some rare cases where something unexpected has happened, such as being unable to cache a response.
- **info**. TCP connection and http request details and errors.
- **err**. Errors such as being unable to parse a map file, being unable to parse the HAProxy configuration file, and when an operation on a stick table fails.
- **warning**. Certain important, but non-critical, errors such as failing to set a request header or failing to connect to a DNS nameserver.
- **notice**. Changes to a server's state, such as being UP or DOWN or when a server is disabled. Other events at startup, such as starting proxies and loading modules are also included. Health check logging, if enabled, also uses this level.
- **debug**. Complete information, useful for development/testing.
All logging settings are located in [Haproxy.conf](https://www.haproxy.com/blog/introduction-to-haproxy-logging/). For the dashboards to work properly, you'll need to set the log format.
```bash
%ci:%cp\ [%tr]\ %ft\ %b/%s\ %TR/%Tw/%Tc/%Tr/%Ta\ %ST\ %B\ %CC\ %CS\ %tsc\ %ac/%fc/%bc/%sc/%rc\ %sq/%bq\ %hr\ %hs\ %{+Q}r
```
1. You can enable HAProxy logs to syslog by adding the following line in the global section of `/etc/haproxy/haproxy.cfg` file. This means that HAProxy will send its messages to rsyslog on 127.0.0.1.
```bash
global
log 127.0.0.1 local2
```
1. Create an `etc/rsyslog.d/haproxy.conf` file containing below lines.
```bash
local2.* /var/log/haproxy.log
```
* You can, of course, be more specific and create separate log files according to the level of messages:
```bash
local2.=info /var/log/haproxy-info.log
local2.=notice /var/log/haproxy-notice.log
```
1. Restart HAProxy and rsyslog server to enforce configuration changes.
```bash
sudo service rsyslog restart
sudo service haproxy reload
```
import LogsCollectionPrereqisites from '../../../reuse/apps/logs-collection-prereqisites.md';
## Collection configuration and app installation
import ConfigAppInstall from '../../../reuse/apps/opentelemetry/config-app-install.md';
### Step 1: Set up Collector
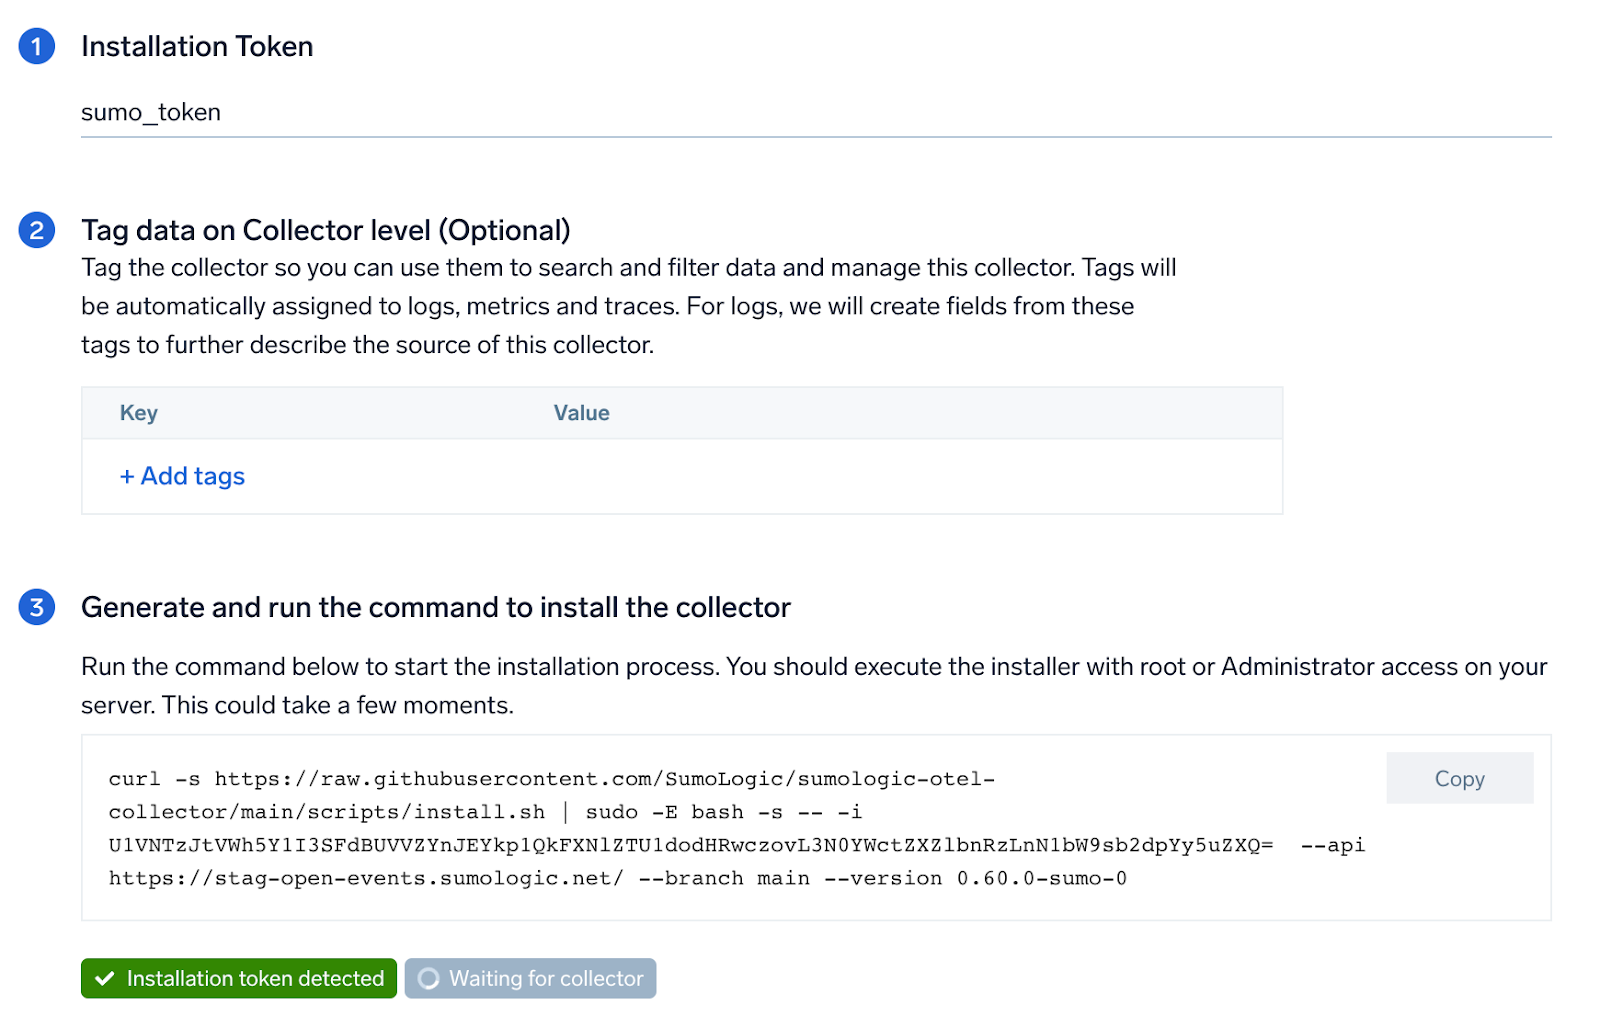
import SetupColl from '../../../reuse/apps/opentelemetry/set-up-collector.md';
## HAProxy log types
The app supports logs from the open source version of HAProxy. This app is tested on the `2.3.9` version of HAProxy.
The HAProxy logs are generated in files as configured in the configuration file `/etc/haproxy/haproxy.cfg` ([learn more](https://www.haproxy.com/blog/introduction-to-haproxy-logging/)).
:::info
This app includes [built-in monitors](#haproxy-alerts). For details on creating custom monitors, refer to the [Create monitors for HAProxy app](#create-monitors-for-haproxy-app).
:::
## Fields Create in Sumo Logic for HAProxy
Following are the [Fields](/docs/manage/fields/) which will be created as part of HAProxy App install if not already present.
- **`sumo.datasource`**. Has fixed value of **haproxy**.
- **`webengine.system`**. Has fixed value of **haproxy**.
- **`webengine.cluster.name`**. User configured. Enter a name to identify the HAProxy cluster. This cluster name will be shown in the Sumo Logic dashboards.
- **`webengine.node.name`**. Has the value of host name of the machine which is being monitored.
- **`deployment.environment`**. User configured. This is the deployment environment where the Memcache cluster resides. For example: dev, prod, or qa.
## Prerequisites
### For metrics collection
The receiver used gets stats from an HAProxy instance using the `stats` endpoint. This receiver supports HAProxy version 2.3.9 and later.
**Receive server statistics** by configuring the server's `haproxy.cfg` file to [enable stats support](https://www.haproxy.com/documentation/haproxy-configuration-manual/latest/#4-stats%20enable).
### For logs collection
This section provides instructions for configuring log collection for HAProxy running on a non-Kubernetes environment for the Sumo Logic app for HAProxy.
By default, HAProxy logs are forwarded to Syslog. This needs to be changed to send the logs to files. Configuration in the file `/etc/haproxy/haproxy.cfg` is needed to be modified to send logs to files.
1. HAProxy logs have several levels of verbosity. To select a level, set your loglevel to one of the following:
- **emerg**. Errors such as running out of operating system file descriptors.
- **alert**. Some rare cases where something unexpected has happened, such as being unable to cache a response.
- **info**. TCP connection and http request details and errors.
- **err**. Errors such as being unable to parse a map file, being unable to parse the HAProxy configuration file, and when an operation on a stick table fails.
- **warning**. Certain important, but non-critical, errors such as failing to set a request header or failing to connect to a DNS nameserver.
- **notice**. Changes to a server's state, such as being UP or DOWN or when a server is disabled. Other events at startup, such as starting proxies and loading modules are also included. Health check logging, if enabled, also uses this level.
- **debug**. Complete information, useful for development/testing.
All logging settings are located in [Haproxy.conf](https://www.haproxy.com/blog/introduction-to-haproxy-logging/). For the dashboards to work properly, you'll need to set the log format.
```bash
%ci:%cp\ [%tr]\ %ft\ %b/%s\ %TR/%Tw/%Tc/%Tr/%Ta\ %ST\ %B\ %CC\ %CS\ %tsc\ %ac/%fc/%bc/%sc/%rc\ %sq/%bq\ %hr\ %hs\ %{+Q}r
```
1. You can enable HAProxy logs to syslog by adding the following line in the global section of `/etc/haproxy/haproxy.cfg` file. This means that HAProxy will send its messages to rsyslog on 127.0.0.1.
```bash
global
log 127.0.0.1 local2
```
1. Create an `etc/rsyslog.d/haproxy.conf` file containing below lines.
```bash
local2.* /var/log/haproxy.log
```
* You can, of course, be more specific and create separate log files according to the level of messages:
```bash
local2.=info /var/log/haproxy-info.log
local2.=notice /var/log/haproxy-notice.log
```
1. Restart HAProxy and rsyslog server to enforce configuration changes.
```bash
sudo service rsyslog restart
sudo service haproxy reload
```
import LogsCollectionPrereqisites from '../../../reuse/apps/logs-collection-prereqisites.md';
## Collection configuration and app installation
import ConfigAppInstall from '../../../reuse/apps/opentelemetry/config-app-install.md';
### Step 1: Set up Collector
import SetupColl from '../../../reuse/apps/opentelemetry/set-up-collector.md';
 ### Step 2: Configure integration
In this step, you will configure the yaml required for HAProxy Collection.
Below are the inputs required:
- **Endpoint**. The URL of the httpd status endpoint (default: `http://localhost:8404/stats`).
- **HAProxy logs Path**. Enter the path to the log file for your HAProxy instance.
The path of the log file configured to capture haproxy logs is needed to be given here. The files are typically located in `/var/log/haproxy*.log`. If you're using a customized path, check the `haproxy.conf` file for this information. You can add any custom fields which you want to tag along with the data ingested in Sumo Logic. Click on the **Download YAML File** button to get the yaml file.
import CollectorVersionNote from '../../../reuse/apps/opentelemetry/collector-version-note.md';
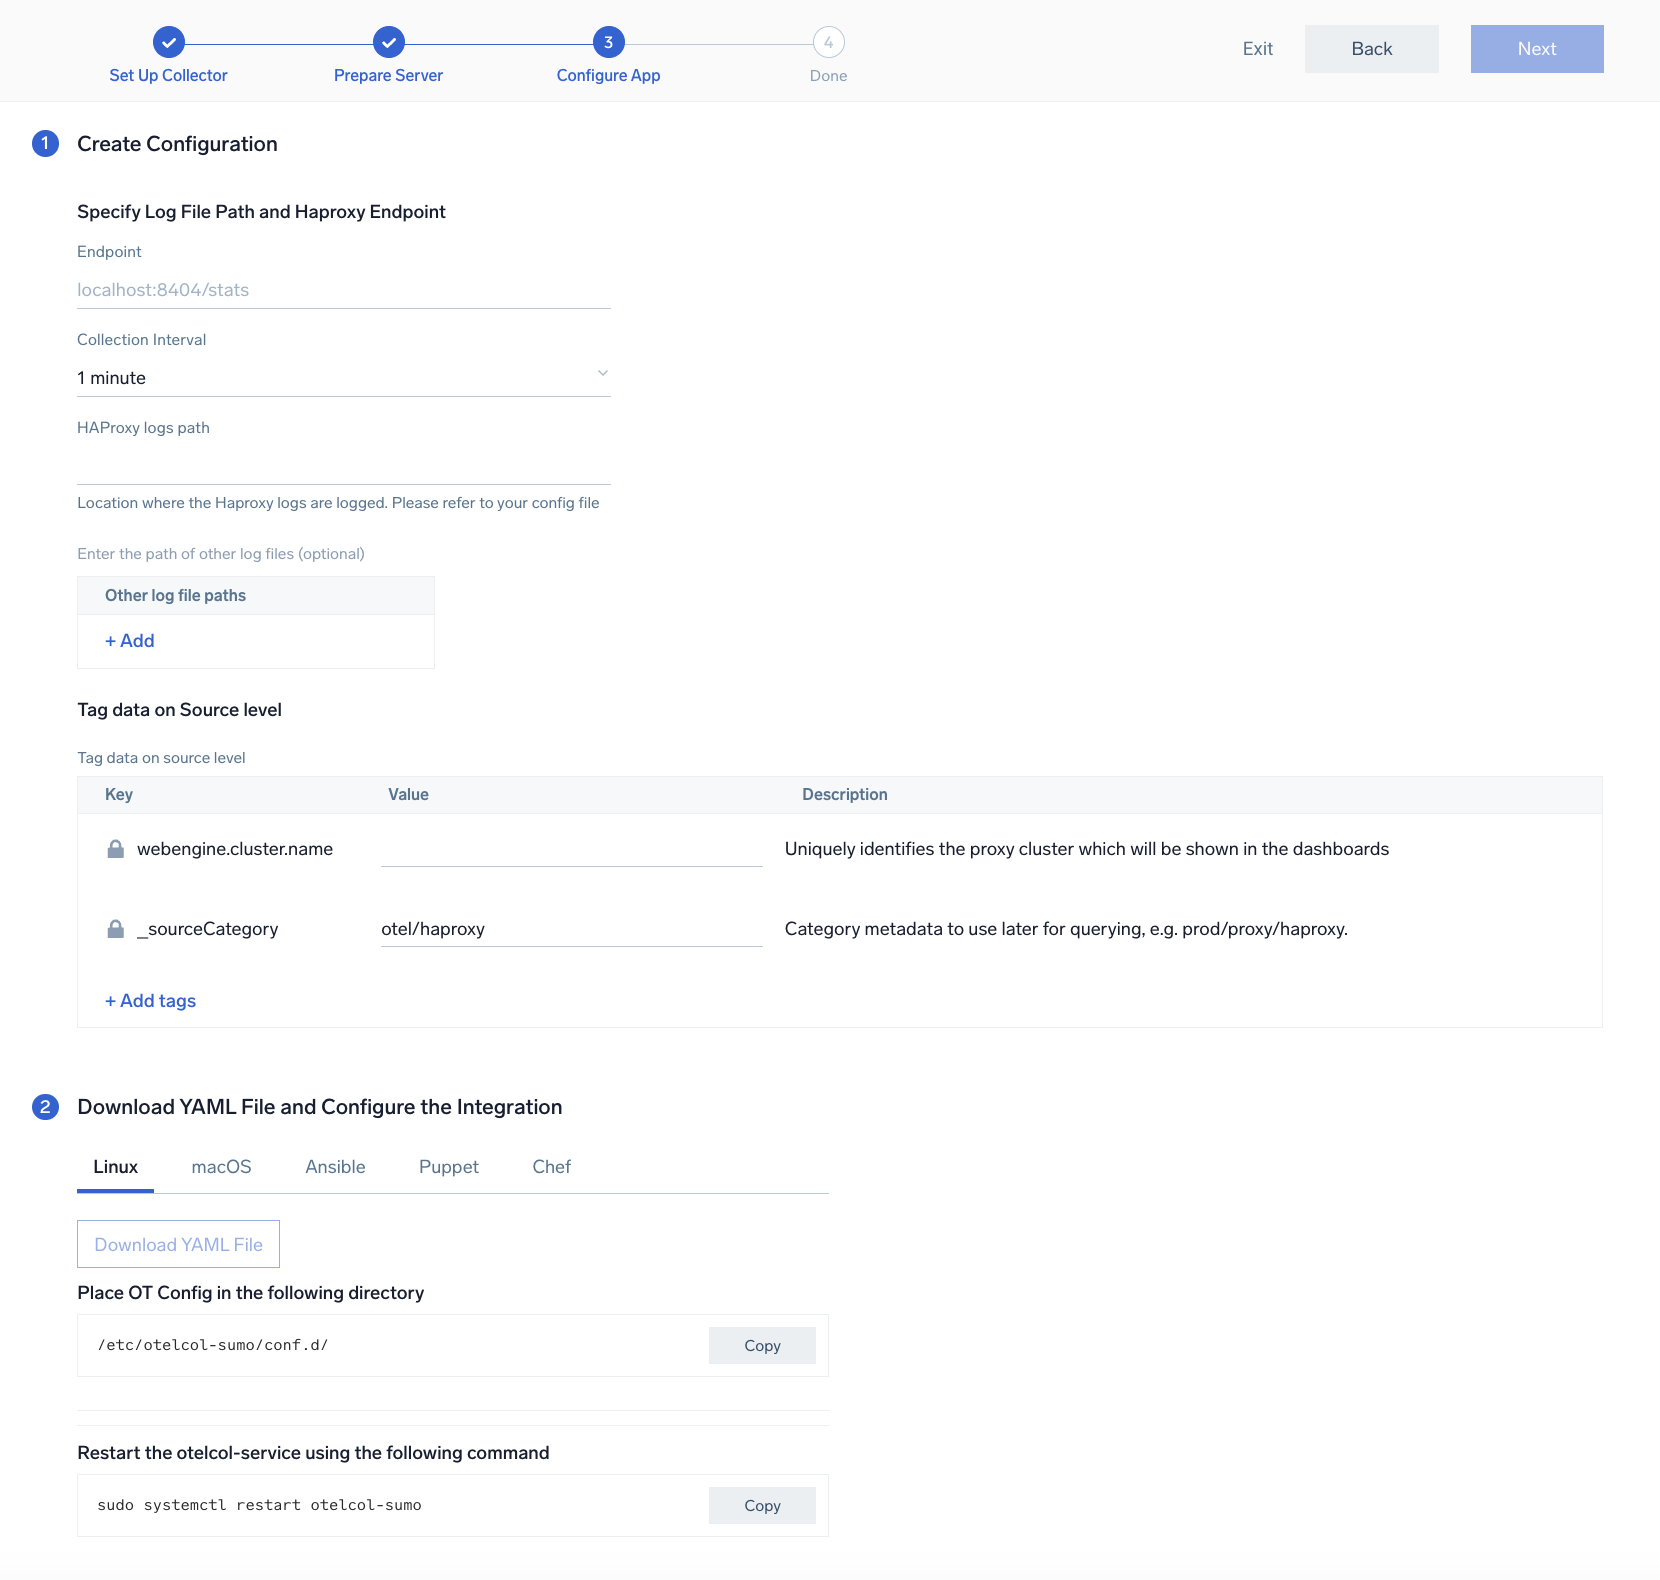
### Step 2: Configure integration
In this step, you will configure the yaml required for HAProxy Collection.
Below are the inputs required:
- **Endpoint**. The URL of the httpd status endpoint (default: `http://localhost:8404/stats`).
- **HAProxy logs Path**. Enter the path to the log file for your HAProxy instance.
The path of the log file configured to capture haproxy logs is needed to be given here. The files are typically located in `/var/log/haproxy*.log`. If you're using a customized path, check the `haproxy.conf` file for this information. You can add any custom fields which you want to tag along with the data ingested in Sumo Logic. Click on the **Download YAML File** button to get the yaml file.
import CollectorVersionNote from '../../../reuse/apps/opentelemetry/collector-version-note.md';
 ### Step 3: Send logs and metrics to Sumo Logic
import LogsIntro from '../../../reuse/apps/opentelemetry/send-logs-intro.md';
1. Copy the yaml file to `/etc/otelcol-sumo/conf.d/` folder in the Haproxy instance which needs to be monitored.
2. Restart the collector using:
```sh
sudo systemctl restart otelcol-sumo
```
1. Copy the yaml file to `/etc/otelcol-sumo/conf.d/` folder in the Haproxy instance which needs to be monitored.
2. Restart the otelcol-sumo process using:
```sh
otelcol-sumo --config /etc/otelcol-sumo/sumologic.yaml --config "glob:/etc/otelcol-sumo/conf.d/*.yaml"
```
import ChefNoEnv from '../../../reuse/apps/opentelemetry/chef-without-env.md';
import AnsibleNoEnv from '../../../reuse/apps/opentelemetry/ansible-without-env.md';
import PuppetNoEnv from '../../../reuse/apps/opentelemetry/puppet-without-env.md';
import LogsOutro from '../../../reuse/apps/opentelemetry/send-logs-outro.md';
## Sample log messages
```bash
May 13 08:24:43 localhost haproxy[21813]:
27.2.81.92:64274 [13/May/2021:08:24:43.921] web-edupia.vn-4
```
## Sample metrics
```json
{
"Query": "A",
"metric": "avg",
"haproxy.proxy_name": "stats",
"webengine.cluster.name": "haproxy_otel_cluster",
"webengine.node.name": "node1",
"min": 3385124.8,
"max": 3553632,
"latest": 3553632,
"avg": 3469494.86851211,
"sum": 1002684017.0,
"count": 289,
}
```
## Sample queries
### Logs
This query example is from the **HAProxy - Overview** dashboard > **Top 5 URLs with Errors** panel:
```sumo
webengine.cluster.name=* %"sumo.datasource"=haproxy
| json "log" as _rawlog nodrop
| if (isEmpty(_rawlog), _raw, _rawlog) as haproxy_log_message
| parse regex field=haproxy_log_message "(?.*)\]:\s+" nodrop
| parse regex field=haproxy_log_message ":\s+(?[\w\.]+):(?\d+)\s+" nodrop
| parse regex field=haproxy_log_message "\s+\[(?.+)\]\s+" nodrop
| parse regex field=haproxy_log_message "\s+\[(?.+)\]\s+(?\S+)\s+(?\S+)/(?\S+)\s+" nodrop
| parse regex field=haproxy_log_message "\s+(?-?\d+)/(?-?\d+)/(?-?\d+)/(?
### Step 3: Send logs and metrics to Sumo Logic
import LogsIntro from '../../../reuse/apps/opentelemetry/send-logs-intro.md';
1. Copy the yaml file to `/etc/otelcol-sumo/conf.d/` folder in the Haproxy instance which needs to be monitored.
2. Restart the collector using:
```sh
sudo systemctl restart otelcol-sumo
```
1. Copy the yaml file to `/etc/otelcol-sumo/conf.d/` folder in the Haproxy instance which needs to be monitored.
2. Restart the otelcol-sumo process using:
```sh
otelcol-sumo --config /etc/otelcol-sumo/sumologic.yaml --config "glob:/etc/otelcol-sumo/conf.d/*.yaml"
```
import ChefNoEnv from '../../../reuse/apps/opentelemetry/chef-without-env.md';
import AnsibleNoEnv from '../../../reuse/apps/opentelemetry/ansible-without-env.md';
import PuppetNoEnv from '../../../reuse/apps/opentelemetry/puppet-without-env.md';
import LogsOutro from '../../../reuse/apps/opentelemetry/send-logs-outro.md';
## Sample log messages
```bash
May 13 08:24:43 localhost haproxy[21813]:
27.2.81.92:64274 [13/May/2021:08:24:43.921] web-edupia.vn-4
```
## Sample metrics
```json
{
"Query": "A",
"metric": "avg",
"haproxy.proxy_name": "stats",
"webengine.cluster.name": "haproxy_otel_cluster",
"webengine.node.name": "node1",
"min": 3385124.8,
"max": 3553632,
"latest": 3553632,
"avg": 3469494.86851211,
"sum": 1002684017.0,
"count": 289,
}
```
## Sample queries
### Logs
This query example is from the **HAProxy - Overview** dashboard > **Top 5 URLs with Errors** panel:
```sumo
webengine.cluster.name=* %"sumo.datasource"=haproxy
| json "log" as _rawlog nodrop
| if (isEmpty(_rawlog), _raw, _rawlog) as haproxy_log_message
| parse regex field=haproxy_log_message "(?.*)\]:\s+" nodrop
| parse regex field=haproxy_log_message ":\s+(?[\w\.]+):(?\d+)\s+" nodrop
| parse regex field=haproxy_log_message "\s+\[(?.+)\]\s+" nodrop
| parse regex field=haproxy_log_message "\s+\[(?.+)\]\s+(?\S+)\s+(?\S+)/(?\S+)\s+" nodrop
| parse regex field=haproxy_log_message "\s+(?-?\d+)/(?-?\d+)/(?-?\d+)/(?-?\d+)/(?\+?\d+)\s+" nodrop
| parse regex field=haproxy_log_message "\s+(?\d+)\s+(?[\d-]+)\s+(?.*)\s+(?\d+)/(?\d+)/(?\d+)/(?\d+)/(?\+?\d+)\s+" nodrop
| parse regex field=haproxy_log_message "\s+(?\d+)/(?\d+)\s+" nodrop
| parse regex field=haproxy_log_message "\s+\{(?.*)\}\s+" nodrop
| parse regex field=haproxy_log_message "\s+\"(?.*)\"" nodrop
| parse regex field=request_headers "(?\S+)\|(?[^\"]*)"
| parse regex field=http_request "(?\w+)\s+(?[^\"]*)\s+(?\w+)"| where status_code matches "4*" or status_code matches "5*" and !isEmpty(c_ip) |count by status_code,request
| sort by _count
| limit 5
```
### Metrics
Here is a sample metrics query from the **Http Response Codes** dashboard > **HAProxy - Backend Metrics** panel:
```sql
sumo.datasource=haproxy metric=haproxy.requests.total status_code=* haproxy.service_name=backend deployment.environment=* webengine.cluster.name=* webengine.node.name=* haproxy.proxy_name=*
| parse field=status_code * as code
| avg by webengine.cluster.name,webengine.node.name,haproxy.proxy_name,code
```
## Viewing the HAProxy dashboards
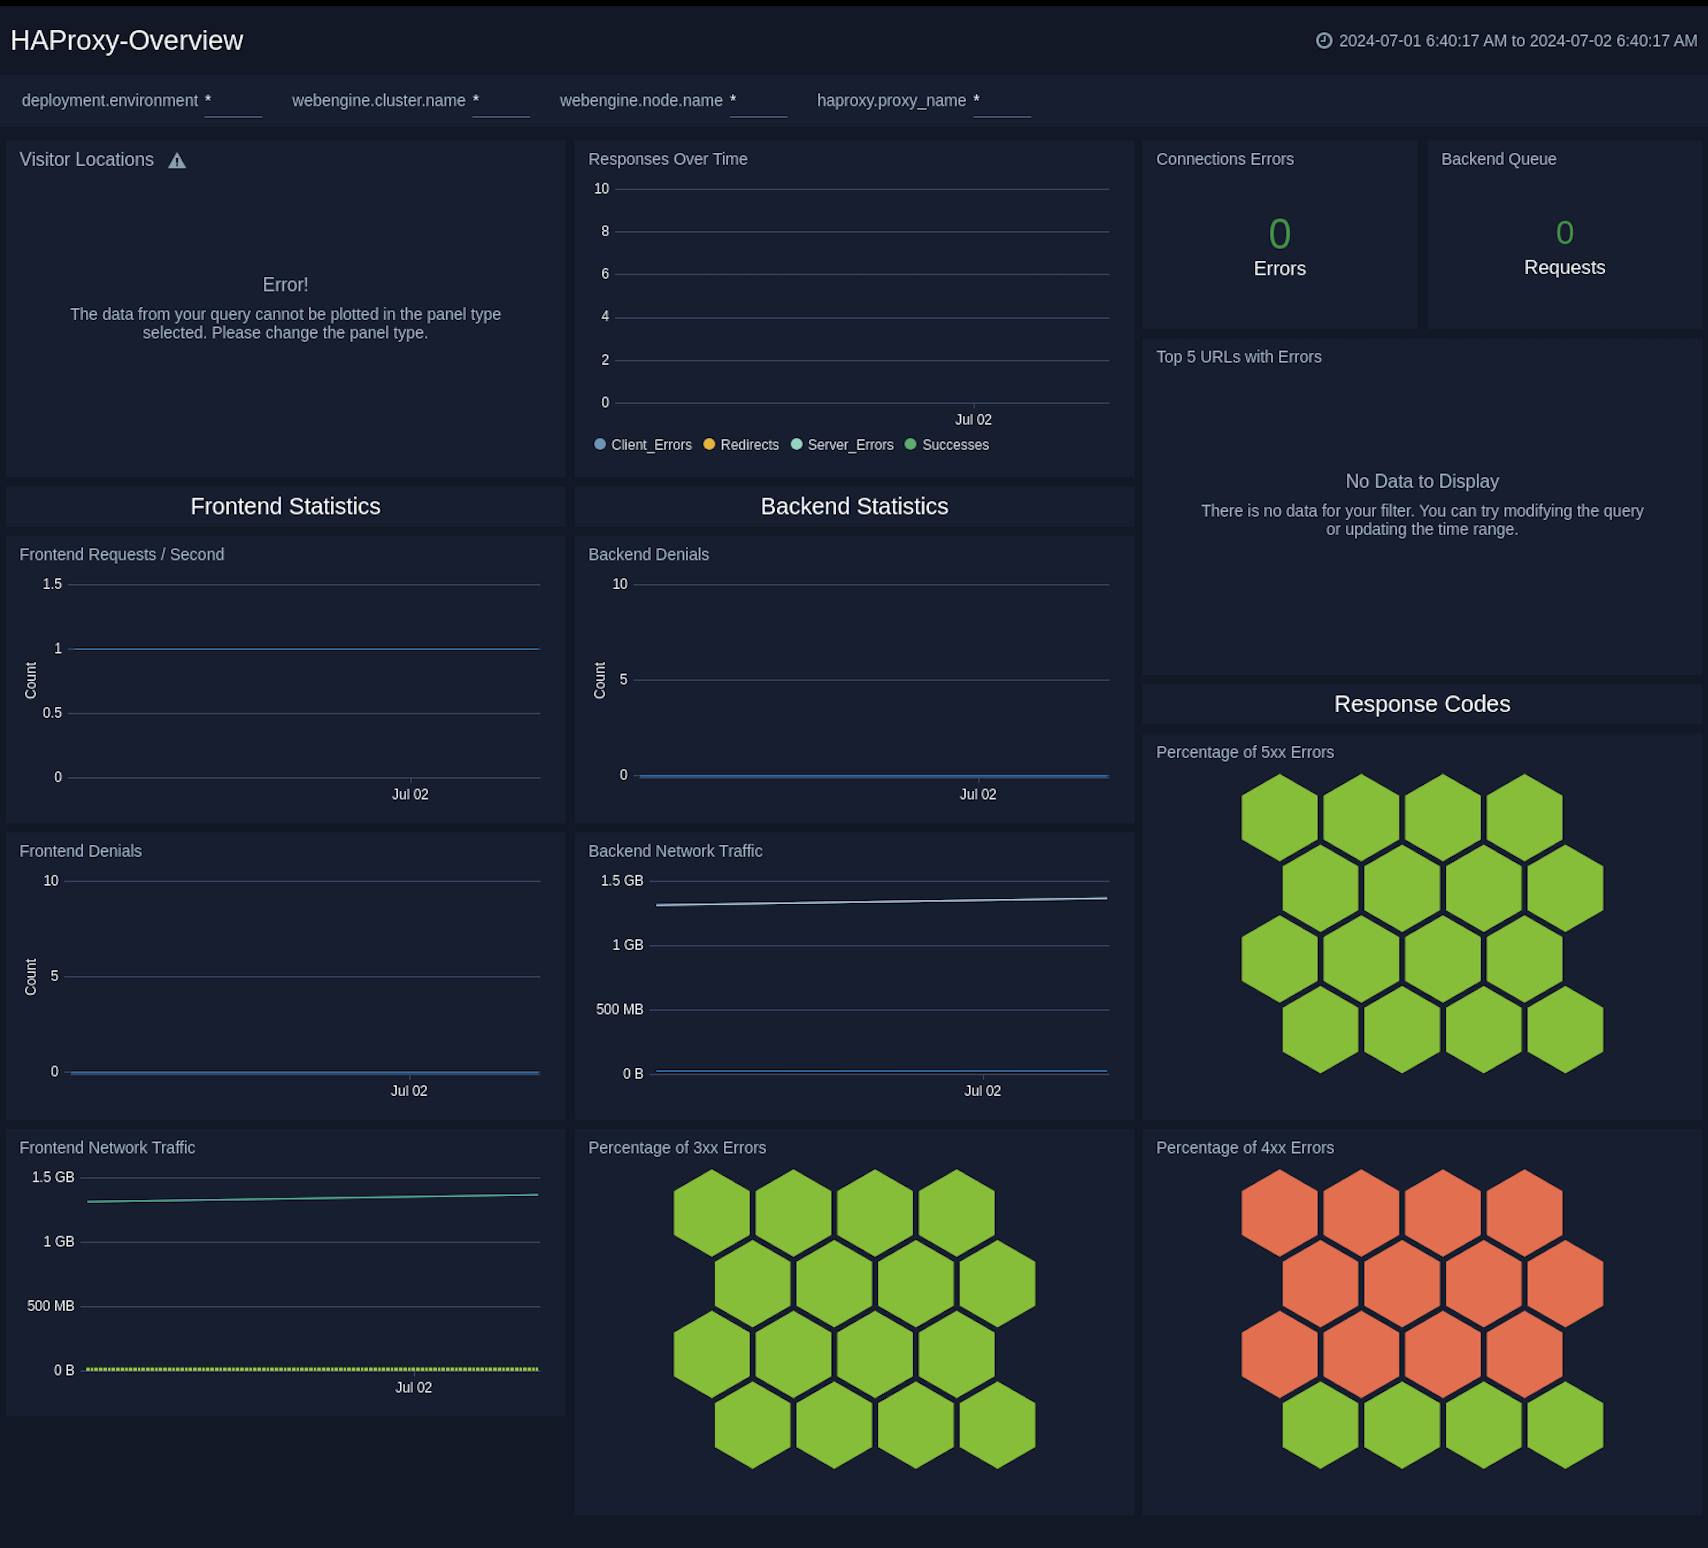
### Overview
The **HAProxy - Overview** dashboard provides an at-a-glance view of HAProxy visitor location, response over time and url with errors.
Use this dashboard to:
- Gain insights into originated traffic location by region. This can help you allocate computer resources to different regions according to their needs.
- Gain insights into Client, Server Responses on HAProxy Server. This helps you identify errors in HAProxy Server.
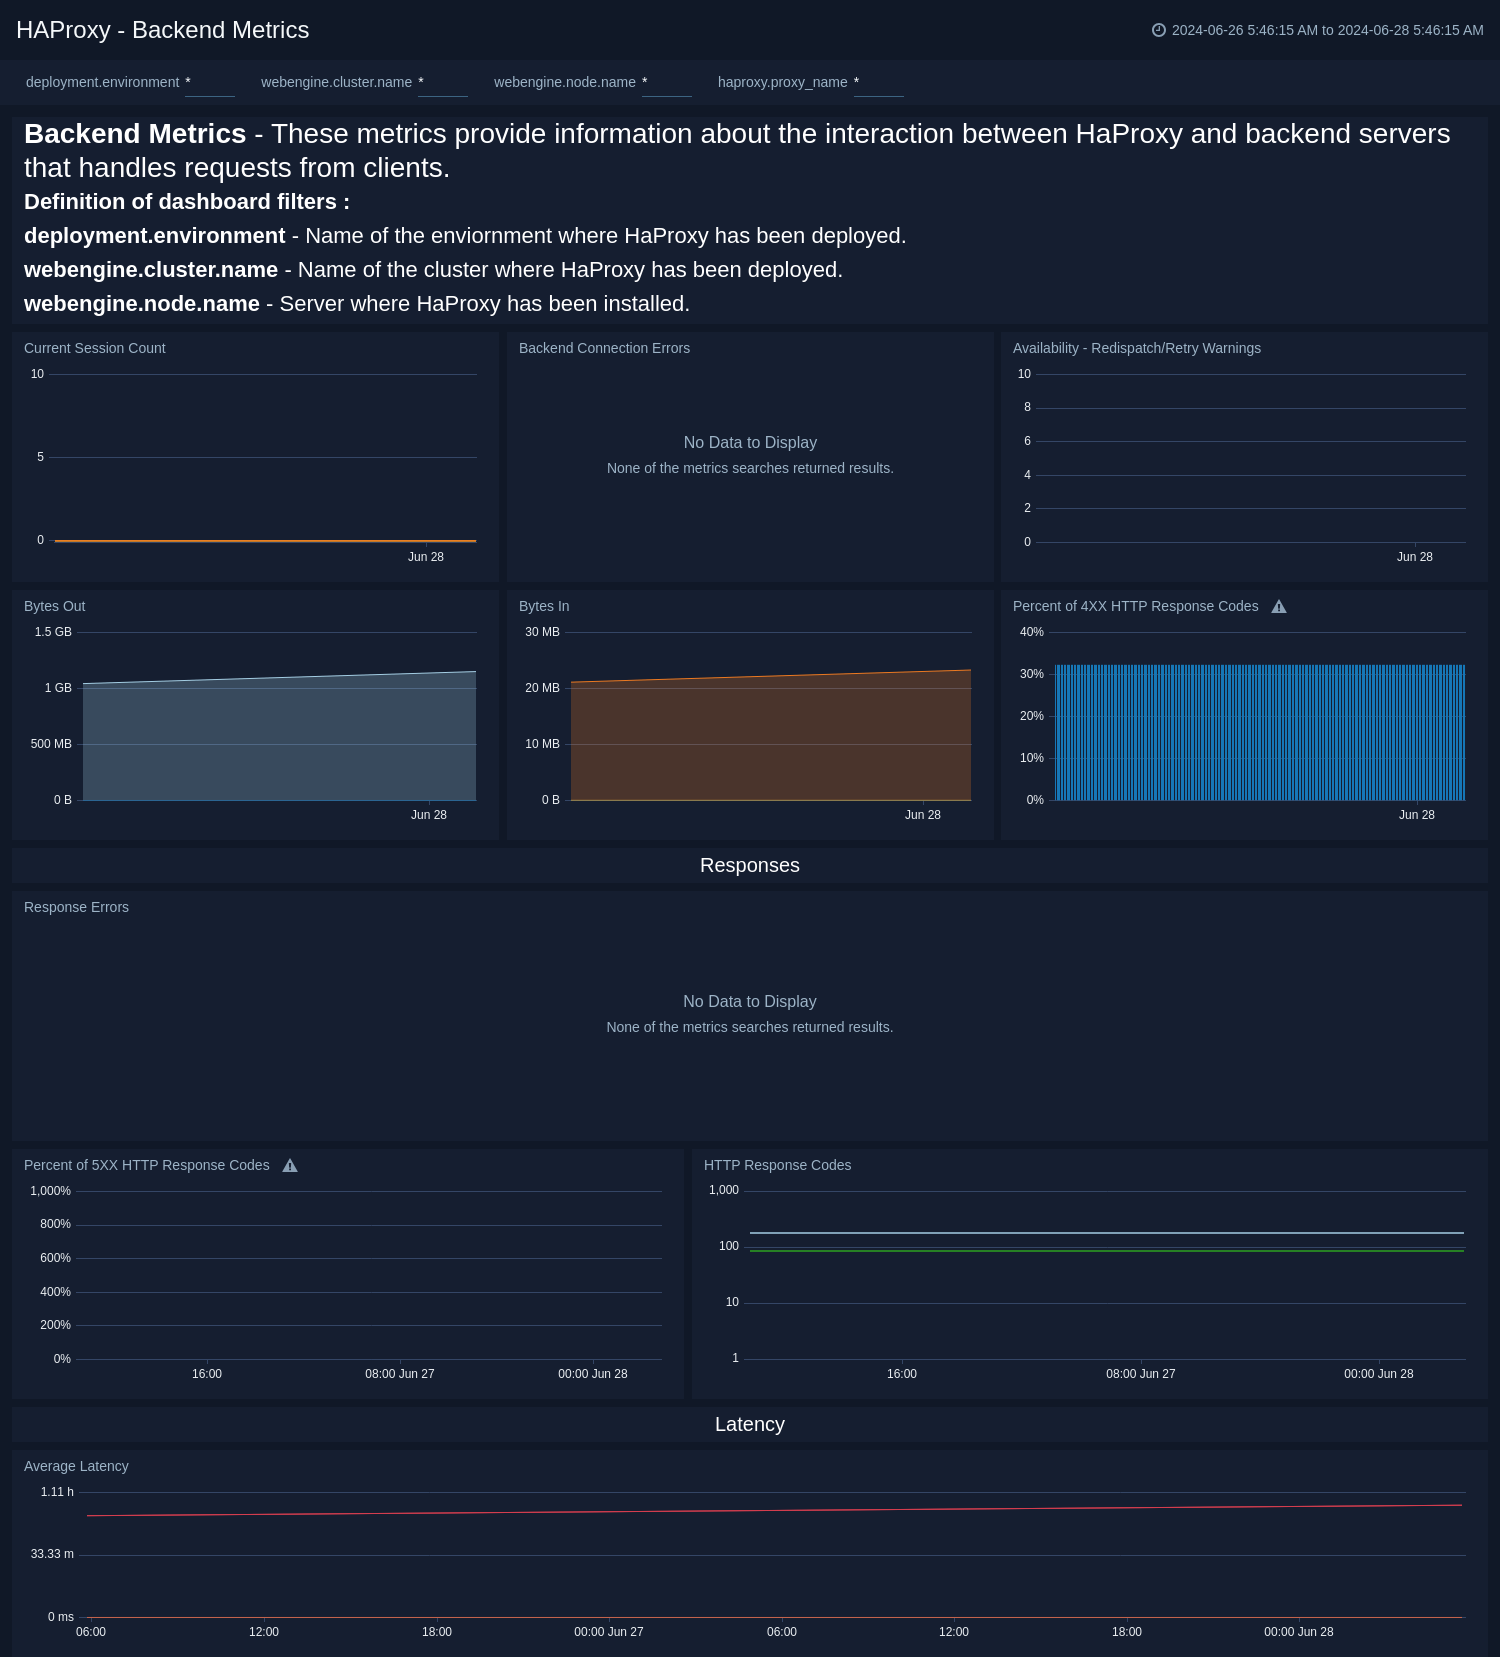
 ### Backend
The **HAProxy - Backend** dashboard provides an at-a-glance view for the number of backend active servers, backend weight, respond code from backend, and throughput http.
### Backend
The **HAProxy - Backend** dashboard provides an at-a-glance view for the number of backend active servers, backend weight, respond code from backend, and throughput http.
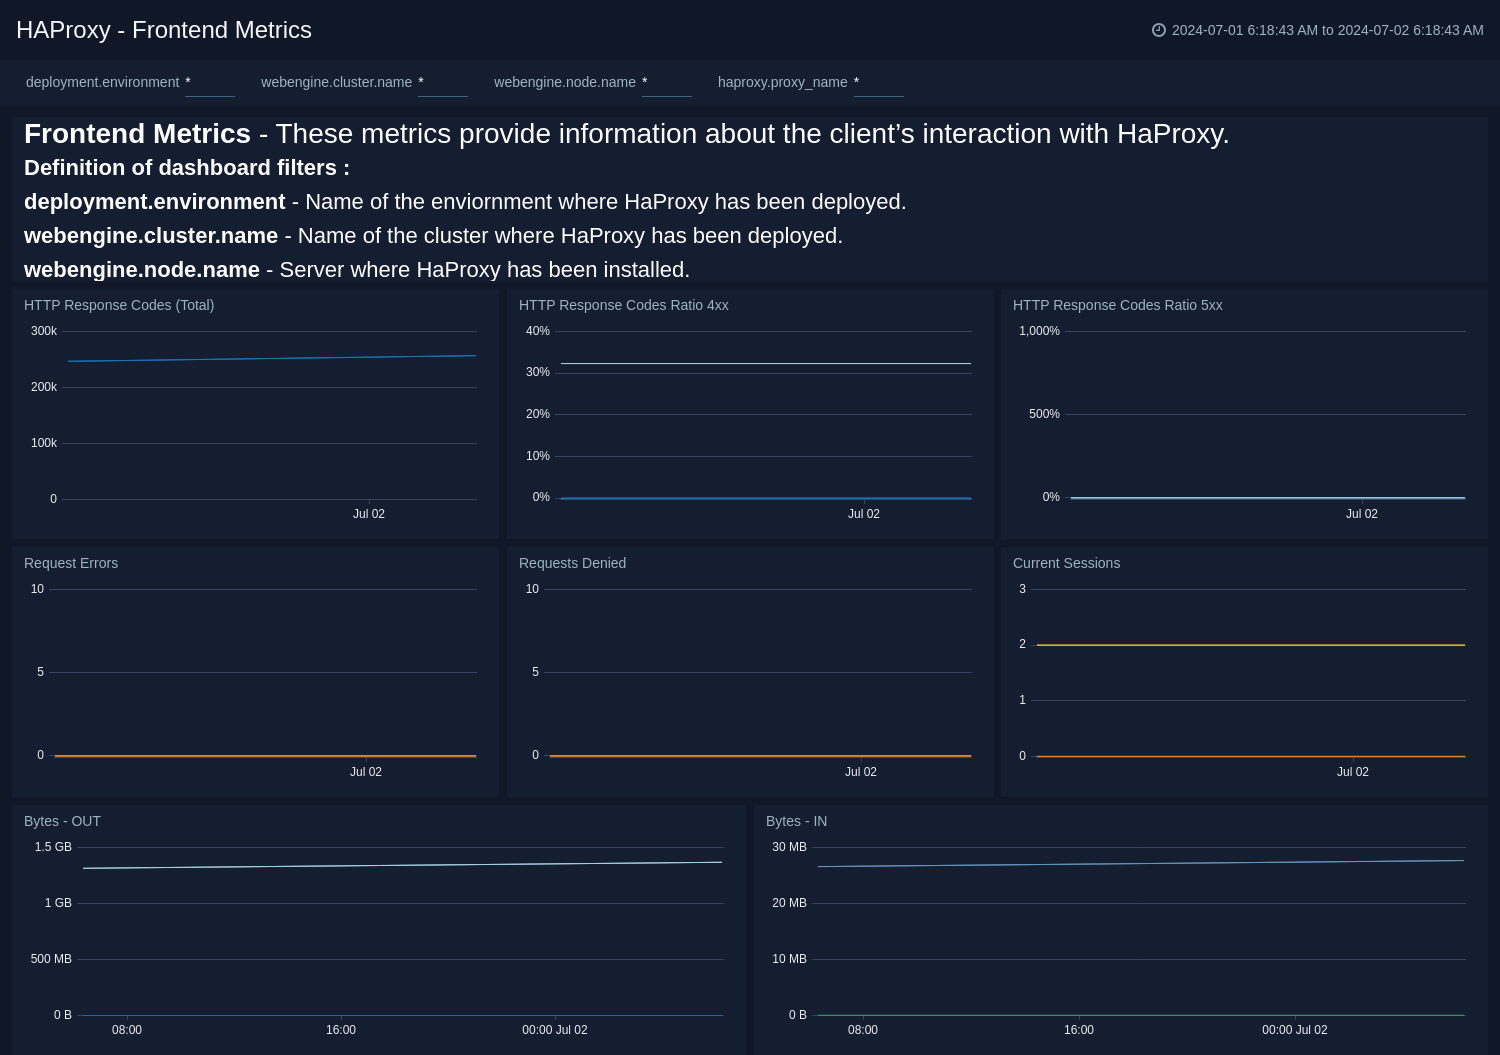
 ### Frontend
The **HAProxy - Frontend** dashboard provides details of HAProxy Frontend. It provides information such as number request to frontend, number of error requests, and current session.
### Frontend
The **HAProxy - Frontend** dashboard provides details of HAProxy Frontend. It provides information such as number request to frontend, number of error requests, and current session.
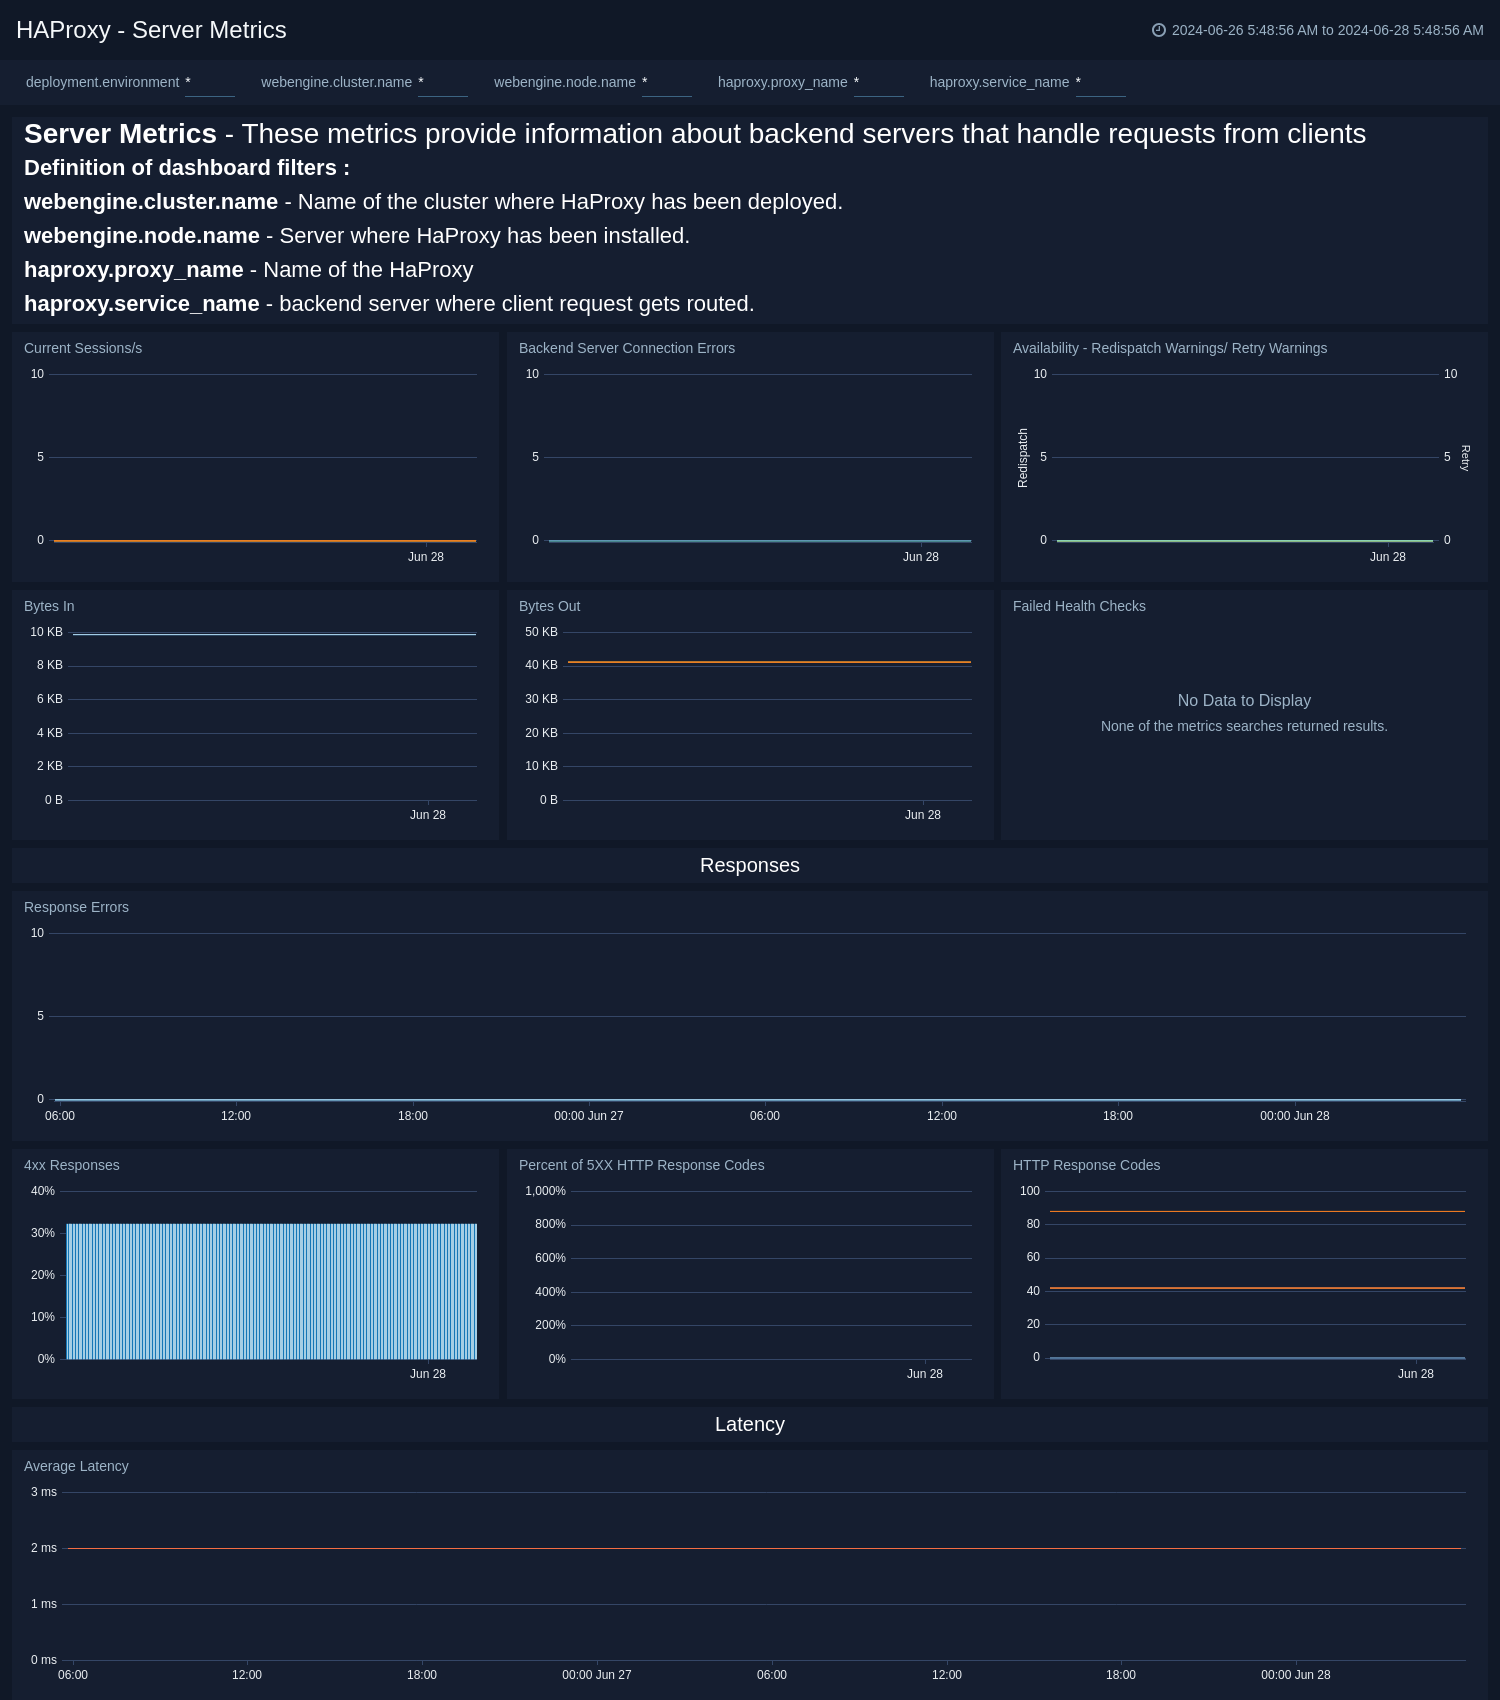
 ### Server
The **HAProxy - Server** dashboard provides details of HAProxy Server. This dashboard helps you monitor the uptime and error request by proxy.
### Server
The **HAProxy - Server** dashboard provides details of HAProxy Server. This dashboard helps you monitor the uptime and error request by proxy.
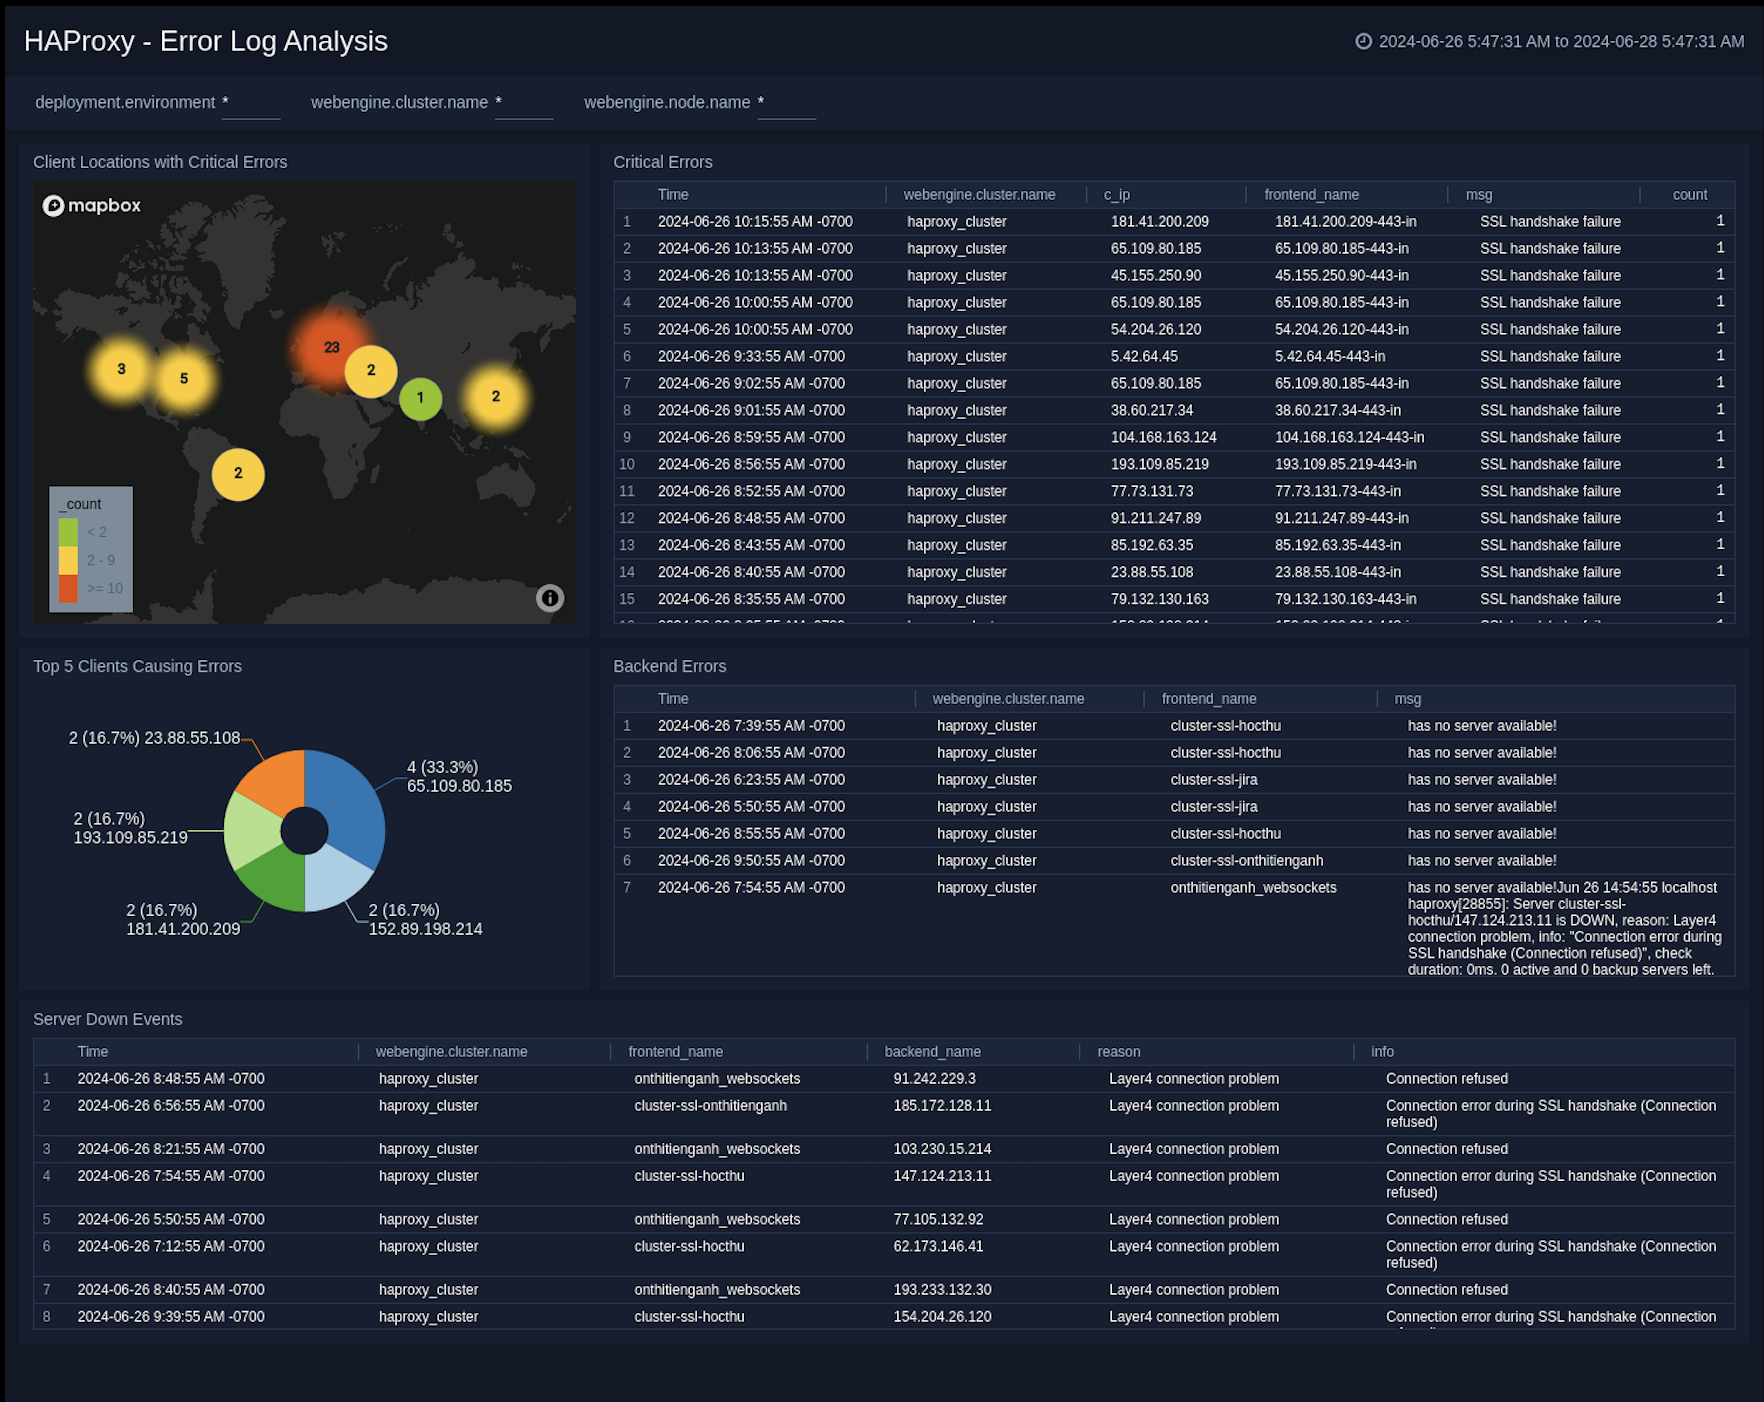
 ### Error Log Analysis
The **HAProxy - Error Logs Analysis** dashboard provides a high-level view of log level breakdowns, comparisons, and trends. The panels also show the geographic locations of clients and clients with critical messages, new connections and outliers, client requests, request trends, and request outliers.
Use this dashboard to:
- Track requests from clients. A request is a message asking for a resource, such as a page or an image.
- To track and view client geographic locations generating errors.
- Track critical alerts and emergency error alerts.
### Error Log Analysis
The **HAProxy - Error Logs Analysis** dashboard provides a high-level view of log level breakdowns, comparisons, and trends. The panels also show the geographic locations of clients and clients with critical messages, new connections and outliers, client requests, request trends, and request outliers.
Use this dashboard to:
- Track requests from clients. A request is a message asking for a resource, such as a page or an image.
- To track and view client geographic locations generating errors.
- Track critical alerts and emergency error alerts.
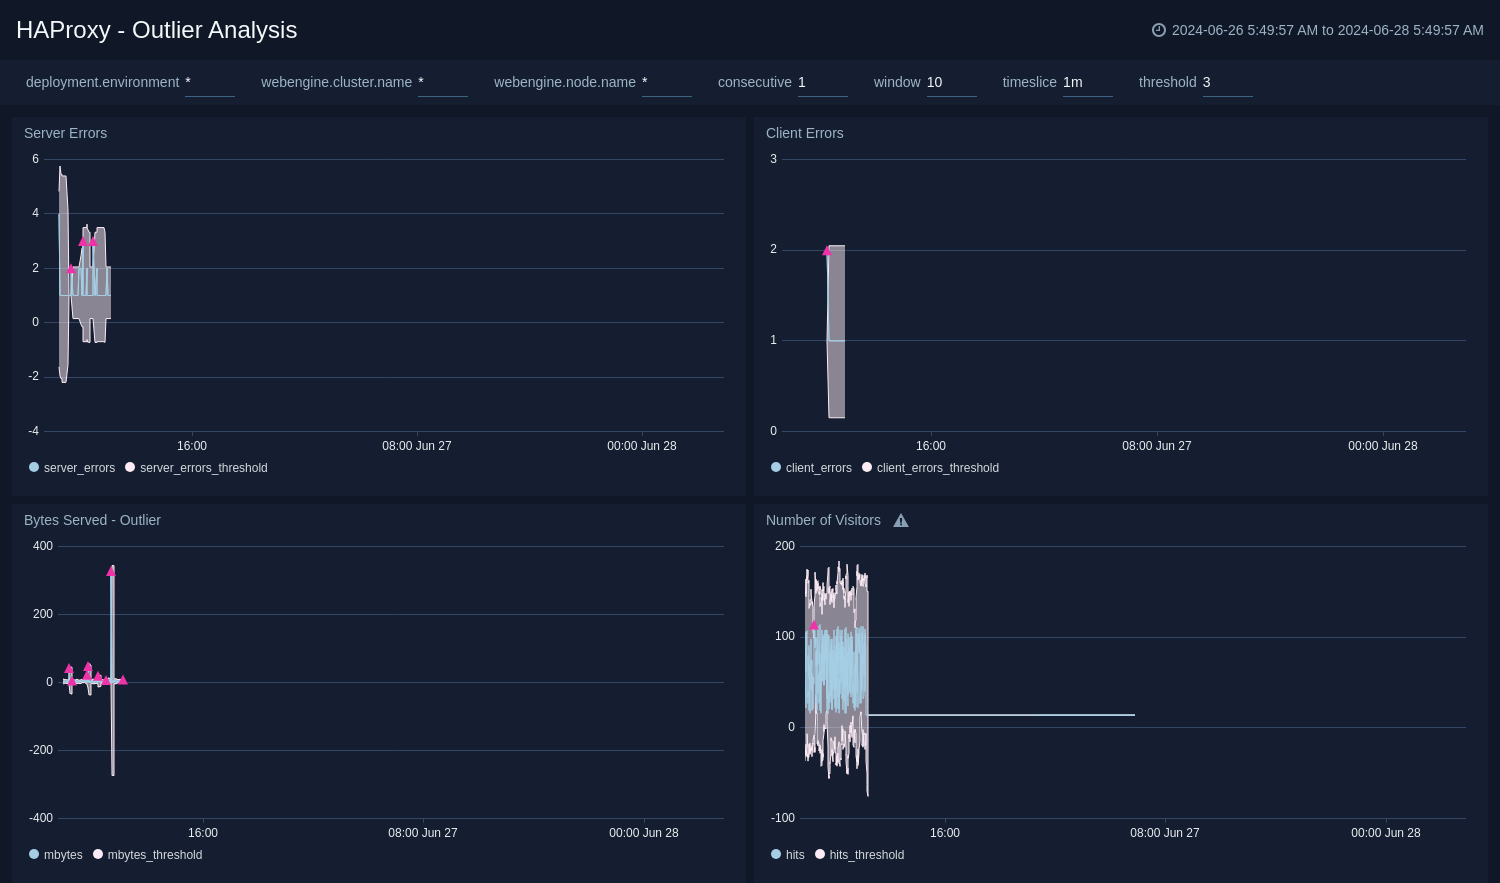
 ### Outlier Analysis
The **HAProxy - Outlier Analysis** dashboard provides a high-level view of HAProxy server outlier metrics for bytes served, number of visitors, and server errors. You can select the time interval over which outliers are aggregated, then hover the cursor over the graph to display detailed information for that point in time.
Use this dashboard to:
- Detect the outliers in your infrastructure with Sumo Logic's machine learning algorithm.
- To identify outliers in incoming traffic and the number of errors encountered by your servers.
### Outlier Analysis
The **HAProxy - Outlier Analysis** dashboard provides a high-level view of HAProxy server outlier metrics for bytes served, number of visitors, and server errors. You can select the time interval over which outliers are aggregated, then hover the cursor over the graph to display detailed information for that point in time.
Use this dashboard to:
- Detect the outliers in your infrastructure with Sumo Logic's machine learning algorithm.
- To identify outliers in incoming traffic and the number of errors encountered by your servers.
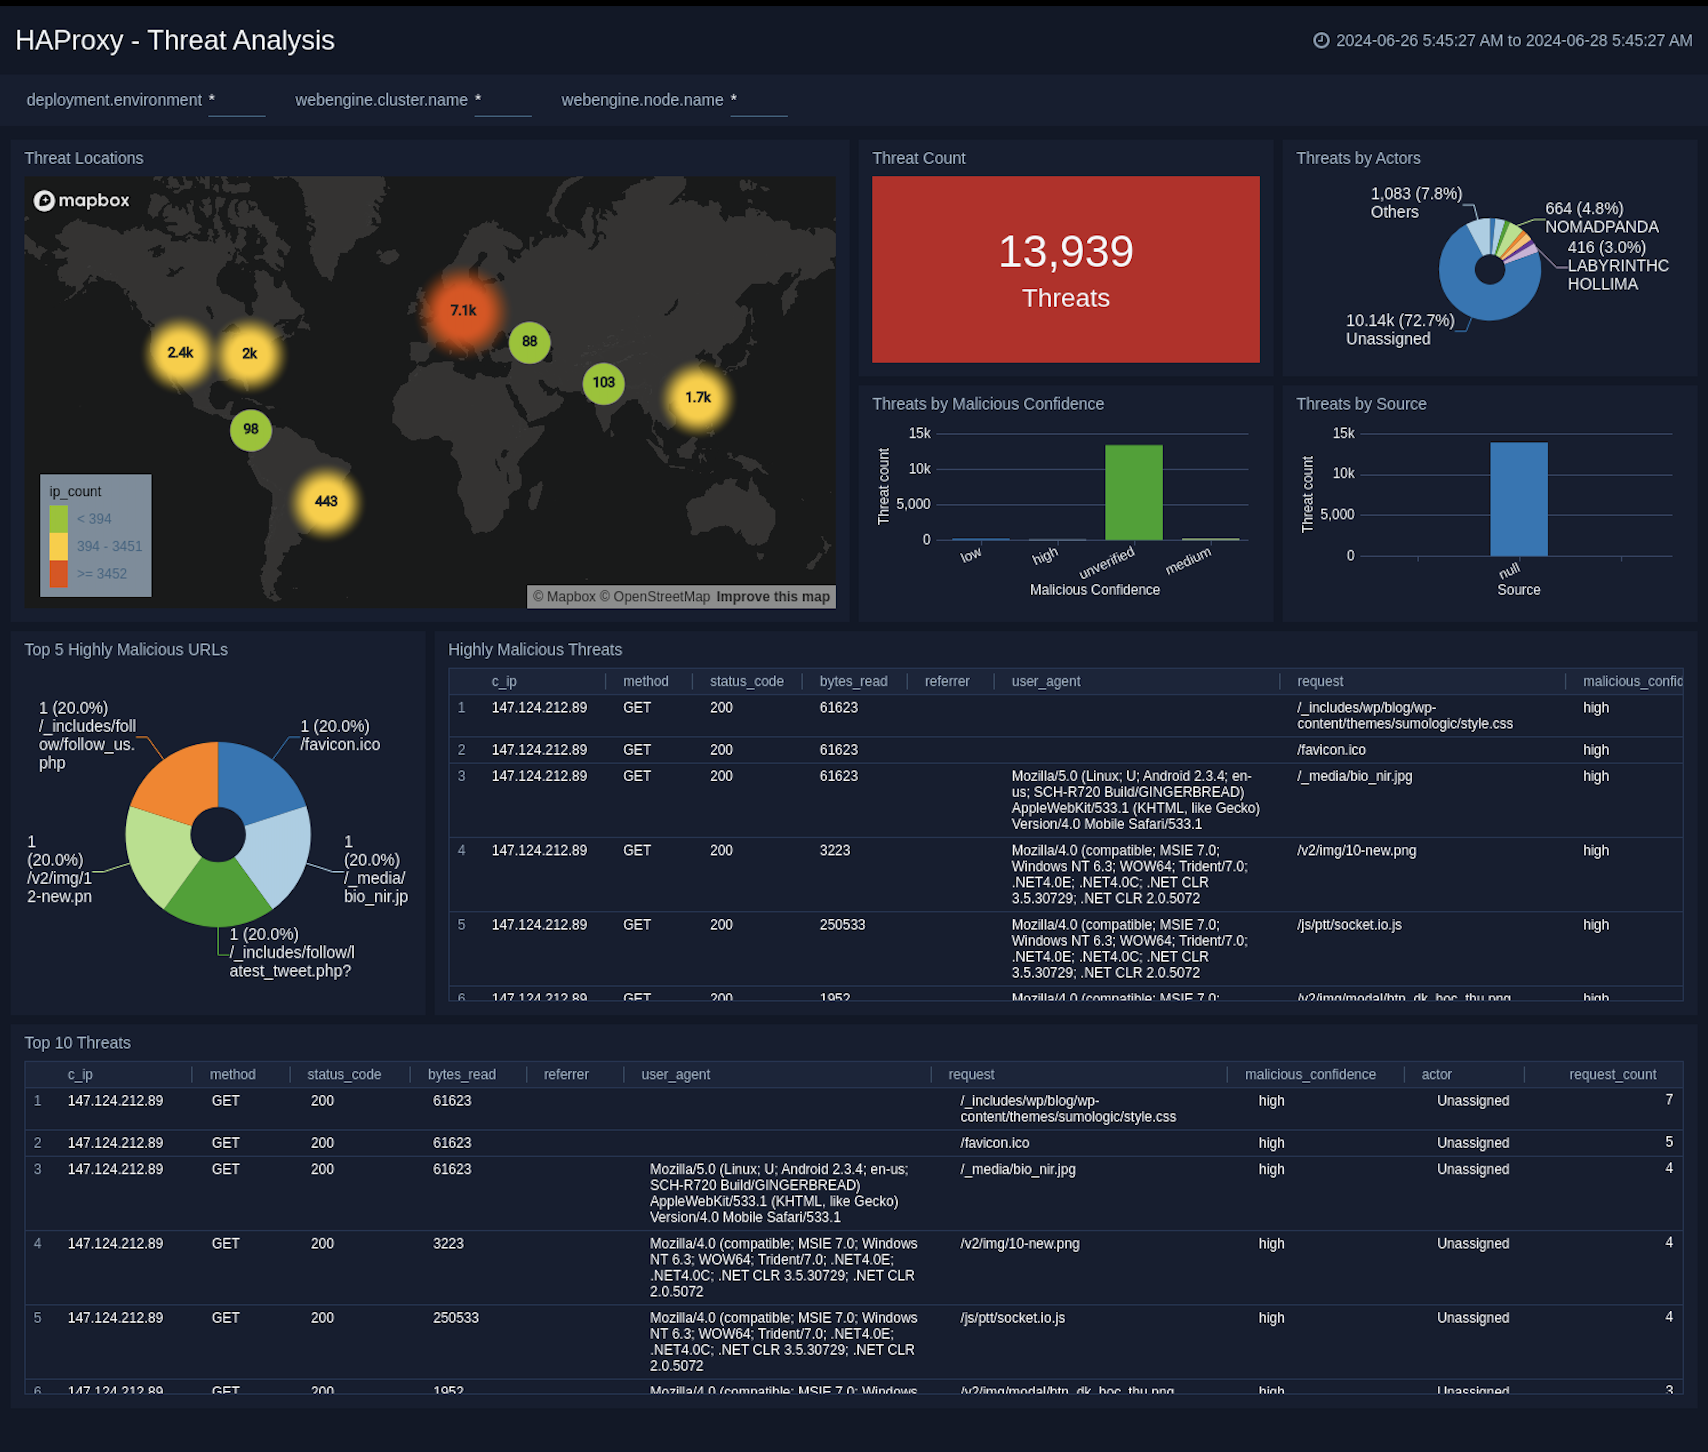
 ### Threat Analysis
The **HAProxy - Threat Analysis** dashboard provides an at-a-glance view of threats to HAProxy servers on your network. Dashboard panels display the threat count over a selected time period, geographic locations where threats occurred, source breakdown, actors responsible for threats, severity, and a correlation of IP addresses, method, and status code of threats.
Use this dashboard to:
- To gain insights and understand threats in incoming traffic and discover potential IOCs. Incoming traffic requests are analyzed using Sumo Logic [threat intelligence](/docs/security/threat-intelligence/).
### Threat Analysis
The **HAProxy - Threat Analysis** dashboard provides an at-a-glance view of threats to HAProxy servers on your network. Dashboard panels display the threat count over a selected time period, geographic locations where threats occurred, source breakdown, actors responsible for threats, severity, and a correlation of IP addresses, method, and status code of threats.
Use this dashboard to:
- To gain insights and understand threats in incoming traffic and discover potential IOCs. Incoming traffic requests are analyzed using Sumo Logic [threat intelligence](/docs/security/threat-intelligence/).
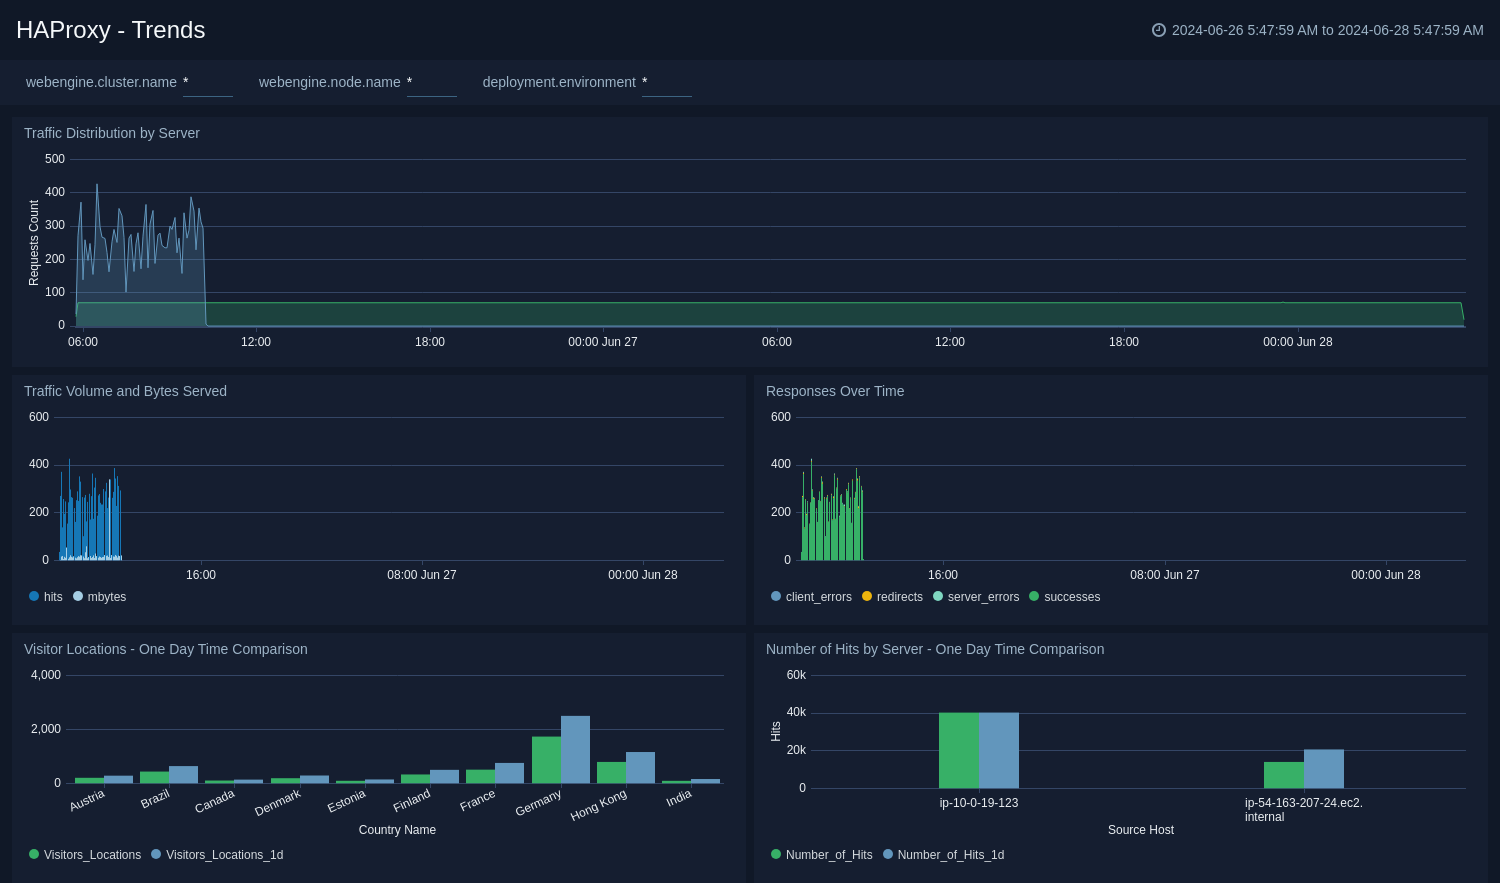
 ### Trends
The **HAProxy - Trends** dashboard provides an at-a-glance view of traffic to HAProxy servers on your network. Dashboard panels display the traffic count over one day time period, locations where traffic trends for visits by country one days time.
### Trends
The **HAProxy - Trends** dashboard provides an at-a-glance view of traffic to HAProxy servers on your network. Dashboard panels display the traffic count over one day time period, locations where traffic trends for visits by country one days time.
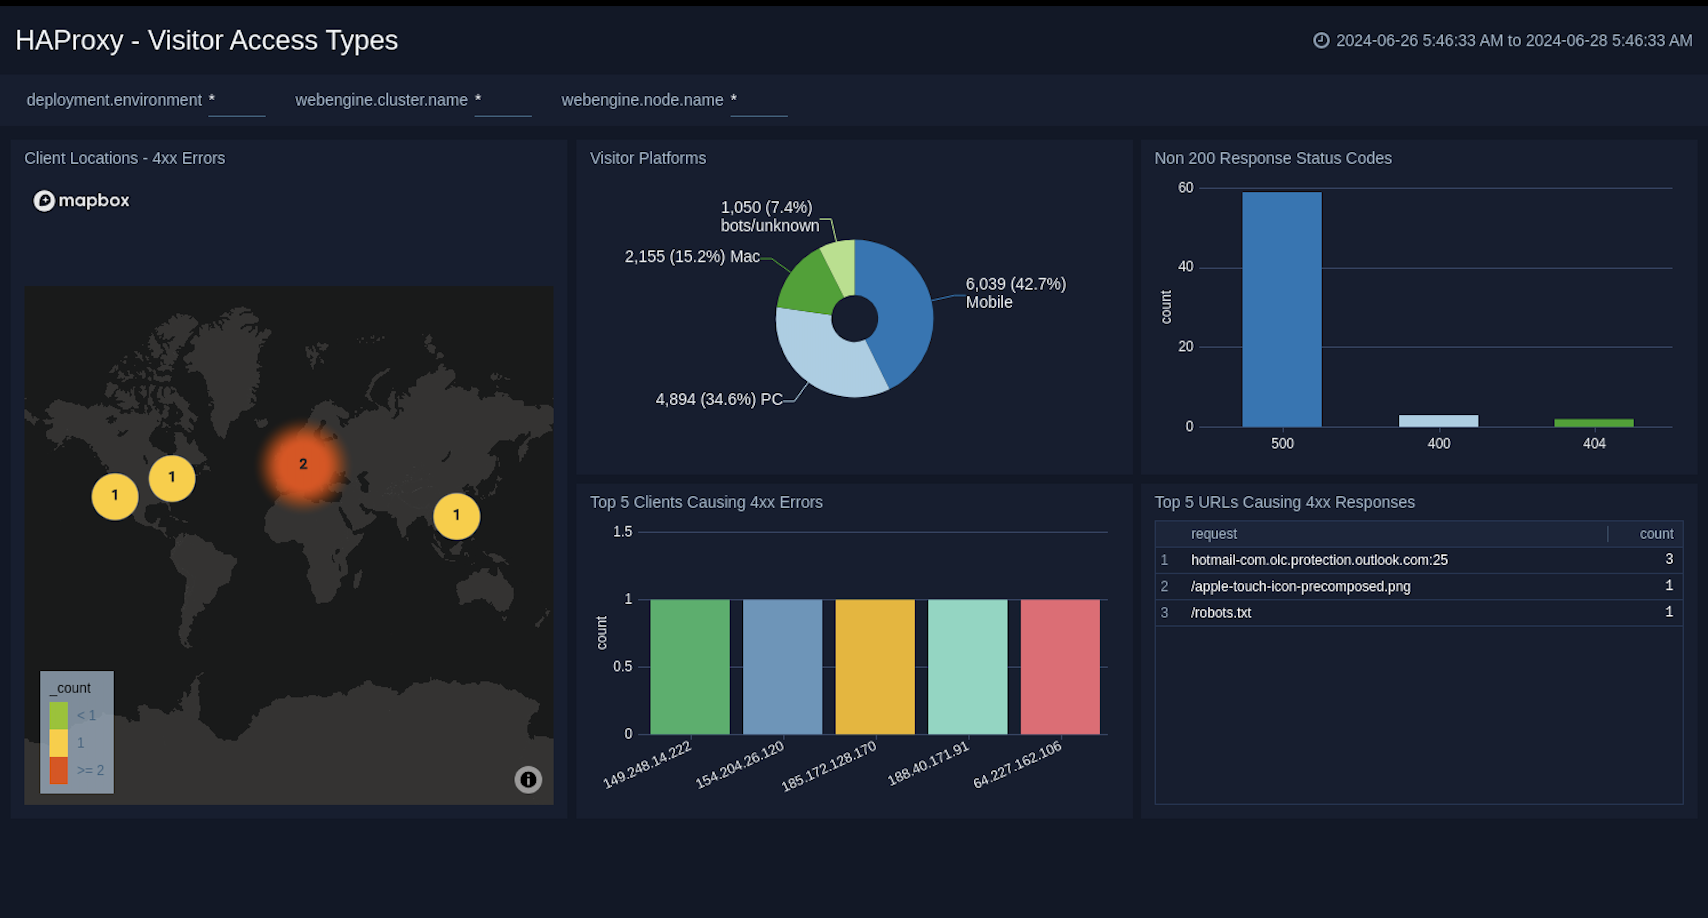
 ### Visitor Access Types
The **HAProxy - Visitor Access Types** dashboard provides insights into visitor platform types, browsers, and operating systems, as well as the most popular mobile devices, PC and Mac versions used.
Use this dashboard to:
- Understand which platform and browsers are used to gain access to your infrastructure. These insights can be useful for planning in which browsers, platforms, and operating systems (OS) should be supported by different software services.
### Visitor Access Types
The **HAProxy - Visitor Access Types** dashboard provides insights into visitor platform types, browsers, and operating systems, as well as the most popular mobile devices, PC and Mac versions used.
Use this dashboard to:
- Understand which platform and browsers are used to gain access to your infrastructure. These insights can be useful for planning in which browsers, platforms, and operating systems (OS) should be supported by different software services.
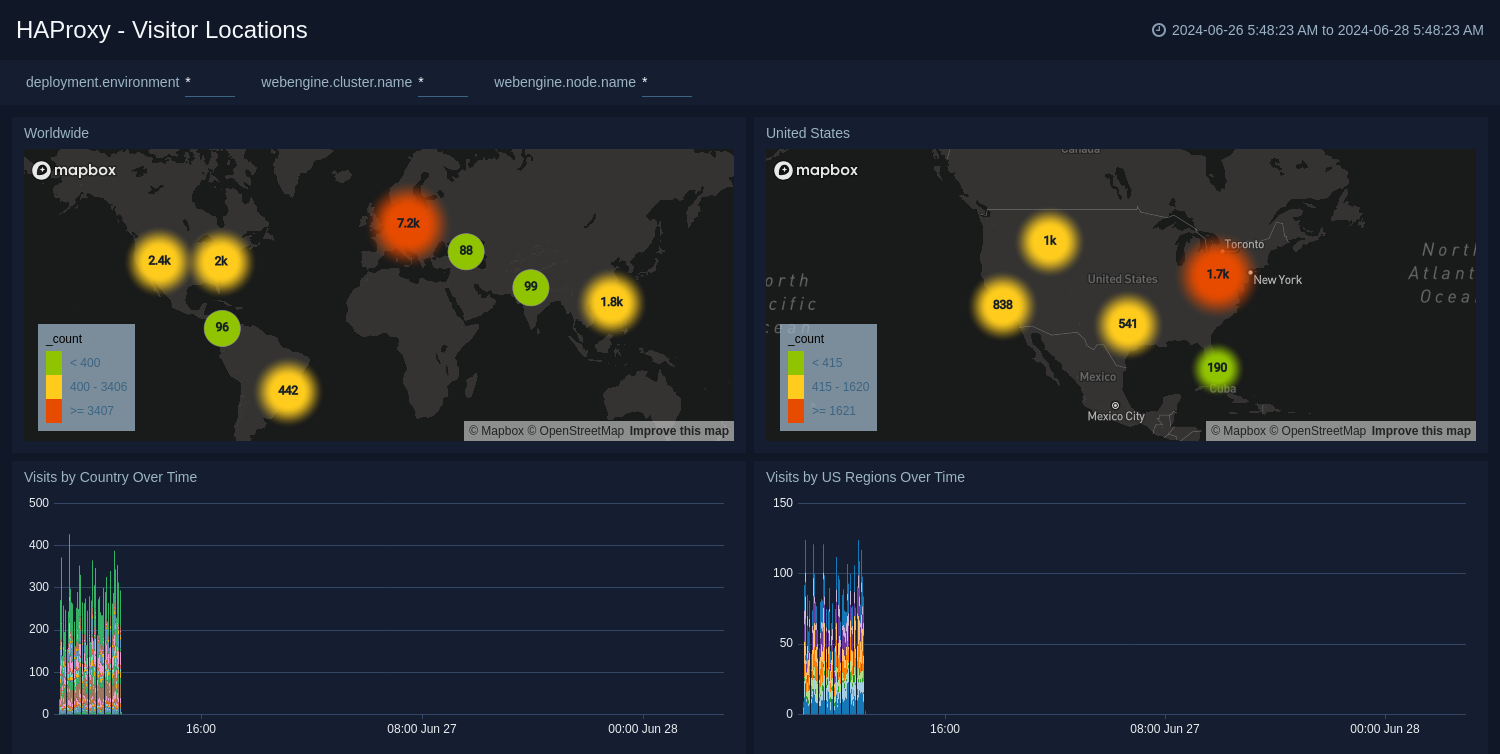
 ### Visitor Locations
The **HAProxy - Visitor Locations** dashboard provides a high-level view of HAProxy visitor geographic locations both worldwide and in the United States. Dashboard panels also show graphic trends for visits by country over time and visits by US region over time.
Use this dashboard to:
- Gain insights into geographic locations of your user base. This is useful for resource planning in different regions across the globe.
### Visitor Locations
The **HAProxy - Visitor Locations** dashboard provides a high-level view of HAProxy visitor geographic locations both worldwide and in the United States. Dashboard panels also show graphic trends for visits by country over time and visits by US region over time.
Use this dashboard to:
- Gain insights into geographic locations of your user base. This is useful for resource planning in different regions across the globe.
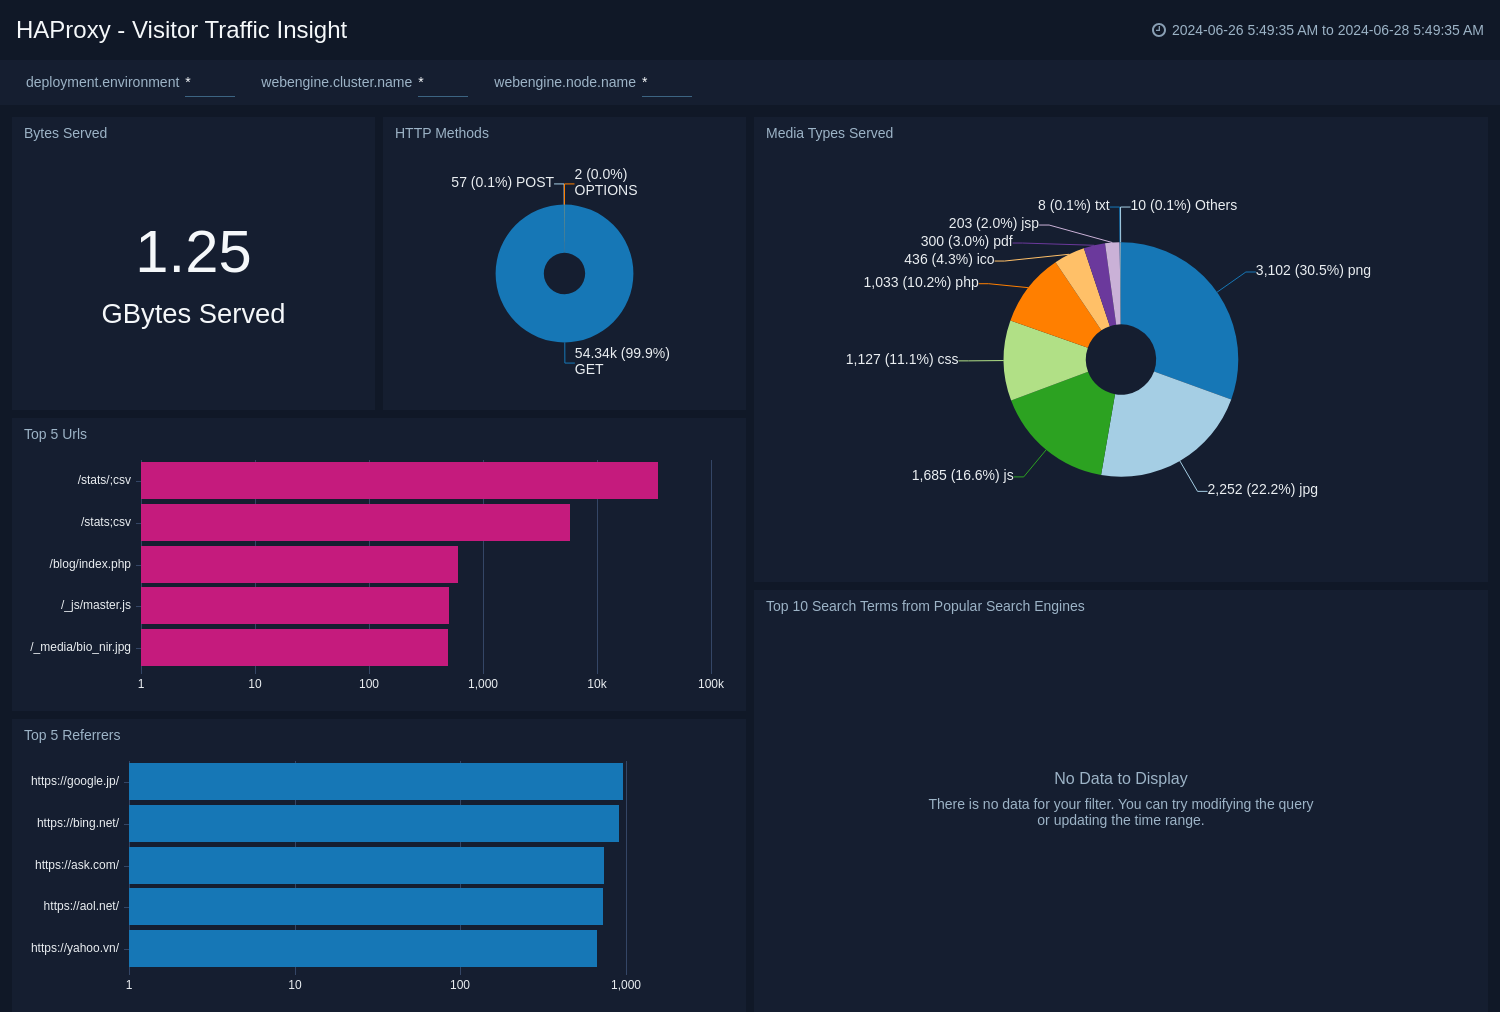
 ### Visitor Traffic Insight
The **HAProxy - Visitor Traffic Insight** dashboard provides detailed information on the top documents accessed, top referrers, top search terms from popular search engines, and the media types served.
Use this dashboard to:
- To understand the type of content that is frequently requested by users.
- It helps in allocating IT resources according to the content types.
### Visitor Traffic Insight
The **HAProxy - Visitor Traffic Insight** dashboard provides detailed information on the top documents accessed, top referrers, top search terms from popular search engines, and the media types served.
Use this dashboard to:
- To understand the type of content that is frequently requested by users.
- It helps in allocating IT resources according to the content types.
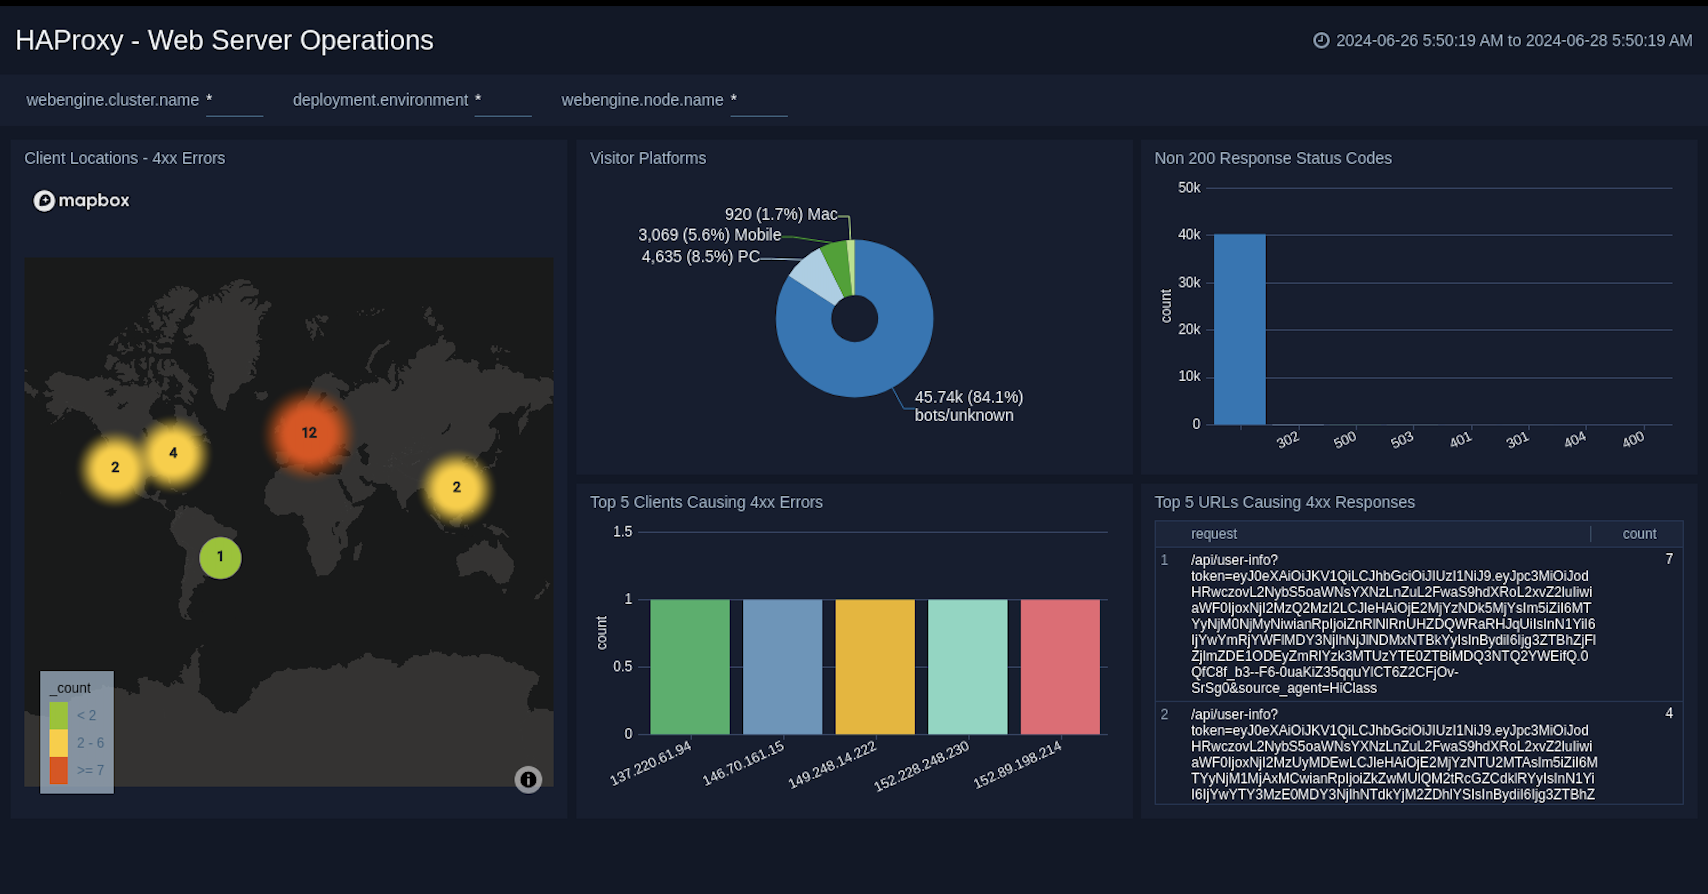
 ### Web Server Operations
The **HAProxy - Web Server Operations** dashboard provides a high-level view combined with detailed information on the top ten bots, geographic locations, and data for clients with high error rates, server errors over time, and non 200 response code status codes. Dashboard panels also show information on server error logs, error log levels, error responses by a server, and the top URIs responsible for 404 responses.
Use this dashboard to:
- Gain insights into Client, Server Responses on HAProxy Server. This helps you identify errors in HAProxy Server.
- To identify geo locations of all Client errors. This helps you identify client location causing errors and helps you to block client IPs.
### Web Server Operations
The **HAProxy - Web Server Operations** dashboard provides a high-level view combined with detailed information on the top ten bots, geographic locations, and data for clients with high error rates, server errors over time, and non 200 response code status codes. Dashboard panels also show information on server error logs, error log levels, error responses by a server, and the top URIs responsible for 404 responses.
Use this dashboard to:
- Gain insights into Client, Server Responses on HAProxy Server. This helps you identify errors in HAProxy Server.
- To identify geo locations of all Client errors. This helps you identify client location causing errors and helps you to block client IPs.
 ## Create monitors for HAProxy app
import CreateMonitors from '../../../reuse/apps/create-monitors.md';
### HAProxy alerts
| Name | Description | Alert Condition | Recover Condition |
|:--|:--|:--|:--|
| `HAProxy - Access from Highly Malicious Sources` | This alert is triggered when an HAProxy is accessed from highly malicious IP addresses. | Count > 0 | Count < = 0 |
| `HAProxy - Backend Error` | This alert is triggered when backend server error is detected. | Count > 0 | Count < = 0 |
| `HAProxy - Backend Server Down` | This alert is triggered when a backend server for a given HAProxy server is down. | Count > 0 | Count < = 0 |
| `HAProxy - High Client (HTTP 4xx) Error Rate` | This alert is triggered when there are too many HTTP requests (>5%) with a response status of 4xx. | Count > 0 | Count < = 0 |
| `HAProxy - High Server (HTTP 5xx) Error Rate` | This alert fires when there are too many HTTP requests (>5%) with a response status of 5xx. | Count > 0 | Count < = 0 |
## Additional resources
* Blog: [Everything you need to know about HAProxy log format](https://www.sumologic.com/blog/haproxy-log-format/)
* App description: [HAProxy App for Sumo Logic](https://www.sumologic.com/application/haproxy/)
## Create monitors for HAProxy app
import CreateMonitors from '../../../reuse/apps/create-monitors.md';
### HAProxy alerts
| Name | Description | Alert Condition | Recover Condition |
|:--|:--|:--|:--|
| `HAProxy - Access from Highly Malicious Sources` | This alert is triggered when an HAProxy is accessed from highly malicious IP addresses. | Count > 0 | Count < = 0 |
| `HAProxy - Backend Error` | This alert is triggered when backend server error is detected. | Count > 0 | Count < = 0 |
| `HAProxy - Backend Server Down` | This alert is triggered when a backend server for a given HAProxy server is down. | Count > 0 | Count < = 0 |
| `HAProxy - High Client (HTTP 4xx) Error Rate` | This alert is triggered when there are too many HTTP requests (>5%) with a response status of 4xx. | Count > 0 | Count < = 0 |
| `HAProxy - High Server (HTTP 5xx) Error Rate` | This alert fires when there are too many HTTP requests (>5%) with a response status of 5xx. | Count > 0 | Count < = 0 |
## Additional resources
* Blog: [Everything you need to know about HAProxy log format](https://www.sumologic.com/blog/haproxy-log-format/)
* App description: [HAProxy App for Sumo Logic](https://www.sumologic.com/application/haproxy/)