Modern systems look very different from what they were years ago. Development organizations have moved away from building traditional monoliths towards developing containerized applications running across a highly distributed infrastructure.
While this change has made systems inherently more resilient, the increase in overall complexity has made it more important and challenging to effectively identify and address problems at their root cause when issues occur.
Part of the solution to this challenge lies in leveraging tools and platforms that can effectively monitor the health of services and infrastructure. To that end, this post will explain best practices for Prometheus monitoring of services and infrastructure. In addition, it will outline the reasons why Prometheus alone is not enough to monitor the complex, highly distributed system environments in use today.
What is Prometheus?
Prometheus is an open-source monitoring and alerting toolkit that was first developed by SoundCloud in 2012 for cloud-native metrics monitoring.
In monitoring and observability, we have three primary data types: logs, metrics, and traces. Metrics serve as the data stopwatch that helps you track service level objectives (SLOs) and service level indicators (SLIs) in a time series data.
High-cardinality metrics have many unique combinations of labels (e.g., user_id, region), which can strain Prometheus’ storage and query performance. However, many customers need more out of their observability environments, and these days, most folks have adopted OpenTelemetry to unify collectors and gather data from all three data sources.
What can be monitored with Prometheus?
Organizations use Prometheus monitoring to collect metrics data regarding service and infrastructure performance. Depending upon the use case, Prometheus metrics may include performance markers such as CPU utilization, memory usage, total requests, requests per second, request count, exception count and more. When leveraged effectively, this collected metrics data can assist organizations in identifying system issues in a timely manner.
Prometheus server architecture
Prometheus architecture is central to the Prometheus server, which performs the actual monitoring functions. The Prometheus server is made up of three major components: a time series database, a worker for data retrieval, and an HTTP server.
Time series database
This component is responsible for storing metrics data. This data is stored as a time series, meaning that the data is represented in the database as a series of timestamped data points belonging to the same metric and set of labeled dimensions.
Worker for data retrieval
This component does exactly what its name implies: it pulls metrics from “targets,” which can be applications, services or other system infrastructure components. It then takes these collected metrics and pushes them to the time series database. The data retrieval worker collects these metrics by scraping HTTP endpoints, also known as a Prometheus instance, on the targets.
By default, the metrics endpoint is < hostaddress >/metrics. You configure Prometheus with a Prometheus exporter to monitor a target. At its core, an exporter is a service that fetches metrics from the target, formats them properly, and exposes the /metrics endpoint so that the data retrieval worker can pull the data for storage in the time series database. To push metrics from jobs that cannot be scraped, the Prometheus Pushgateway allows you to push time series from short-lived service-level batch jobs to an intermediary job that Prometheus can scrape.
HTTP server
This server accepts queries in a Prometheus query language (PromQL) to pull data from the time series database. The HTTP server can be leveraged by the Prometheus graph UI or other data visualization tools, such as Grafana, to provide developers and IT personnel with an interface for querying and visualizing these metrics in a useful, human-friendly format.
Managing Prometheus alerts
The Prometheus Alertmanager is also worth mentioning here. Rules can be set up within the Prometheus configuration to define limits that will trigger an alert when they are exceeded. When this happens, the Prometheus server pushes alerts to the Alertmanager. From there, the Alertmanager handles deduplicating, grouping and routing these alerts to the proper personnel via email or other alerting integration.
Why Prometheus on its own isn’t enough
As we know, modern development architectures have a much higher level of complexity than those of more than a decade ago. Today’s systems contain many servers running containerized applications and services, like a Kubernetes cluster. These services are loosely coupled, calling one another to provide functionality to the end user. Architecturally, these services might also be decoupled and run on multiple cloud environments as well. The complex nature of these systems can have the effect of obscuring the causes of failures.
Organizations need granular insight into system behavior to address this challenge, and collecting and aggregating log event data is critical to this pursuit. This log data can correlate with performance metrics, enabling organizations to gain the insights and context necessary for efficient root cause analysis. While Prometheus collects metrics, it does not collect log data. Therefore, it does not provide the level of detail necessary to support effective incident response on its own.
Furthermore, Prometheus faces challenges when scaled significantly — a situation often unavoidable with such highly distributed modern systems. Prometheus wasn’t originally built to query and aggregate metrics from multiple instances. Configuring it to do so requires adding additional complexity to the organization’s Prometheus deployment. This complicates the process of attaining a holistic view of the entire system, which is a critical aspect of performing incident response with any level of efficiency.
Finally, Prometheus wasn’t built to retain metrics data for long periods of time. Access to this type of historical data can be invaluable for organizations managing complex environments. For one, organizations may want to analyze these metrics to detect patterns that occur over a few months or even a year to gain an understanding of system usage during a specific time period. Such insights can dictate scaling strategies when systems may be pushed to their limits.
Unified collection for Kubernetes monitoring
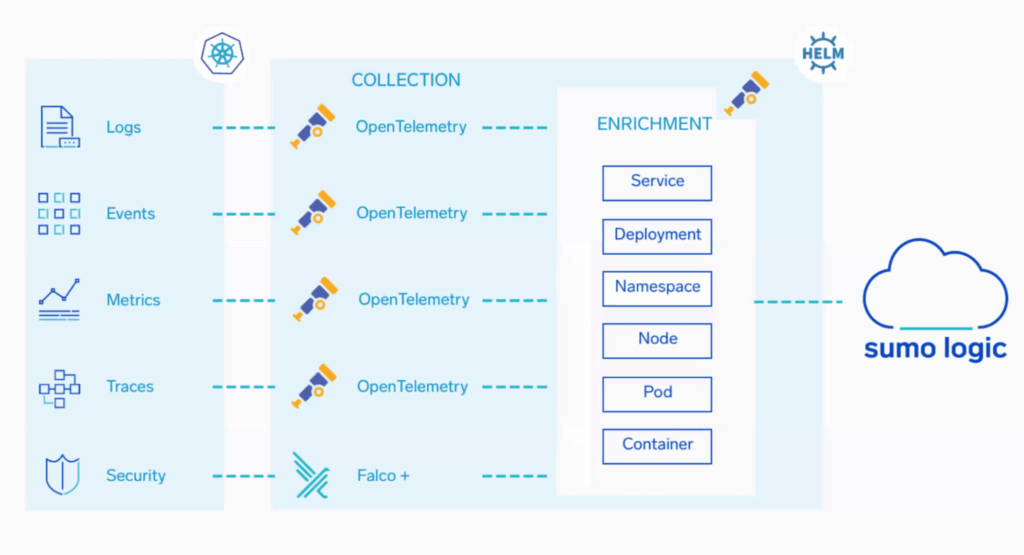
While Prometheus is a great tool for gathering high-level metrics for SLOs and SLIs, site reliability engineers and security analysts must drill down into logs to find what exactly may have gone wrong. That’s why unified telemetry collection across all data types — logs, metrics, and traces is key. We need to shed outdated legacy processes and mindsets to innovate and use the newest best practices to ensure the best possible digital customer experience.

All of these challenges are best addressed by leveraging unified Kubernetes monitoring with Sumo Logic’s OpenTelemetry Collector and setting up the latest Helm Chart. Additionally, with Sumo Logic’s Otel Remote Management, you can save time setting up and managing your collectors. You can still aggregate Prometheus data next to this collector, but there is no reason to use it as middleware for metrics unless your infrastructure necessitates specific esoteric skill sets. For example, familiarity with PromQL or the need for specific histograms unavailable in the Sumo Logic monitoring environment.
It helps to use OpenTelemetry as a standard to achieve a smaller collection footprint and save time on instrumentation for effective security and monitoring best practices.
Curious to learn more? Check out best practices for Kubernetes monitoring.


