Pricing Login
Pricing
Support
Demo
Interactive demos

Click through interactive platform demos now.

Live demo, real expert

Schedule a platform demo with a Sumo Logic expert.

Start free trial

What’s New

See what we’ve been up to at Sumo Logic

AWS Observability v2.9.0

August 7, 2024

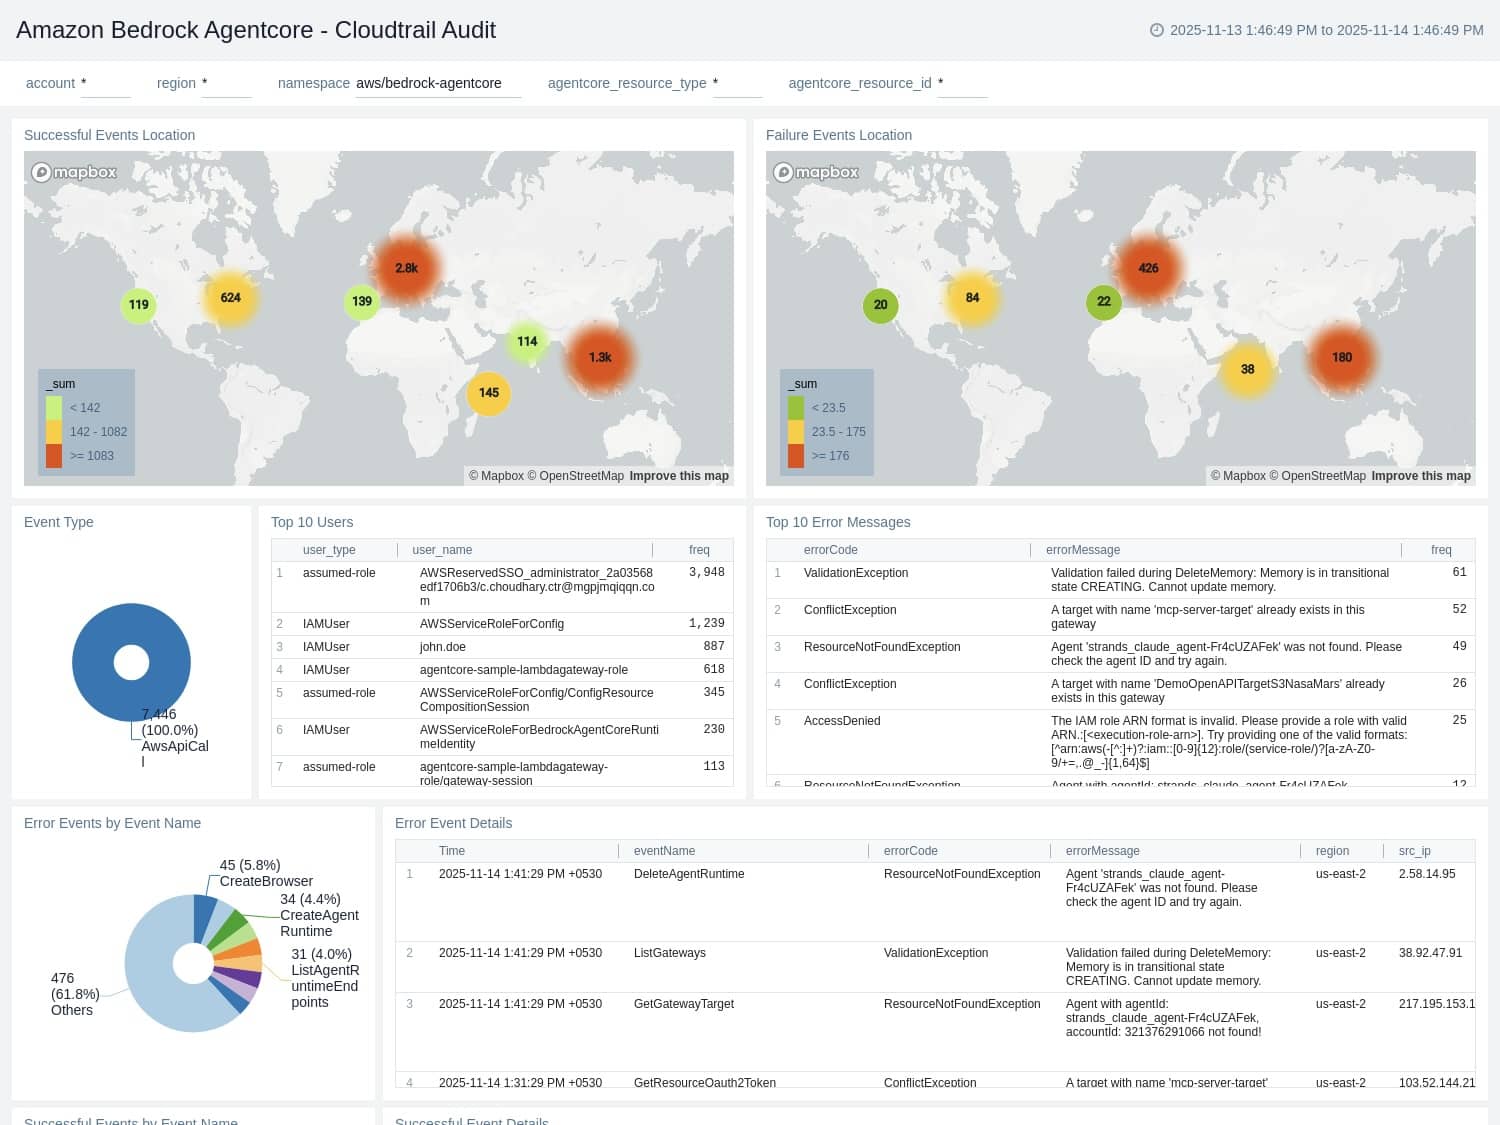
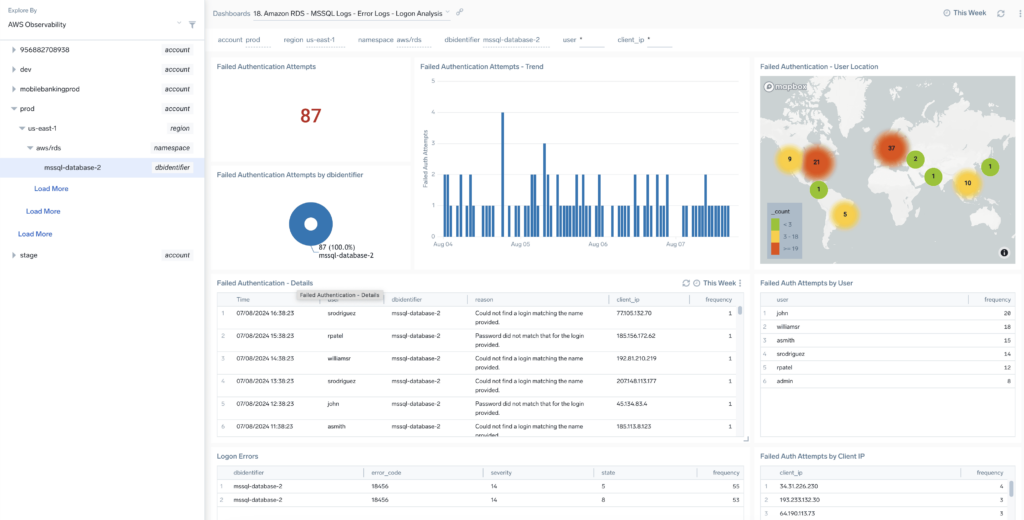
We're excited to unveil AWS Observability 2.9.0, now featuring support to analyze and monitor RDS MS SQL CloudWatch logs, with new monitors bringing the total to 70 out-of-the-box monitors. This release also includes automatic CloudFormation deployment telemetry to Sumo Logic (with an opt-out option) as well as brings reduced installation time via the CloudFormation template. 

AWS Observability v2.9.0

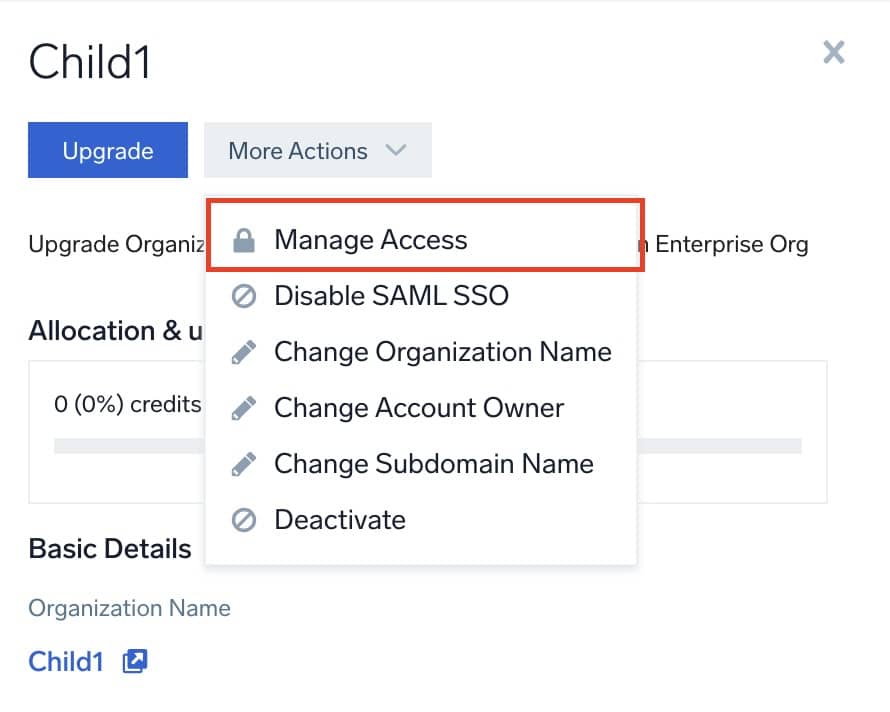
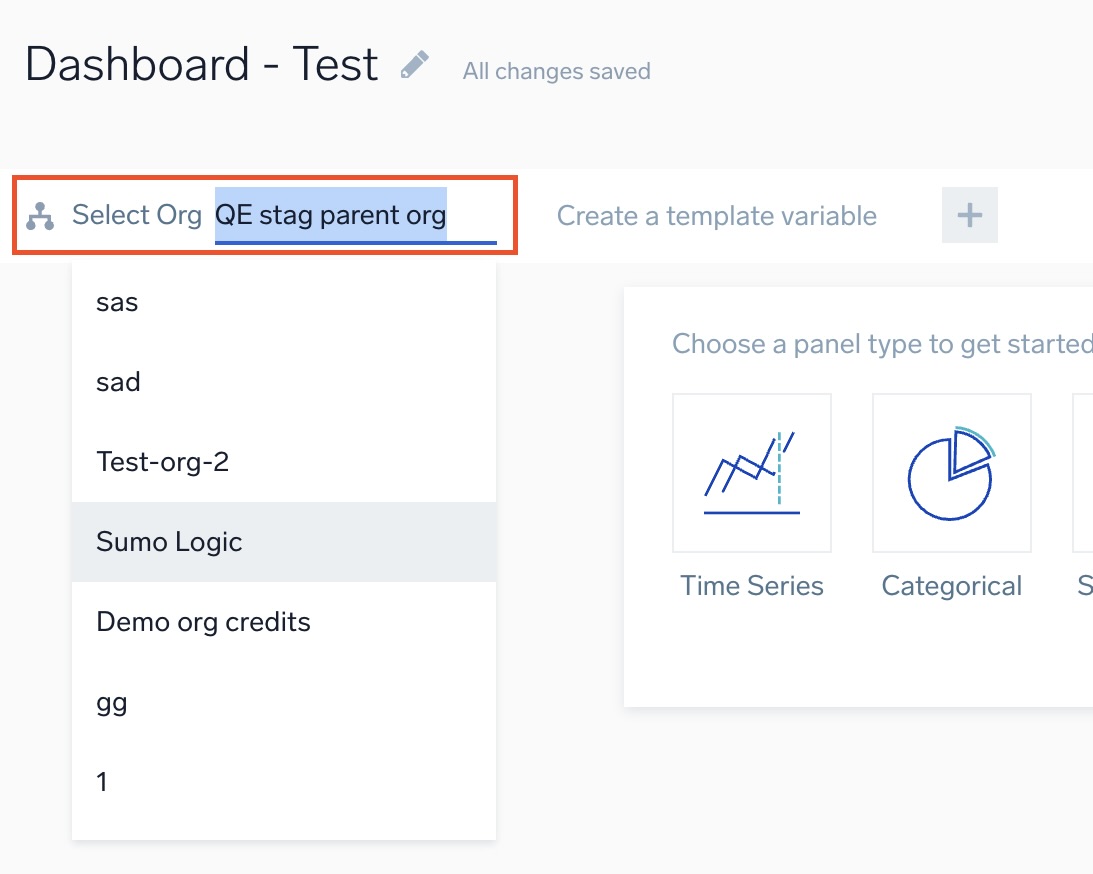
Sumo Orgs - New credits management experience

July 26, 2024

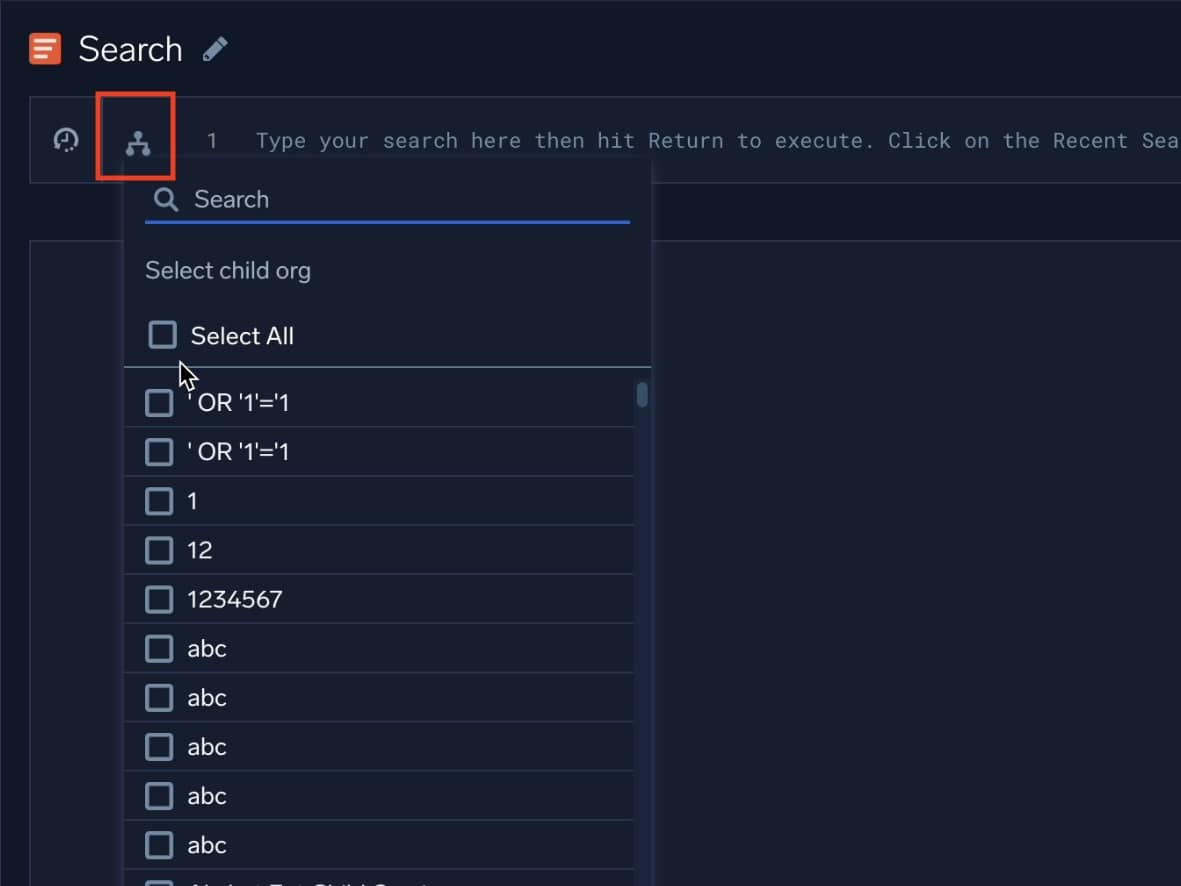
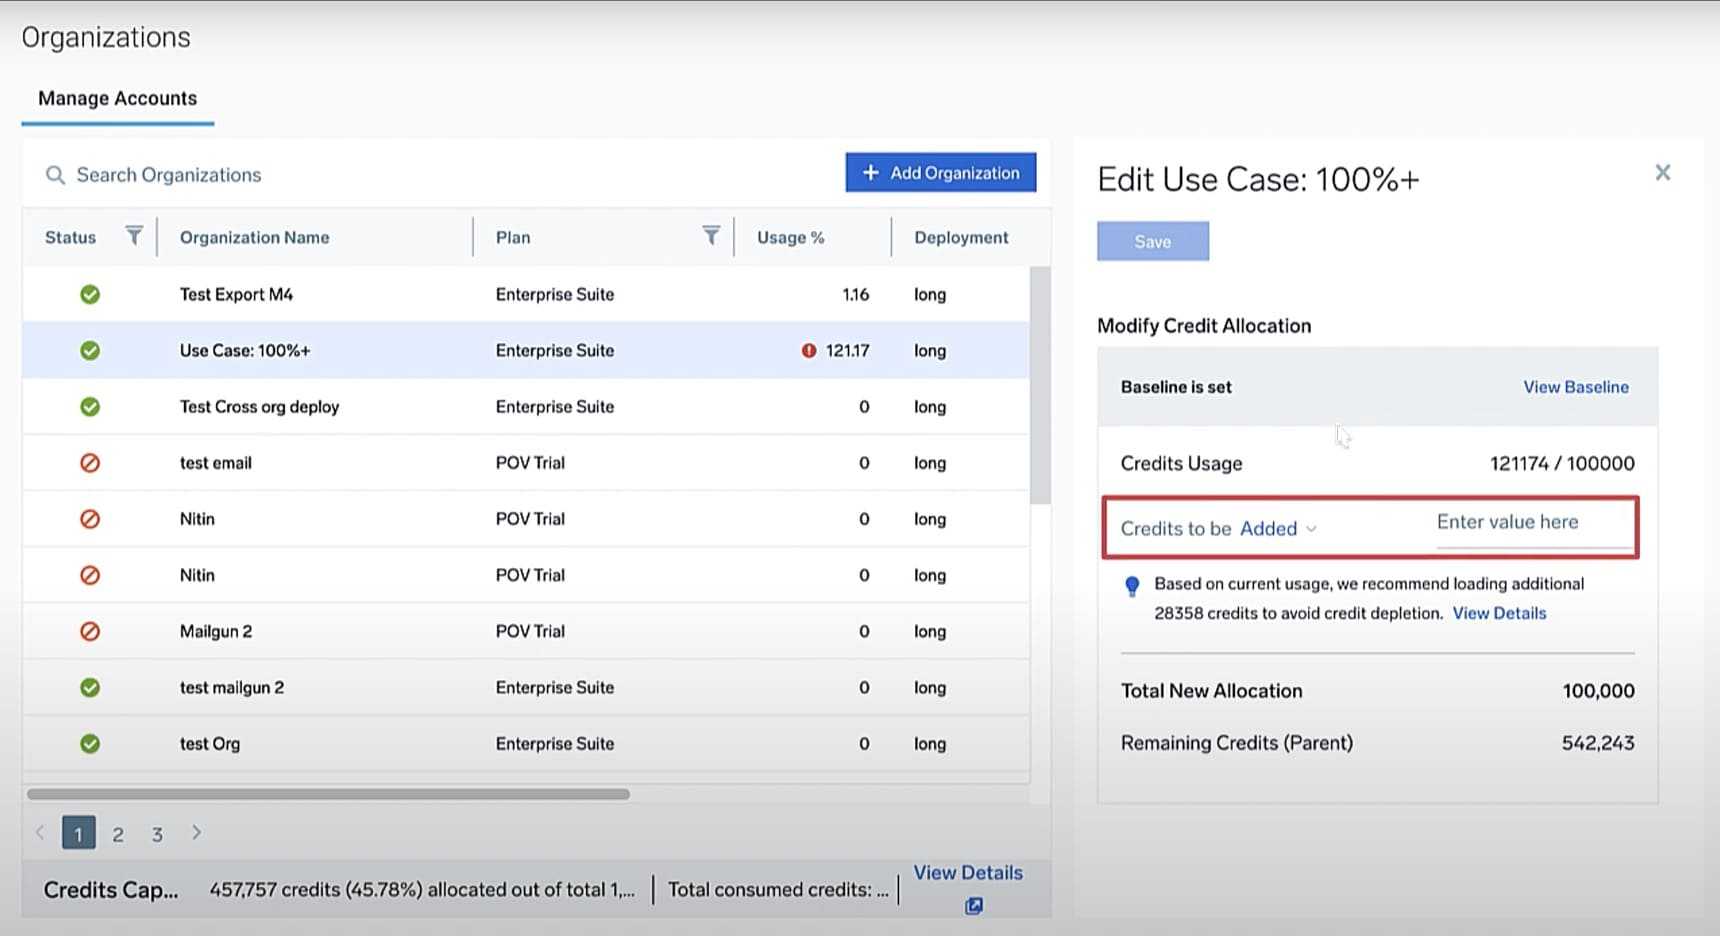
We are excited to introduce a new and enhanced credits management experience for our Sumo Logic orgs customers. This update empowers Sumo Logic parent org admins to manage child org credits with greater ease and control. Here are the key improvements in this update:

  • Flexible allocation. Parent org admins can now allocate and manage credits for child orgs more flexibly, with faster and fewer steps.
  • Smart recommendations. Receive system-suggested credit allocations tailored to your needs.
  • Effortless top-ups. Seamlessly top-up credits for child orgs upon depletion without needing baseline adjustments.
Sumo Orgs - New credits management experience

Discover the new features in AWS Observability

July 10, 2024

We are thrilled to introduce AWS Observability 2.8, featuring new out-of-the-box dashboards for PostgreSQL based on Amazon RDS logs, a redesigned Amazon API Gateway with enhanced metrics and log-based dashboards for REST, HTTP, and WebSocket API types, over 20 new out-of-the-box monitors, and significant improvements in deployment time to streamline your monitoring experience on AWS.

Discover the new features in AWS Observability

Collect logs from Azure at Scale

March 28, 2024

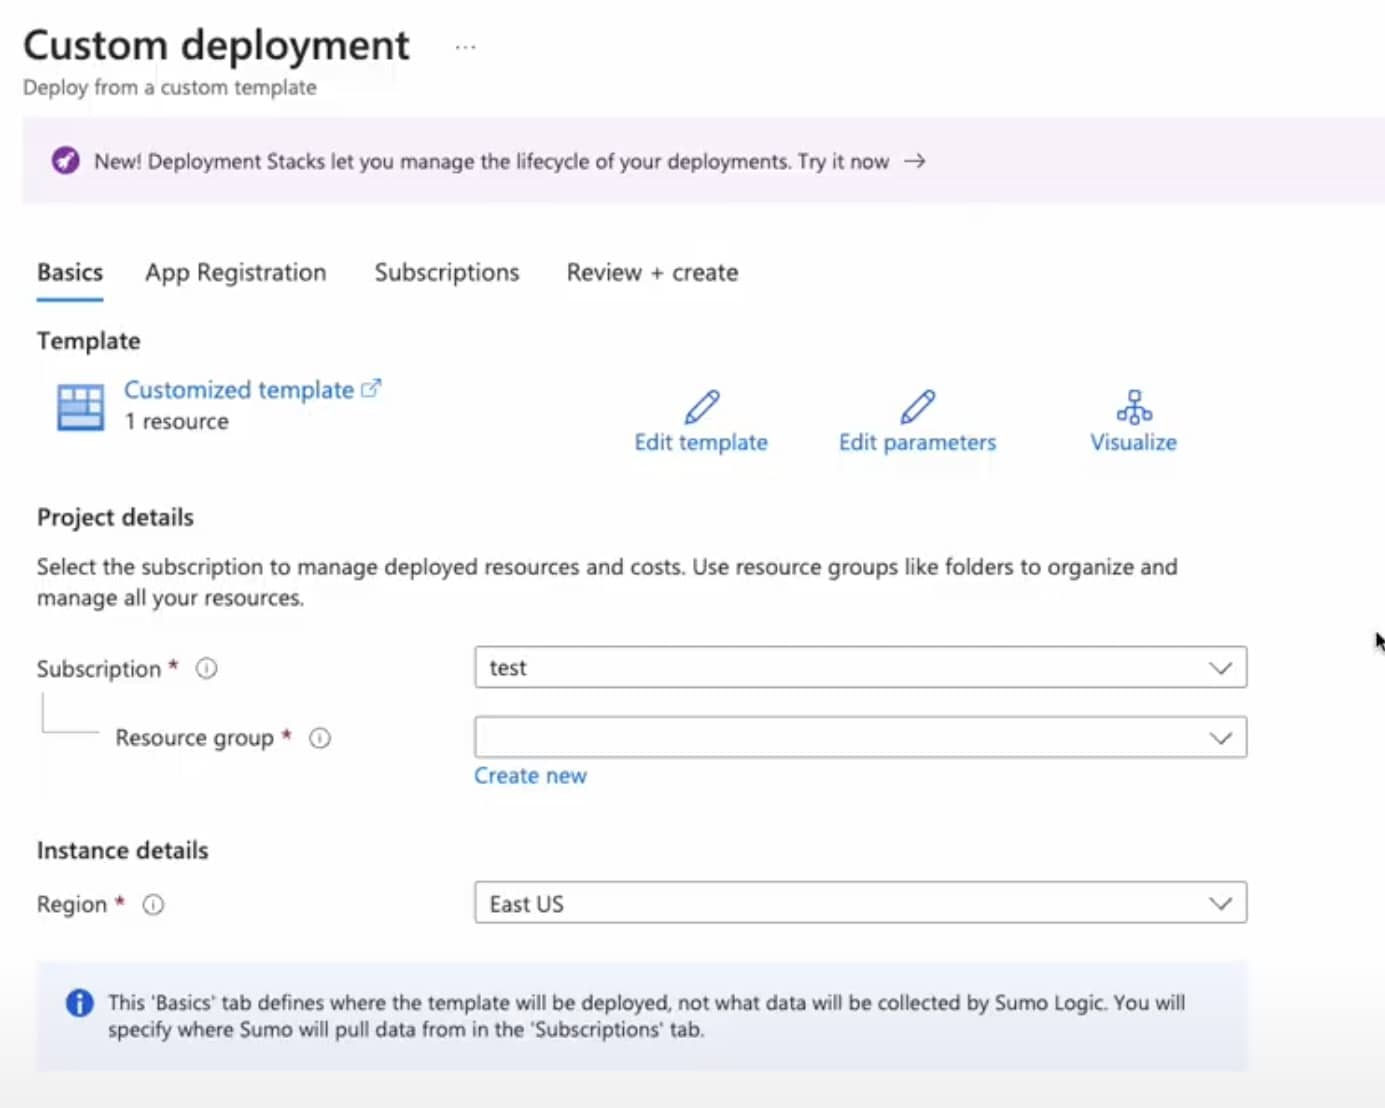
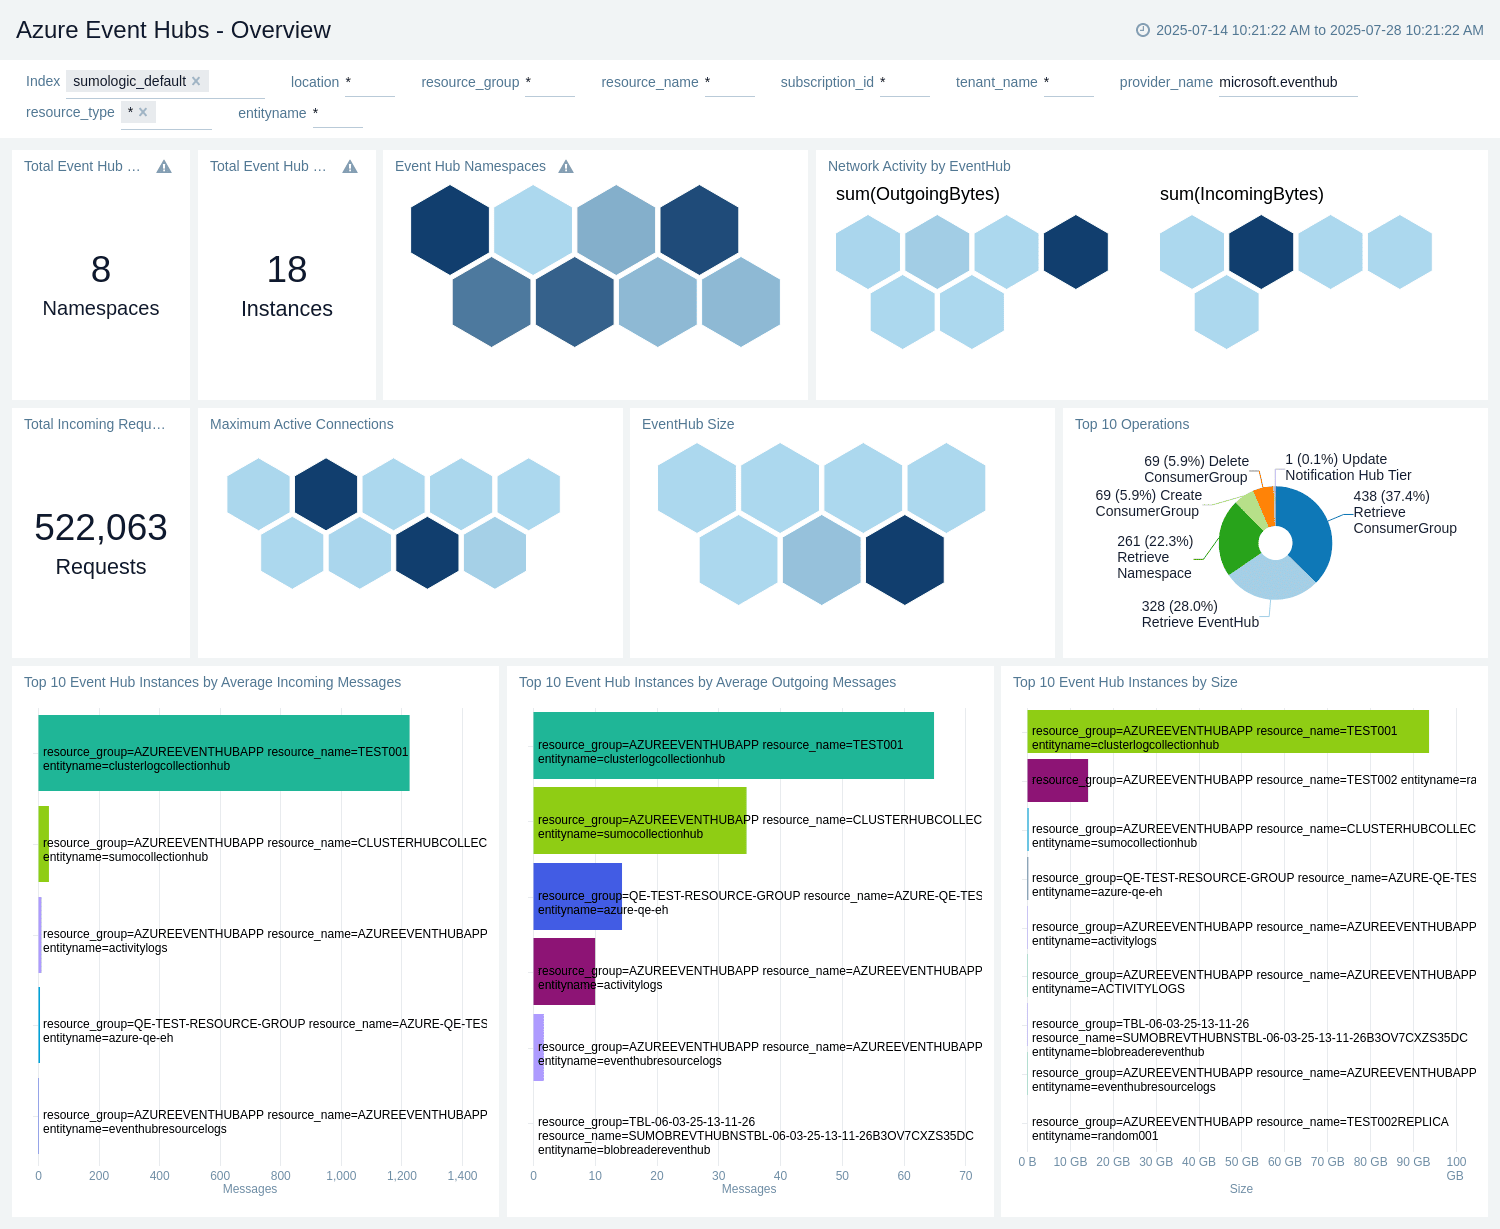
Collecting data at scale is in Sumo Logic DNA and we are extending that to collecting data from Azure. Our integration with Azure Event hubs provides our customers a fully managed, scalable, and low latency solution to stream high volume logs from Azure to Sumo Logic.  With this new source you can monitor high volume  logs like endpoint , audit and load balancers with low latency and alert on findings in near real time. 

Collect logs from Azure at Scale

AI-driven alerts

March 12, 2024

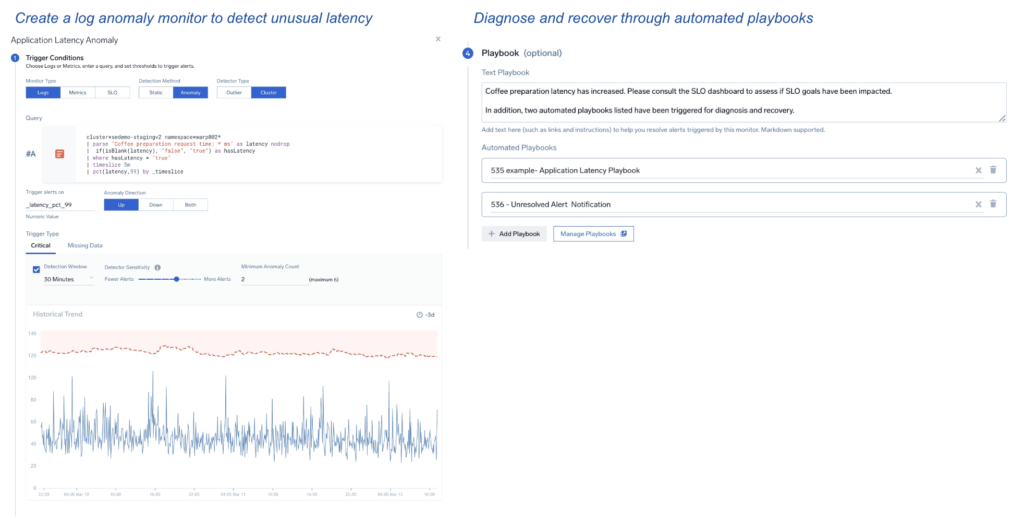
We are excited to announce AI-driven alerts. This innovation combines patent-pending anomaly detection to monitor unusual application / security conditions in logs, alert a first responder and help them diagnose and recover quickly through automated playbooks.

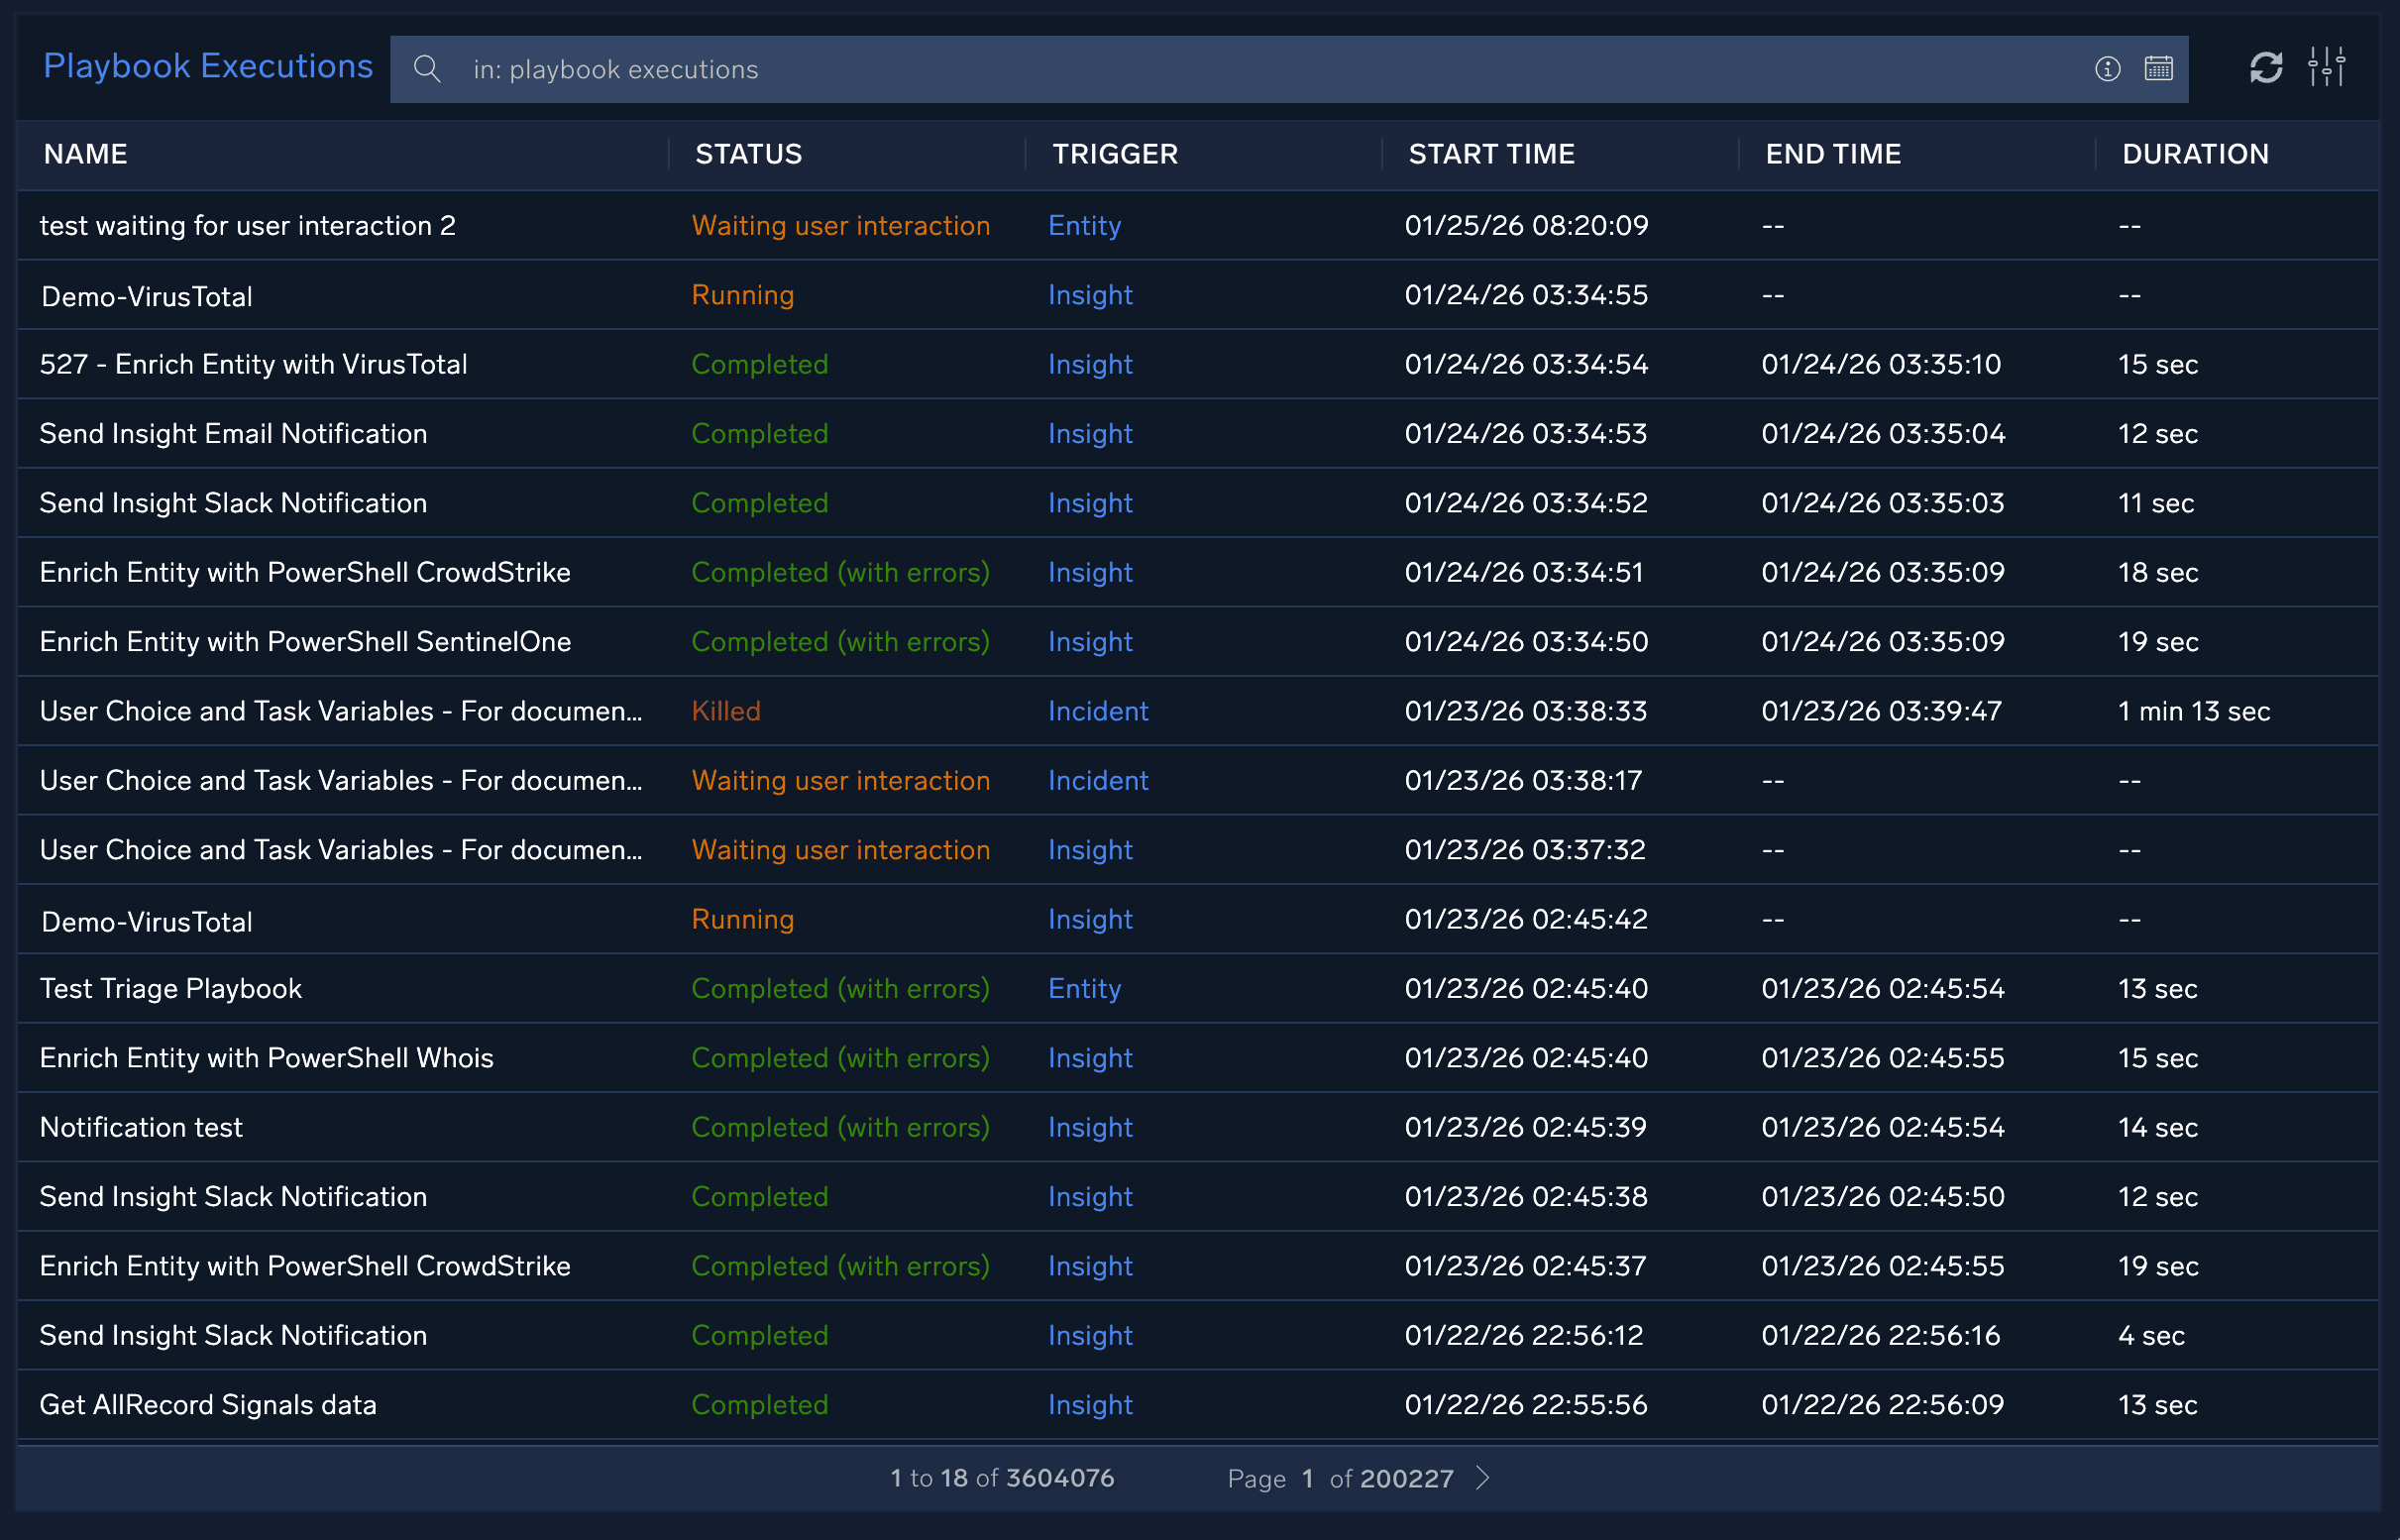
Anomaly monitors help focus customer attention on real incidents and minimize distraction from false alarms. Playbooks powered by Sumo Logic Automation Service can be triggered by such alerts to accelerate incident diagnosis and recovery. AI-driven alerts also feature one-click set up to connect anomaly monitors to one or more playbooks. Moreover, first responders can view playbook execution within the Alert Response page itself. 

AI-driven alerts

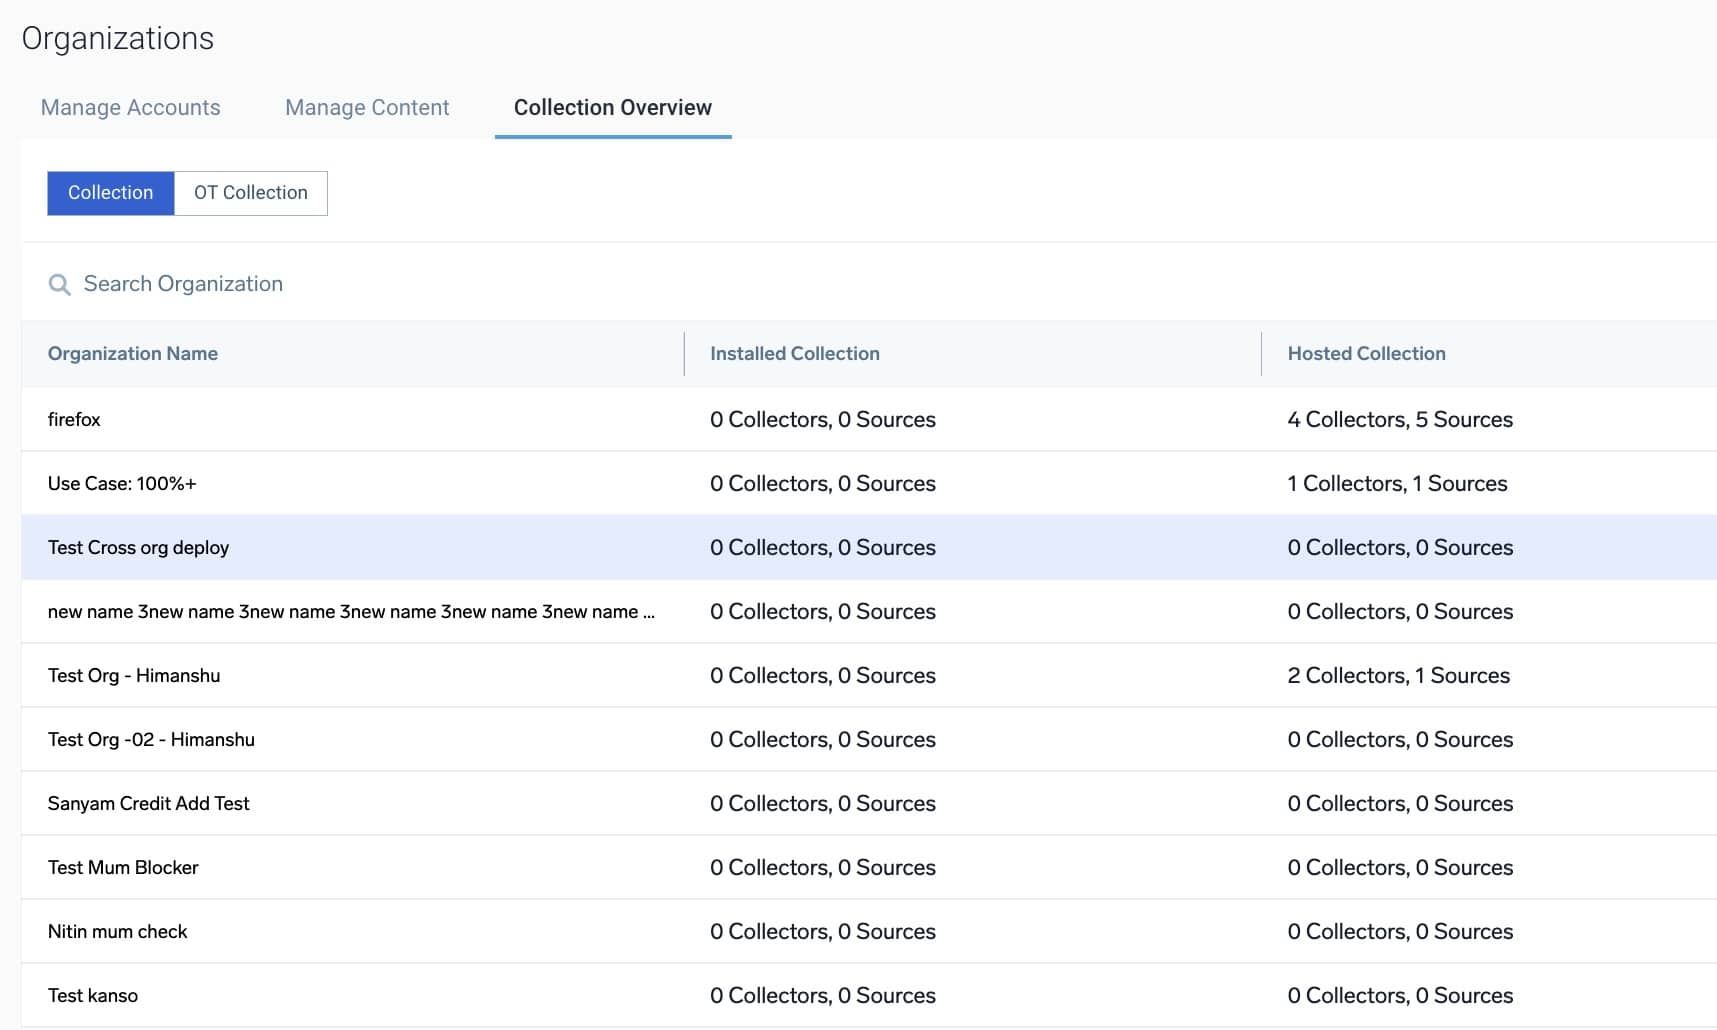
Sumo Orgs: New View for Child Orgs Usages

February 1, 2024

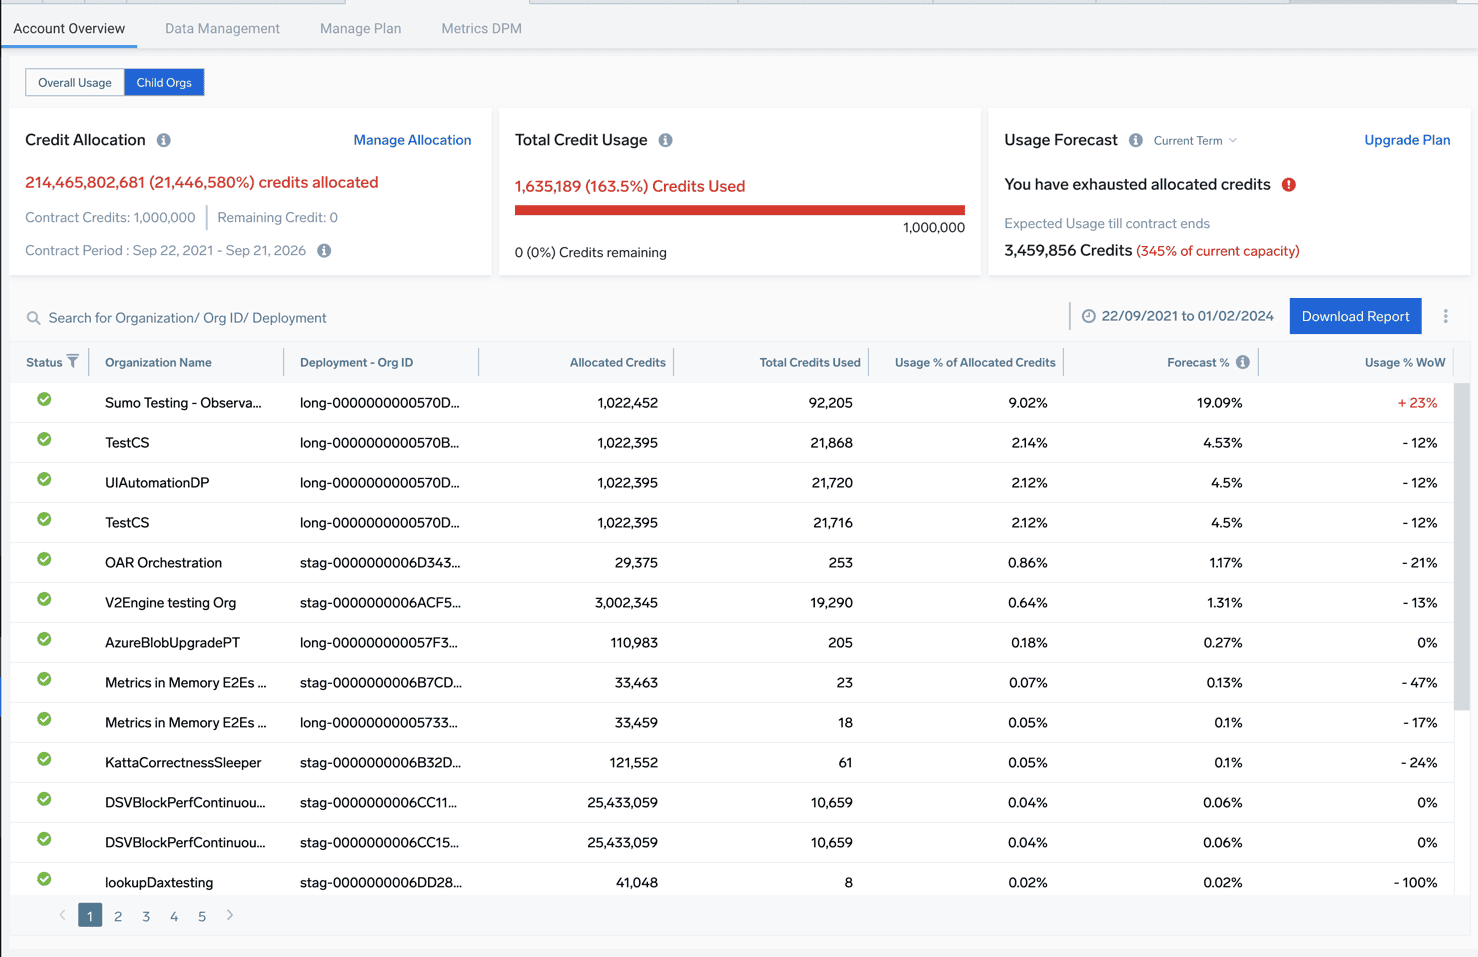
We're excited to announce a powerful upgrade for Sumo Orgs customers: a centralized view of all child org usage within your accounts page! This update streamlines your experience and empowers you to manage your multi-org environment with greater efficiency. Now you can:

  • Consolidated Insights: Gain a comprehensive overview of child org credit consumption and usage trends, all in one place. 
  • Dive deeper: Drill down effortlessly for granular insights into individual child orgs, identifying areas for optimization.
  • Stay informed: Export detailed usage data for any timeframe, empowering informed decision-making.

Sumo Orgs: New View for Child Orgs Usages

Cloud Infrastructure Security for AWS

January 24, 2024

We are thrilled to announce the availability of Cloud Infrastructure Security for AWS, a Sumo Logic product offering that allows Cloud Operations, Security Engineers and developers to get a comprehensive view of threats, misconfigurations and suspicious activity in their AWS environment and take remedial steps through automated playbooks.

Cloud Infrastructure Security for AWS

Auto-Discovery for OpenTelemetry Collectors

December 18, 2023

With the Sumo Logic OpenTelemetry collector Auto Discovery feature, you can detect, monitor, and observe services that are installed on the server on which the collector is running. Once the services are discovered, you can evaluate the information on Sumo Logic platform and proceed with the onboarding of applications.

Auto-Discovery for OpenTelemetry Collectors

Logs for Monitoring and Troubleshooting for AWS (Observability) Improvements

November 28, 2023

We are excited to announce several improvements to our AWS Observability solution.

  • AWS Observability Hub. A landing page to access all the capabilities of the Sumo Logic AWS Observability solution, including the out-of-the-box dashboards, alerts, and performance benchmark reports, all from a single place.
  • Log Searches for Troubleshooting. Quickly troubleshoot issues within your AWS environment with pre-baked log searches. No need to learn the search query syntax. These new searches can be accessed from the new hub page.

NOTE: To access these new capabilities, you just have to install the AWS Observability solution. If you have one already installed, congratulations! You'll gain access to these new features automatically.

Logs for Monitoring and Troubleshooting for AWS (Observability) Improvements

Log Message Inspector

November 9, 2023

We're excited to announce the availability of Log Message Inspector. With this feature, users as part of their troubleshooting sessions based on the results to a particular query, can now select a specific message and inspect the message in detail by viewing all the parameter fields and their values.  

Log Message Inspector

Kubernetes Unified Collection using OpenTelemetry

November 2, 2023

Helm chart V4 will enable customers to package, configure, and deploy applications and services on Kubernetes clusters with OpenTelemetry as a default to collect all telemetry data. Removing reliance on third-party solutions such as Fluentd, Fluentbit, and Prometheus simplifies and lowers the cost of administering several softwares. OpenTelemetry collectors have been proven to better reliable, scalable and performant than previous solutions.

Kubernetes Unified Collection using OpenTelemetry

MITRE ATT&CK® Threat Coverage Explorer

October 23, 2023

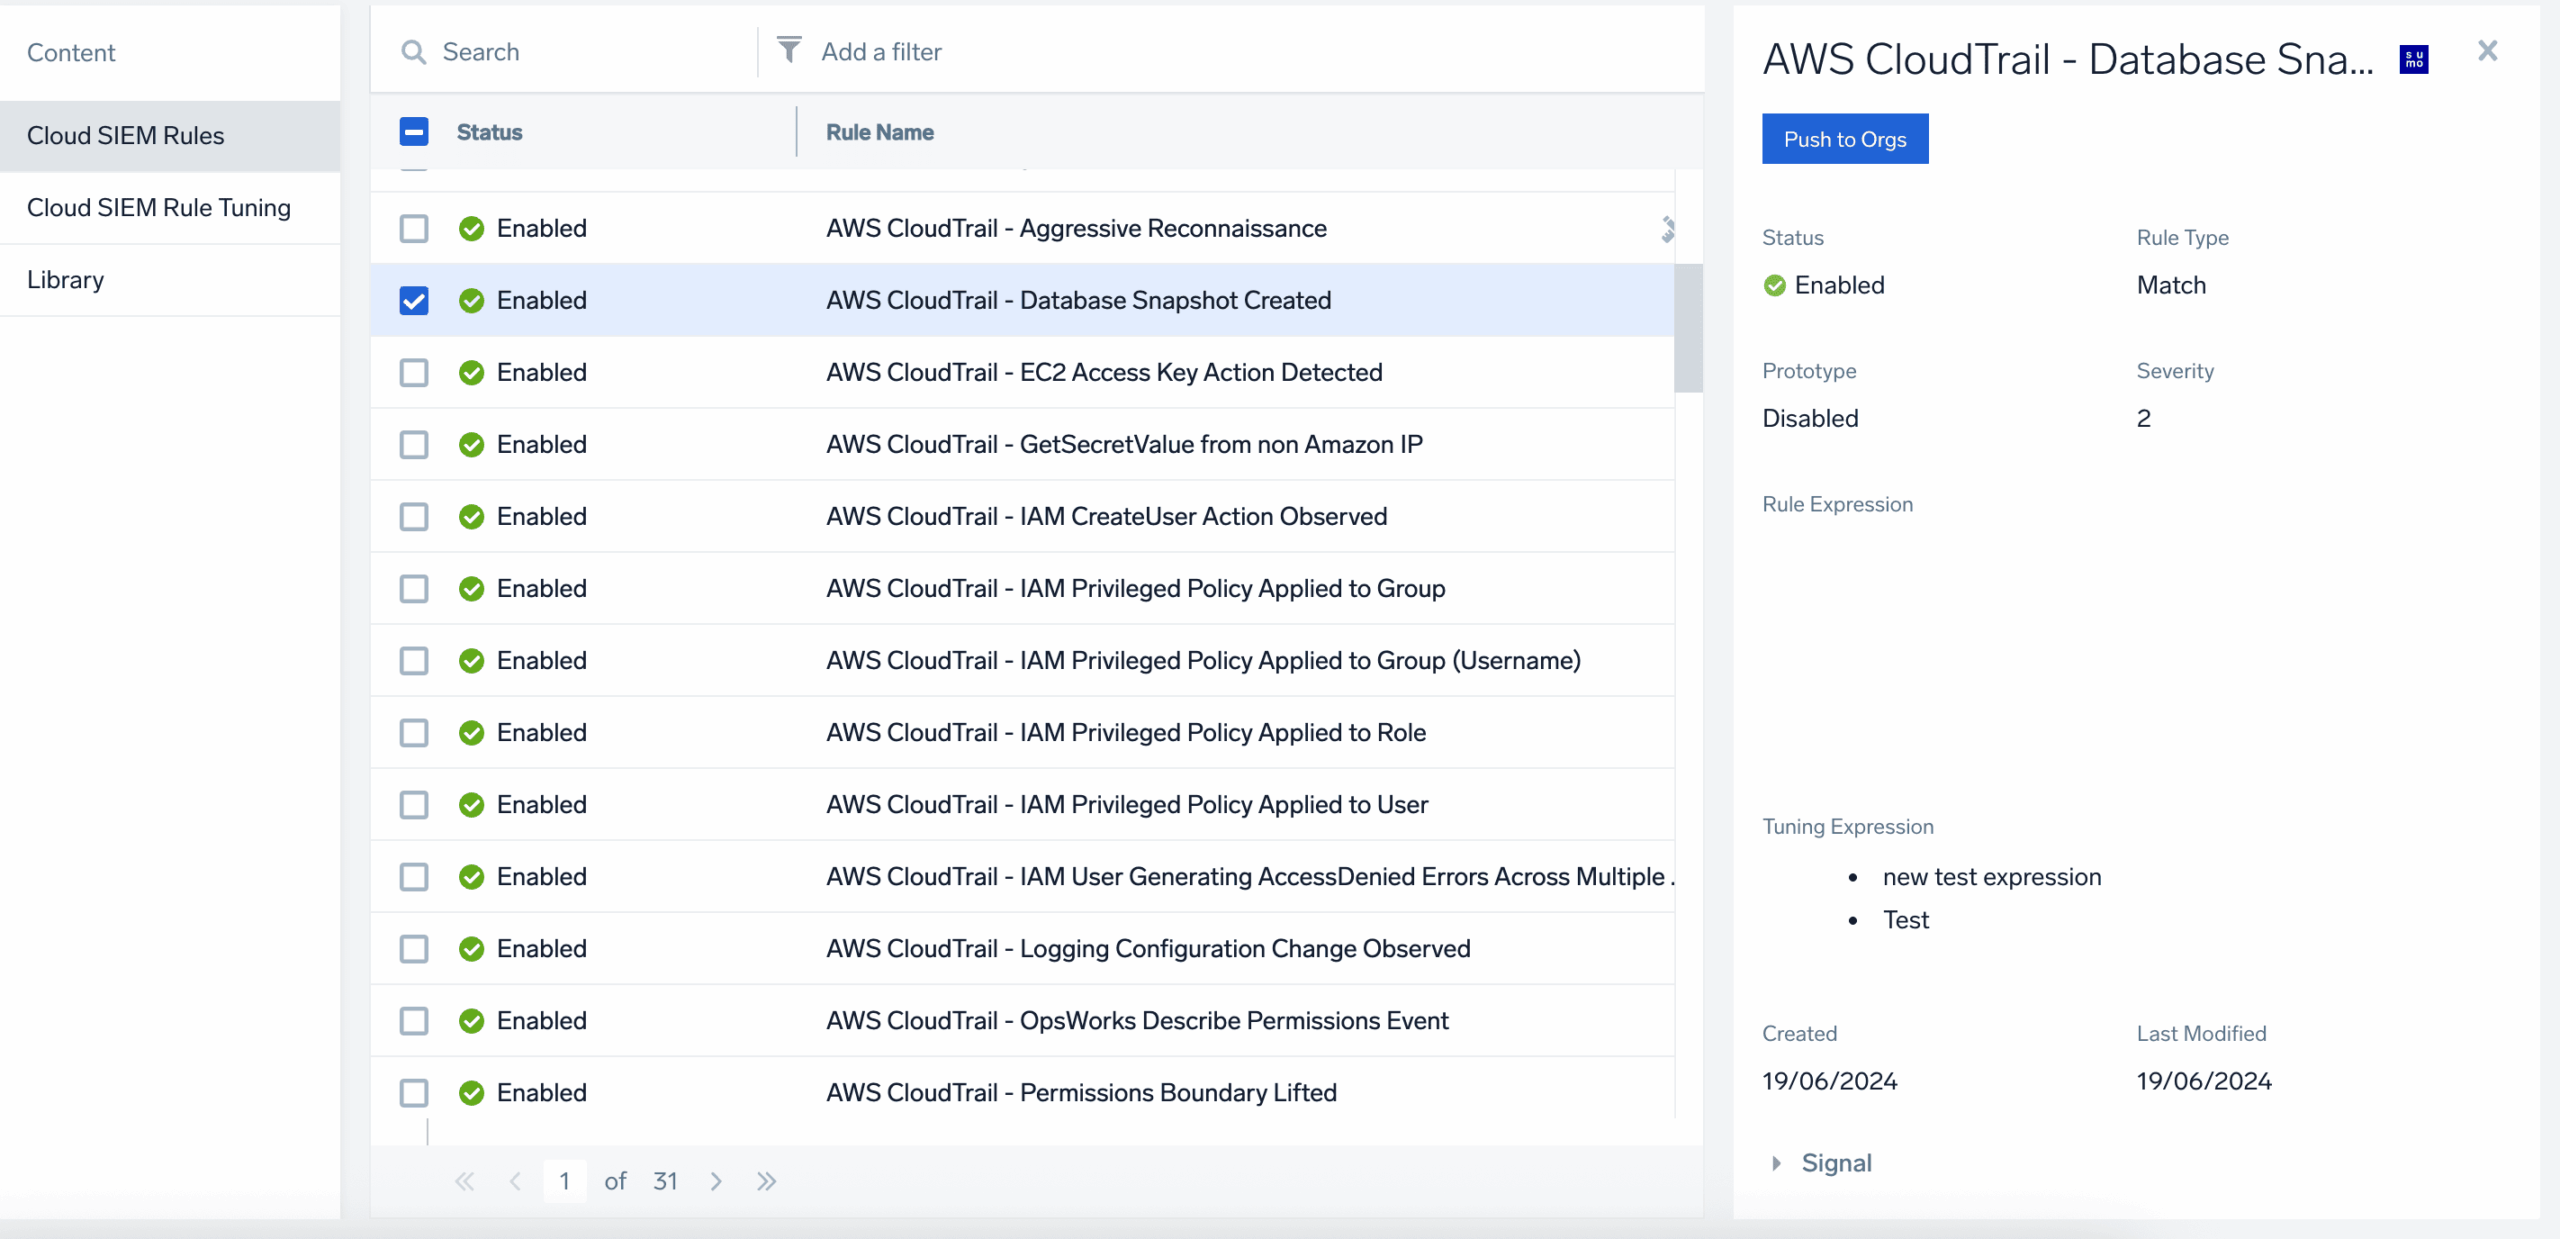
We are excited to announce a new feature in Cloud SIEM, the MITRE ATT&CK® Threat Coverage Explorer. This interactive tool gives you the ability to see how Rules, Signals, and log sources map to adversary actions using the MITRE ATT&CK® Matrix for Enterprise.

The MITRE Explorer can be used to identify gaps in coverage and understand the impact of specific log sources and Rules to the overall threat coverage and value of Cloud SIEM. It includes a view based on theoretical coverage for all rules, including the market-leading out-of-the-box content provided by Sumo Logic, plus your custom rules. You can also view your recent activity and compare it to the activity of all other Cloud SIEM customers. The view is filterable by tactic, technique, and sub-technique, as well as log source and coverage level. There are multiple options so the display can be customized, and the data can be exported in MITRE's JSON format so it can be combined with data from other tools to view your total coverage. 

MITRE ATT&CK® Threat Coverage Explorer

Operator support in metrics-based SLOs

August 22, 2023

You can now use metrics operators in SLO queries. The metrics query specified in your SLO should have a quantization specified after the selector. You can specify one or more operators in the query for SLO.

Operator support in metrics-based SLOs

Muting Schedules for Alerts

August 7, 2023

During system maintenance windows or during off hours, customers may want to suppress notifications from monitors in a triggered state. With Muting Schedules for Alerts, customers can set up a schedule during which alert notifications for one or more monitors are suppressed. Muting schedules can support daily, weekly or monthly recurrence. When a monitor is triggered during a muting period, the Monitors List and Monitor details view depict the muted status of the monitor.

Muting Schedules for Alerts

Saved Filter Views for SLOs

July 25, 2023

We've added the ability to save views for SLOs, allowing you to create views using filters on SLOs list page and customize your SLO insights experience based on your preferences and focus on the SLOs you care about most.

Saved Filter Views for SLOs

Sumo Logic keeps you protected with ready-made security content

July 12, 2023

At Sumo Logic, we are committed to continuously providing our customers with new and updated applications and integrations to allow for easy and accessible data collection and powerful visualization from various sources no matter where it is. Over the past quarter, the Sumo team has been hard at work crafting cloud-to-cloud connectors for sources including a generic Google BigQuery cloud-to-cloud connector that enables you to set up an incremental pull to bring any data in BigQuery into Sumo Logic. For instance, this is now the standard for ingesting Gmail logs. The team has also created applications to further help customers better analyze data from tools such as Cisco Meraki.

With a total of 13 new cloud-to-cloud connectors and 14 new security apps, providing out of box queries and visualizations, Sumo Logic helps users gain the most insight out of their data.

Sumo Logic keeps you protected with ready-made security content

Automatic log level detection for log messages

July 11, 2023

We're excited to announce automatic log level detection for Log Search queries. You can now quickly identify anomalies without having to search through large volume of logs to find high severity issues.

With this update, you can now visualize and filter log-level distribution in both your Histogram results and Messages table on log search page. This allows you to view messages of specific log level(s) in the same view.

Automatic log level detection for log messages

Outlier Rules in Cloud SIEM Enterprise

June 21, 2023

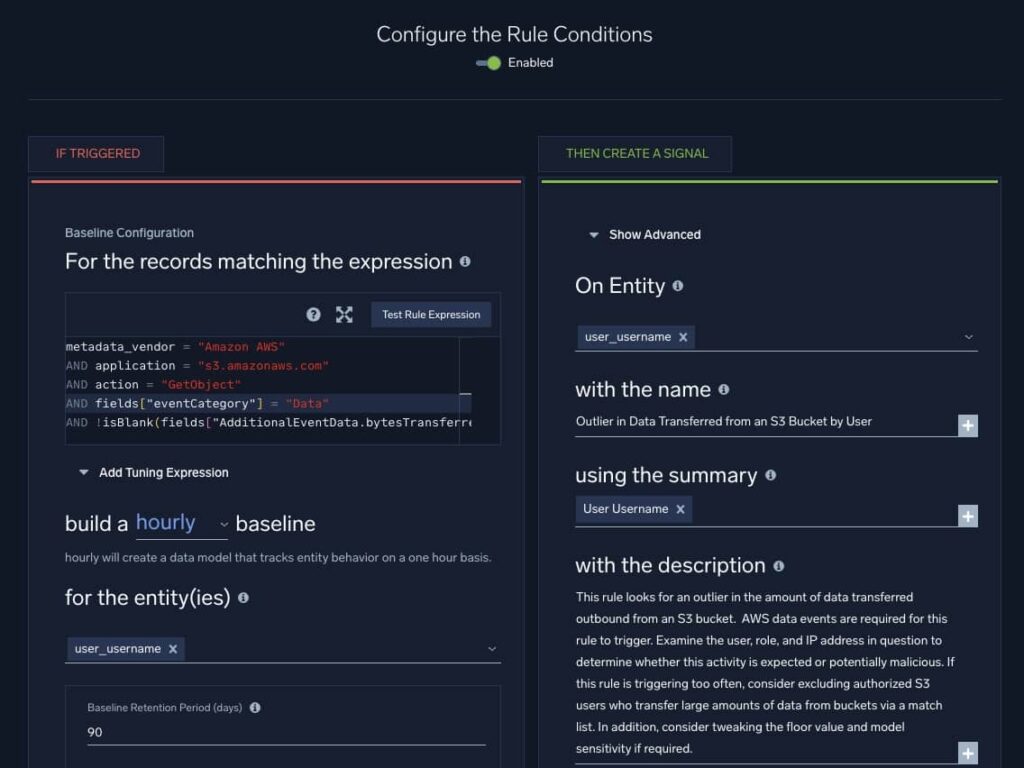
Sumo Logic is pleased to announce a new rule type for Cloud SIEM Enterprise (CSE): Outlier Rules. This new rule type further enhances CSE’s User and Entity Behavioral Analytics (UEBA) capabilities. With these rules, CSE can detect events that deviate from the usual behavior of an Entity, such as a spike in login failures from a user, without having to define a static threshold. Once the rule is set, CSE automatically builds a normal behavior baseline for each Entity based on the rule expression. It creates a signal only when a deviation from normal behavior is detected (in this case, too many login failures compared to their normal baseline behavior). Other examples include detecting a spike in Windows administrative privileges granted and a spike in AWS calls from a user.


Outlier Rules in Cloud SIEM Enterprise

Amazon Security Lake Integration

June 5, 2023

Amazon Security Lake automatically centralizes an organization’s security data from cloud, on-premises, and custom sources into a purpose-built data lake stored in a customer’s account. With the new Sumo Logic source our customers can ingests data from Amazon Security Lake and provides broad visibility across all AWS, on-premise, and hybrid cloud environments. Sumo Logic gives security teams cloud-native detection, investigation, and response capabilities purpose-built to modernize security operations.

Amazon Security Lake Integration

Schedule and share dashboards over email

May 23, 2023

Organizations are increasingly relying on data analytics to make informed decisions. With this in mind, we are pleased to introduce a new feature that allows you to deliver Sumo Logic dashboards as PDF or PNG files over email, directly to the hands of decision makers. Set up a recurring Scheduled Report to keep an audit record of your data while also saving time by having the data delivered directly to your inbox.

Schedule and share dashboards over email

Data visualization now supports Sankey Charts & Box plots

May 23, 2023

Sumo Logic Dashboards' visualization is constantly expanding to help you uncover deeper insights. Our most recent additions include Sankey charts, which allow you to visualize complex data flows and gain a better understanding of the relationships between different variables. We've also added Box plots, a powerful tool for visualizing statistical data that makes it simple to identify outliers and understand data distribution. With these new options, you'll have even more ways to make sense of your data and make informed business decisions.

Data visualization now supports Sankey Charts & Box plots

Zoom source with Token Validation

May 16, 2023

Sumo logic is releasing new Zoom source for hosted collection, which allows you to monitor Meeting, Webinar, Recording, Zoom Room, User and Account Events. This new source is made available as a result of Zoom's new token validation requirement.

Zoom source with Token Validation

More insights to your AWS infrastructure

May 16, 2023

We're excited to announce the release of AWS Observability 2.6.0. Here are some of the features the new version offers:

Support for Amazon SQS. We've added new out-of-the-box dashboards and predefined monitors to provide important information about queue and message statistics.

AWS Lambda dashboards have been updated to include Lambda Telemetry API metrics for improved observability.

Entity Inspector KPIs were added to help users gain better visibility into their entities.

Out-of-the-box monitors enhanced with evaluation delay for improved accuracy and deviation detection.

AWS Observability Lambda functions updated to use the latest available Node.js runtime environment.

For more information on updating the AWS Observability to the latest version, see Update AWS Observability Stack.

More insights to your AWS infrastructure

Cloud SIEM Automation Service with Threat Indicators

May 16, 2023

Sumo Logic is excited to announce a new feature that integrates functionality previously available only in our Cloud SOAR solution directly into Cloud SIEM. This new feature, the Automation Service, allows you to fully automate playbooks with actions like enrichments and notifications, enabling security analysts to address potential security threats faster and more accurately.

The Automation Service includes the Sumo Logic Open Integration Framework, which makes it easy to connect Cloud SIEM with practically any external application. The OIF comes with over 350 integrations out of the box, with systems like AWS, Recorded Future, Jira, Slack, and ChatGPT. Each integration includes a number of specific actions that can automatically perform tasks like looking up an IP address in a threat intelligence list or opening a ticket. In addition, you can easily create or modify custom integrations or actions as well, and they can run tasks both on-premises and in the cloud. And Sumo Logic is adding new integrations all the time, so if you need one that’s not already there, just ask.

Actions can be connected together in playbooks, and dozens of playbooks are included out of the box. Some are simple (such as performing an enrichment and attaching that data to an Insight or Entity) but they can include complex logic and workflows to carry out virtually any automated task. Playbooks can be automatically executed based on triggers within Cloud SIEM (such as when an Insight is created) or they can be executed manually.

You can get value from this feature almost instantly - just add connection information (such as an API key) to the integrations, use the built-in playbooks, and go. If you want to build custom actions and custom playbooks, you can do that with a minimal amount of effort - dedicated resources are not needed. And if you decide you want to upgrade to the full capabilities of Cloud SOAR in the future, Cloud SIEM will automatically connect to Cloud SOAR for automations and all of your content will remain available without an arduous migration process.

Finally, in conjunction with this new feature, the Cloud SIEM user interface has been enhanced to persist threat indicators outside of Insights and display visual indications when an Entity might be suspicious or malicious. Through this feature, security analysts can quickly see when an Entity involved in a potential security threat may already be known to the system without having to manually investigate. The enrichment actions delivered with the Automation Service automatically set these indicators.

Through these new features, Cloud SIEM customers who don’t need the full power of a SOAR solution can still achieve significant increases in efficiency and accuracy through automation - at no additional cost.

Cloud SIEM Automation Service with Threat Indicators

Enhanced Trace Query aggregation charts

May 10, 2023

Aggregating traces provides a lot of insights into anomalies and unexpected behaviours of the application, providing faster TTR and higher ROI. We are adding 5 new aggregation charts next to existing Trace duration breakdown in Traces (Query) screen by introducing two new drop-down choices to select from: duration/errors/spans (per trace) on one and time-series/histogram on another. 

That gives total 6 charts (5 new) to better understand the profile of your traces grouped under Trace Query Visualisations panel. 

Note: for best results, first filter your tracing data to represent transactions of similar nature (e.g. login transaction or check-out transaction).

Enhanced Trace Query aggregation charts

Precise percentiles aggregations on APM dashboards

May 10, 2023

Aggregating percentiles is tricky and requires access to raw data. We wanted to ensure we provide our customers best possible quality of data with acceptable performance. Therefore, we are introducing a new approach to calculating and aggregating percentiles, improving accuracy of measurements. Latency metrics now use this new mechanism and all dashboards have been upgraded to support new data. We also improved Application Details table with Service List dashboard panel - new useful visualisation for Services List released earlier.

Latency APM metrics on out of the box dashboards now use recently released metrics histograms and Service List panel is replacing existing time-series table in Application Details panel. Top bar selector for latency type is renamed to latency_type and is automatically driving all latency percentile metrics in all panels that support pct metrics.

Precise percentiles aggregations on APM dashboards

Cloud SIEM Insight Trainer

May 9, 2023

We are excited to announce the release of Cloud SIEM Insight Trainer, a dashboard packaged with the Enterprise Audit - Cloud SIEM App. Most security teams spend several hours every week tuning their SIEM to improve detections and focus SOC analyst attention on the most serious threats. The Insight Trainer utilizes machine learning to provide Rule tuning recommendations and severity adjustments to significantly reduce the burden of manual tuning. Insight Trainer learns rule severity adjustments from your Insights history to reduce the False Positive, and optionally, No Action insights.

Cloud SIEM Insight Trainer

New onboarding workflow powered by Open Telemetry.

April 30, 2023

New - We’re happy to announce a release that saves you configuration time. Our new and improved OpenTelemetry collector data onboarding workflow that gets you up and running with infrastructure monitoring in minutes. With this update, you can start monitoring host and process data, web servers (like IIS, Nginx), databases (like MySQL, Redis, Cassandra), and other sources out of the box - no manual configuration required. This new workflow is only available for new Trial customers at this time.


New onboarding workflow powered by Open Telemetry.

Entity Relationship Graph in Cloud SIEM Enterprise

March 7, 2023

Sumo Logic is excited to announce a new feature in Cloud SIEM Enterprise (CSE) that gives Security Analysts a powerful new tool to quickly the larger context behind a potential security threat and to better understand which related Entities (users, hosts, and so on) are involved. The new Entity Relationship Graph provides a graphical visualization of all related Entities in an Insight, as well as additional relationships beyond the Insight.

The Entity Relationship Graph (and the Related Entities list) displays all Entities involved in the Insight (those referred to in a record in a Signal in the Insight) as well as additional Entity relationships (for example, if CSE detects an IP address may also have had a specific hostname at the time the Insight was generated).

However, unlike the Related Entities list, the graph can visualize additional Entity relationships that existed outside of the Insight during a specified time frame.

Both the list and this new graph are available on the Entities tab of the Insight details page in CSE.

Each node in the graph represents a single Entity. The graph also displays the relationship types and any Indicators. Hovering over an Entity will highlight it and all of its relationships to other Entities, and when an Entity is selected, details about the Entity are displayed so the user doesn't have to navigate away from the page to get more information.

Entity Relationship Graph in Cloud SIEM Enterprise

SLO Lookup Table

February 22, 2023

We've released SLO Lookup Table, which allow you to view metadata for all SLOs. The SLO Lookup Table is managed by Sumo Logic. By joining the Lookup Table with precomputed SLO(from _view = sumologic_slo_output), you can create custom analytics and related dashboards.

SLO Lookup Table

Open SLO dashboard in Log Search

February 22, 2023

You can now render the logic powering select SLO dashboard panels as a log search query. This allows you to to analyze your SLO data and add SLO panels into any other dashboard to correlate SLOs with application, service or infrastructure signals.

Open SLO dashboard in Log Search

Threshold-based SLOs with multiple metrics queries

February 22, 2023

We have added support for multiple metrics queries for threshold-based SLOs. This is particularly useful for SLIs that are derived from multiple time series' through arithmetic operations using joins. Multiple metrics queries can be defined from scratch in the SLO editor or in the Metrics Explorer and imported to the SLO editor via the Create an SLO menu option.

Threshold-based SLOs with multiple metrics queries

Monitor based SLOs

February 22, 2023

Monitors that alert you to service interruptions impacting customers are great candidates to convert to Service-Level Objectives (SLOs). We've made this easy: you can now create SLOs directly from your Monitors in just a couple of clicks. The thresholds defined in your Monitor will carry over automatically to your new SLO definition, saving you time and effort.

Monitor based SLOs

First Seen Rules in Cloud SIEM Enterprise

February 22, 2023

Sumo Logic is pleased to announce new features in Cloud SIEM Enterprise (CSE) that deliver enhanced User and Entity Behavioral Analytics (UEBA) capabilities. These new capabilities enable additional methods to detect and investigate anomalous or unexpected behavior that may signify a security threat.

The first feature is called a First Seen Rule. With this new rule type, CSE can learn what normal and expected behavior looks like, so it can detect events such as "the first time a user logs in from a new location" without having to define specific rule expressions unique to each user in your environment (and the location(s) from which he or she usually logs in). Other examples include detecting the unusual granting of administrative privileges, Windows recon commands, AWS Secrets Manager API calls, API gateway enumeration, and more.

With this release CSE includes a set of more than twenty First Seen Rules out of the box, with more on the way. These Rules can be tuned and customized like any other rule type, and users can create custom First Seen Rules.

First Seen Rules in Cloud SIEM Enterprise

Entity Timeline for Cloud SIEM Enterprise

February 22, 2023

A new feature has been added to Cloud SIEM Enterprise designed to help security analysts investigate unusual activity with user accounts. The Entity Timeline visualizes all activity for an Entity (such as a user) in an easy-to-read timeline, eliminating the need to perform manual record searches.

Related actions are grouped together and Signals and Insights generated by that Entity are displayed with the relevant record(s). Actions can be selected to see more detailed information, and full details can be easily opened in a new tab.

Entity Timeline for Cloud SIEM Enterprise

OpenTelemetry Protocol(OTLP) support on HTTPS endpoints

February 19, 2023

OpenTelemetry Protocol is a general-purpose protocol used for encoding and delivery telemetry data from applications and infrastructure. OpenTelemetry client libraries default to sending data in OTLP format and OTLP/HTTP Source is an endpoint for receiving OTLP formatted Logs, Metrics, and Traces, thus providing a vendor-agnostic collection mechanism.

OpenTelemetry Protocol(OTLP) support on HTTPS endpoints

Collect Kubernetes Logs and events using Open Telemetry

January 23, 2023

Helm chart v3 will enable customers to package, configure, and deploy applications and services on Kubernetes clusters with OpenTelemetry as a default to collect logs and events. Removing dependencies from third party solutions like fluentd and fluentbit reduces complexity and cost of managing multiple softwares. Kubernetes Logs and events can be used to identify and diagnose problems, as well as to track changes and performance over time. The earlier Helm V2 version standardized the collecting of Kubernetes Traces on Open Telemetry.

Collect Kubernetes Logs and events using Open Telemetry

Customized alert recovery notifications

January 19, 2023

We've rolled out the ability to customize your alert recovery notifications. So when setting up Sumo Logic webhook connections, you can now design and test both your alert and recovery JSON payloads.

Currently supported for Slack, Microsoft Teams, AWS Lambda, Azure Functions, generic webhook, PagerDuty, OpsGenie, and ServiceNow.

Customized alert recovery notifications

Organise your APM services KPIs in an easy and clear view with Service List

January 19, 2023

We are proud to present new APM visualisation - Service List. Now you can get at-a-glance view of all your important KPIs for your application services in a simple to understand table. Instantly find underperforming services, find out what technology they are running and drill-down to more details.

Organise your APM services KPIs in an easy and clear view with Service List

Get a peek into future behaviour of your environment with new metrics predict operator

January 17, 2023

We are pleased to announce the general availability of Predict for Metrics, a new Advanced Analytics operator for the Sumo Logic Metrics query language. Predict helps you with planning capacity ahead of demand for bottleneck resources (such as CPU, Disk, Autoscalers) which is a key strategy to prevent incidents.

With Predict, developers and SRE teams can forecast time series' associated with such resources featuring:

  • Linear and auto-regressive forecast models
  • Ability to visualise goodness of fit of forecast to historical data
  • Ability to add predictions to dashboards


Get a peek into future behaviour of your environment with new metrics predict operator

The new Heat-map chart for the time series panel

December 2, 2022

The new Heat-map chart for the time series panel helps visualise value distribution in time. This chart type builds a bucket along the Y and X axis and then calculates the colour based on how many data points occur in the bucket. Heat-map provides quick insight into the data for each particular time quant and selected time range simultaneously. A practical example can be visualising the performance of a cluster.

The new Heat-map chart for the time series panel

Create funnel charts with new metrics explore charting visualisation

December 1, 2022

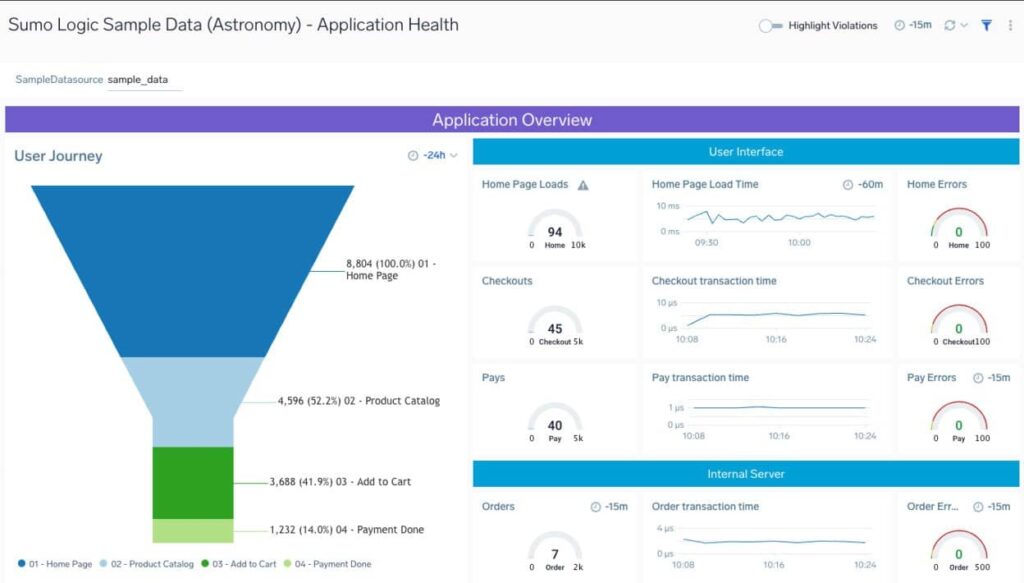
Funnel chart can be used to visualise the flow of specific data through a process. The chart takes its name from its shape, which starts from a broad head and ends in a narrow neck. The number of datapoints at each stage of the process are indicated from the funnel’s width as it narrows.

Create funnel charts with new metrics explore charting visualisation

Easily find your recently used Metrics queries

December 1, 2022

Metrics Query History extends Metrics Explorer with a list of previously executed metric queries and ability to easily re-run them by selecting from the list.

Just click on a clock icon and see a drop-down list of 50 recently run queries executed both from Metrics Explorer and from Dashboard panel. To execute a previous query - simply click on it.

We have also added a new panel on the homepage where users can quickly navigate through the list of recently run metric queries. Selecting a query from this list will open a new tab with this query being executed.

Easily find your recently used Metrics queries

Alert Subscription

November 17, 2022

You can now customize the alerts on your Alerts list that display the ones related to your team, by subscribing to your team's monitors.

Alert Subscription

Compare health of your applications between environments with new addition to APM out-of-the-box Explore views

November 16, 2022

We have updated APM out-of-the-box dashboards with native support for OpenTelemetry (OT) deployment.environment standard tag.
OT deployment.environment is a nice way of slicing APM data between environments (e.g. dev vs prod). It is already supported in tracing metrics since some time and available for custom queries and dashboards. We wanted to follow up with support for it in out of the box dashboards.

Changes include: new explore views, adjusting naming for existing views, new levels in all views and new dashboards.

Compare health of your applications between environments with new addition to APM out-of-the-box Explore views

OpenTelemetry tracing Kubernetes Operator GA

November 9, 2022

We are proud to introduce OT Kubernetes Operator for tracing data.

This Sumo Logic optimised distribution of OT K8S operator helps customers to easily instrument apps deployed on K8s in modern and automatic way, with a few configuration flags, reducing onboarding friction and decreasing TTV.

OpenTelemetry tracing Kubernetes Operator GA

Sumo Logic OpenTelemetry 1.1

November 2, 2022

SumoLogic has updated the collector with additional features and capabilities as part of our ongoing efforts to standardize data collecting for all of your data.

  • Deploy Sumo Logic OpenTelemetry collector on MacOS and collect performance metrics.

  • Sumo Logic Kubernetes HelmOperator is now supported for Redhat Openshift 4.8-4.10

  • Replace Fluentd and FluentBit with Open Telemetry to collect logs and events with HelmChart version 2.7

Sumo Logic OpenTelemetry 1.1

Track your Amazon cloud infrastructure spending with AWS Cost Explorer in SumoLogic

September 14, 2022

Keeping an eye on cloud infrastructure spending is critical for the success of digital businesses. Reliability and performance of applications still remain a priority however, ensuring that organizations are not spending money unnecessarily is crucial for maximizing profits. On top of that having costs and performance data in the same place allows to efficiently correlate how cloud infrastructure upgrades may impact costs and vice versa.

Sumo Logic helps to achieve that with the new AWS Cost Explorer integration that brings the following:

  • Out-of-the-box dashboards for the account, region, service, and operation levels

  • Possibility to track the amortized, blended and unblended costs at daily or monthly granularity

  • Support for organization's linked accounts

Track your Amazon cloud infrastructure spending with AWS Cost Explorer in SumoLogic

Configurable auto resolution for Monitors

September 12, 2022

We’re extending the flexibility to configure alert auto resolution by enabling a couple of other parameters to help you create more stable alerts.

  1. Users can specify whether a single data point (at any time) is sufficient or if all the data points (at all times) within the detection window should be analyzed for recovering an alert. (Only applicable for Metrics Monitors)

  2. Users can specify a time period of normal activity that will resolve the alert. (Only applicable for Logs Monitor)


Configurable auto resolution for Monitors

Alerting Grouping for Monitors

September 12, 2022

Alert Grouping allows you to generate more than one alert from a given monitor by specifying a group condition on one or more fields.

For example, rather than creating multiple monitors for each service, you could create one single monitor that notifies you when some metric (i.e., CPU utilization, error count) goes above the threshold for a given service. All you’d have to do is specify service field as your Grouping condition so that one alert would be generated per service

Alerting Grouping for Monitors

New capabilities of Real User Monitoring in Sumo Logic

September 2, 2022

We are proud to present to you a major upgrade of Sumo Logic Real User Monitoring capabilities. Among many other things, you can now:

- Get unprecedented insights into your Single Page Apps (SPA) XHR and Navigation (Route changes) with dedicated performance metrics

- Track Core Web Vital metrics for your web frontend

- Detect browser freezes with longtask delays KPIs and diagnostics

- Automatically collect all browser error logs for unhandled errors or rejections, failed resources and console errors

New capabilities of Real User Monitoring in Sumo Logic

Ensure reliable modern apps with Service Level Objectives

August 8, 2022

Service Level Objectives (SLOs) are key to ensuring that modern app stacks are performing reliably for end users. SLOs also help organizations focus on measuring what matters for their end user’s digital experiences. As a result, they can streamline Observability by minimizing the monitoring and alert chaos that exists in many organizations. With Sumo Logic Reliability Management, organizations can define, monitor and manage their modern app stacks to Service Level Objectives (SLOs).

Reliability Management features the following:

  • Simple experience for Site Reliability Engineers (SREs) and developers to define and monitor even the most complex SLOs

  • Full featured SLOs that can model any SRE requirement and leverage logs, metrics and tracing telemetry

  • Automation through Terraform - allowing developers and SREs to templatize, operationalize and manage SLOs as code

  • SLO data as log messages enabling customers to extend existing dashboards to feature SLO data or build proprietary dashboard experiences

Ensure reliable modern apps with Service Level Objectives

Entity Groups for Cloud SIEM Enterprise

July 28, 2022

Security events in Cloud SIEM Enterprise (CSE) are related to Entities -- users, hosts, and so on. In CSE, Entities can have a number of attributes, including tags, criticality and suppression, and these provide value to uses in a number of ways: Additional context enables investigations to be completed more quickly, Insights can be better prioritized with the appropriate severity, and false positive signals from test instances can be prevented, for example. However, manually setting those attributes and keeping them in sync can be challenging.

That's why we are pleased to announce a new feature for CSE called Entity Groups. By defining Entity Groups, attributes can be automatically applied (or removed) based on the Entity's name, IP address, or inventory group membership. For example, an Entity Group can be defined that would ensure all high-risk laptops will receive higher criticality -- even if such a laptop is added to your environment months later.

Entities can even be members of more than one Entity Group, so a high-risk laptop in the Austin office could both get a tag identifying its location and receive a higher criticality. And if you later reassigned it so that it was no longer in a high-risk group, the criticality would be automatically removed.

Entity Groups for Cloud SIEM Enterprise

Get more value from your AWS cloud infrastructure monitoring with most recent updates

July 26, 2022

We are happy to introduce another set of improvements to AWS observability in Sumo Logic. Among others:

  • Enhanced dashboards for EC2 Host OS Metrics including support for Amazon EC2 CloudWatch Metrics: now you can monitor your EC2 instances via CloudWatch and Installed Collector at the same time and see results side-by-side.

  • Support for Amazon SNS - we’ve added out of the box dashboards with most important information about messages, events, errors illustrating SNS health and reliability.

  • Enhanced dashboards for supported Amazon services - following services got updated and revamped dashboards: DynamoDB, API Gateway, RDS, EC2 Metrics, ElastiCache and all Load Balancer services.

  • New CLI based onboarding flow: now you can roll-out a comprehensive AWS monitoring with just a single CLI command just by providing your AWS and Sumo credentials.

  • Simplified TerraForm onboarding process by importing Field Extraction Rules (FERs)

  • Streamlining of Root Cause Explorer drill-downs: while you can still find your AWS anomalies in RCE screen available from New menu and Entities panel, we have decided to remove RCE dedicated “Events of interests” dashboards from top level Dashboards drop-down menu.

  • Bug fixes

Get more value from your AWS cloud infrastructure monitoring with most recent updates

New GCP Metrics integrations

July 14, 2022

Our integration with GCP Cloud Monitoring API provides our customers a fully managed and scalable solution to collect metrics from GCP services into their Sumo Logic accounts. This helps simplify the monitoring and troubleshooting of GCP infrastructure, services, and applications.This source also lets you collect metrics from any custom services running on GCP.

New GCP Metrics integrations

Understand traces duration breakdown with new chart added to Traces page

June 21, 2022

Traces page now have a possibility to show aggregated trace duration critical path contribution (CPC) breakdown chart summarised for all traces from the Traces query result set. Use this chart to:

  • quickly understand intermittent duration spikes / slowdowns
  • immediately spot offending service by comparing CPC contribution by service

Height of every bar is an average of all traces in time bucket and it's divided proportionally to each service's contribution to duration of aggregated traces.

Understand traces duration breakdown with new chart added to Traces page

Traces UI now supports Span Links

May 13, 2022

Customers can now navigate between linked spans using hyperlinks in the metadata tab as well as search for linked spans in the trace query and span analytics.

A Span may be linked to other Spans (defined by SpanContext) that are causally related. Links can point to Spans inside a single Trace or across different Traces. Links can be used to represent batched operations where a Span was initiated by multiple initiating Spans, each representing a single incoming item being processed in the batch to to declare the relationship between the originating and following trace.

Traces UI now supports Span Links

Alerting Updates

April 28, 2022

Alert Audit Logs

We have introduced new Alert audit logs to the System Audit Index which will allow users to perform alert analytics. With these logs, users can answer questions such as :

  • How many alerts do we get in a day?

  • How long do alerts take to resolve?

Monitor History

You can now access monitor’s alert history from the Monitors List Page. We have introduced “Monitor History”, which shows the list of alerts associated with the monitor.

Alert Link on Monitors Page

You can now go to the active alert for a monitor directly from the Monitor’s page by clicking on the “Open Alert” icon or the "View Alerts" button.


Alerting Updates

Add your Spans analysis results directly to Dashboard

April 26, 2022

You can now add results of your queries on Spans data directly to the Dashboard. You can do that either via Log Search screen (when running queries in _trace_spans index) or from Spans analytics window, with ability to use same easy query builder to modify your panels later.

Add your Spans analysis results directly to Dashboard

Sumo Logic OpenTelemetry Distro GA

April 5, 2022

We are proud to announce the general availability of Sumo Logic’s Distribution of OpenTelemerty. We believe OpenTelemetry to be the future of observability and data collection. It provides customers with a single agent for all logs, metrics, and traces collection supported in multiple environments, whether a machine in your data center, a fleet of compute instances in your public cloud provider, or your Kubernetes environment. We are standardizing all of our data collection on OpenTelemetry. Our distribution is built entirely on upstream OpenTelemetry Collector while adding some features and capabilities to improve your experience when using Sumo Logic.

Sumo Logic OpenTelemetry Distro GA

AWS Observability updated

March 24, 2022

We’re happy to announce the release of our AWS Observability Solution v2.4.0 which includes:

  • Streamlined setup steps
  • Support for classic ELB
  • Enhanced dashboards for account/region overviews, EC2, Lambda and ALB
  • Bug fixes
AWS Observability updated

Filter Traces by any custom tag

February 14, 2022

We are proud to announce general availability of extended trace filtering capabilities. This allows you to search for traces by any existing and new metadata, including your custom ones without a need to add this to the configuration or knowing this upfront, before you start ingesting data. Just add any metadata tag to your spans and, as long as its cardinality within a trace is not too high, you will be able to filter by it right away in your Traces UI.

Filter Traces by any custom tag

Monitor your Couchbase with Sumo Logic

February 11, 2022

Couchbase is a distributed document database with a powerful search engine and in-built operational and analytical capabilities. It brings the power of NoSQL to the edge and provides fast, efficient bi-directional synchronisation of data between the edge and the cloud. The Sumo Logic app for Couchbase helps you monitor activity in Couchbase. The preconfigured dashboards provide insight into the Health of Cluster, The Status of The Buckets, I/O of Reading/Writing, Errors, Events of Couchbase Servers that help you understand your clusters.

Monitor your Couchbase with Sumo Logic

Measure development lead time and track each team’s DORA metrics

February 10, 2022

Sumo Logic’s Software Development Optimization solution now empowers you to measure the time your team’s spend coding, reviewing, and delivering software so that your teams can better identify cross-team bottlenecks and measure how effectively they practice small batch development and delivery. The new Development and Delivery Times dashboard measures each team’s average time spent actively coding new features, reviewing them, and deploying them to each application environment. Also, the new DORA Metrics Overview dashboard provides granular DORA metrics for each team, service, and environment.

Measure development lead time and track each team’s DORA metrics

Drill-down to traces by traceid/spanid directly from log message

January 18, 2022

Now, if your log message contains distributed trace id or span id, you can find an option to directly open the trace in the right-click menu. The UI automatically recognises trace/span ids in logs and checks in the background if a trace exists in Sumo before showing the link.

Drill-down to traces by traceid/spanid directly from log message

New App for MariaDB

January 18, 2022

The MariaDB app helps you monitor the availability, performance and resource utilization of MariaDB database clusters. Preconfigured dashboards and searches provide insight into the health of your database clusters, performance metrics, resource metrics, schema metrics, replication, error logs, slow queries, Innodb operations, failed logins and error logs.

New App for MariaDB

Updated App for Squid Proxy

January 18, 2022

The Squid Proxy app helps you monitor activity in Squid Proxy. The preconfigured dashboards provide insight into served and denied requests; performance metrics; IP domain DNS statistics; traffic details; HTTP response codes; URLs experiencing redirects, client errors, and server errors; and quality of service data that helps you understand your users’ experience.

Updated App for Squid Proxy

Updated App for Oracle

January 18, 2022

The Oracle app helps you monitor the availability, performance, and resource utilization of Oracle database clusters. Preconfigured dashboards and searches provide insight into the health of your database clusters, parallel executions, resource utilization, response time, tablespaces, throughput, wait class/events, listeners, audit logs, and security.

Updated App for Oracle

Updated App for IIS

January 18, 2022

The IIS app helps you monitor the availability, performance, health and resource utilization of your IIS web servers using both logs and metrics sources. Preconfigured dashboards and searches provide insight into application pools, ASP.NET applications, requests, latency, visitor locations, visitor access types, traffic patterns, errors, web server operations and access from known malicious sources.

Updated App for IIS

Updated App for Nginx

January 18, 2022

The Nginx app is a unified logs and metrics app that helps you monitor the availability, performance, health, and resource utilization of your Nginx web servers. Preconfigured dashboards and searches provide insight into connections, requests, visitor locations, visitor access types, traffic patterns, errors, web server operations, and access from known malicious sources.

Updated App for Nginx

General Availability of Tracing API

January 18, 2022

We are proud to open up for all our customers a programmatic way to access Tracing data in Sumo Logic through a new API tracing-related endpoints. You find documentation about new endpoints under this link:

General Availability of Tracing API

OpenTelemetry SpanEvents

January 18, 2022

Span events are optional time-stamped strings which are made up of timestamp, name, and (optional) key-value pair attributes. They are used to describe and contextualize the work being done under a Span. An example where they are added during auto-instrumentation is in the OT Java or Python —if it sees an exception happening while it's the code is traced, it will attach the exception details automatically onto the relevant span as a Span Event. Also manual creation of events is possible: here’s a good example from Ruby. What we are adding with this update is an ability to display events in the Trace View, event details and all attributes in the Metadata tab and a dedicated pop-up to analyse event message/attributes in whole detail.

OpenTelemetry SpanEvents

Dashboard Auto Refresh

January 14, 2022

We are very excited to announce that Auto Refresh capability is now available for Dashboards (New)! This new capability will allow you to automatically refresh your Dashboards (New) on a regular interval, making it easy to ensure you are viewing relevant and fresh information on a continual basis. Available refresh intervals range from 30 seconds to 1 day.

Dashboard Auto Refresh

Expansion of Cloud SIEM availability across Australia, Japan—and now India

December 13, 2021

This year we’ve made our Cloud SIEM solution available locally in Sydney, Australia, and Tokyo, Japan. Now we’ve just deployed Cloud SIEM in Mumbai, India. Sumo Logic’s continued international expansion of Cloud SIEM across the Asia Pacific and Japan regions provides regional customers with low latency when ingesting data into the Sumo Logic platform and helps enterprises address their data privacy concerns and data residency requirements. With our local Cloud SIEM, organizations and their SOC teams gain an automated view of potential security incidents along with the relevant context needed for making rapid response decisions and improving security posture.

Expansion of Cloud SIEM availability across Australia, Japan—and now India

Updated Data Volume App

November 12, 2021

We're excited to announce that we have released an updated Data Volume App that provides you with the ability to view and track account usage for by data type (logs, metrics, traces), data tier, category, collector, sources and hosts. In addition, you will also be able to track usage in both native units as well as Credits.

Updated Data Volume App

Gitlab and CircleCI support for Software Development Optimization

November 9, 2021

Sumo Logic’s Software Development Optimization solution now supports GitLab and CircleCI, broadening the data sets that can be ingested for greater visibility into your software delivery process. With these integrations, Software Development Optimization lets Gitlab and CircleCI customers focus on increasing the velocity and quality of their development and delivery processes by providing full visibility to identify bottlenecks and troublesome deployment strategies. We even offer a dedicated Gitlab app so Gitlab customers can monitor the git commits and pull requests as well as pipeline runs, builds, and deployment statuses across all of their software development teams.

Gitlab and CircleCI support for Software Development Optimization

Three Cloud SIEM features to tailor SOC workflows

October 28, 2021

We’re proud to highlight three new product features and enhancements that provide SOC teams and security analysts with new optimizations to help them adapt Cloud SIEM to their environment even better. Together, these features help improve team collaboration and consistently communicate threat information and event statuses while also saving time during threat investigation and response activities.

Custom Tag Schemas

This new enhancement to our Cloud SIEM tagging capability now allows users to define their own custom tag schemas with the enforcement of schema definition and association of tags. Similar to how MITRE ATT&CK Tactics and Techniques can be chosen from a drop-down, now customers can define their own standard set of tags to leverage; their appearance in drop-downs allows team members to choose the correct tags. This allows consistency across the SOC team and makes it easier for security analysts to navigate objects with those tags and search for them.

Learn more —>


Custom Insight Statuses

Customers can now create their own unique Insight statuses and change the order depicted in the Cloud SIEM interface—enabling SOC teams to map the workflows to their specific needs. Each custom Insight status has a name and description and can be easily re-ordered by moving the handle alongside its name on the Workflow page. SOC admins can change the order in real-time at will, however, the New status must always be the first status, and Closed must always be the last status. Once set, the custom workflow is displayed in the desired order throughout the interface including Status drop-downs within Insight Details pages and when filtering Insights by Status.

Learn more —>


Custom Insight Resolutions

This unique Cloud SIEM functionality enables customers to define and name their own descriptions for closing Insights, providing them the customization and granularity needed to align with their existing workflows and processes. Custom resolutions are nested under any of the four existing built-in resolutions: Duplicate, False Positive, No Action, and Resolved. This increases clarity for the team and provides additional context as to why an Insight was closed.

Learn more —>


Three Cloud SIEM features to tailor SOC workflows

Sumo Logic App for Host and Process Metrics

October 22, 2021

We’re excited to release a new Sumo Logic App for Host and Process Metrics that allows you to monitor the performance and resource utilization of hosts and processes that your mission critical applications are dependent upon. Preconfigured dashboards provide insight into CPU, memory, network, file descriptors, page faults, and TCP connectors. We also have pre-packaged alerts to proactively monitor your hosts. Alerts are based on Sumo Logic monitors and include preset thresholds for high CPU, memory, network, disk and file host and/or process resource utilization.

Sumo Logic App for Host and Process Metrics

New Dashboard panels: Service Map and Trace List

October 14, 2021

Many of you already know that Sumo Logic is not only about logs. Our OpenTelemetry powered APM data can now be visualised in two nice ways as Dashboards (New) panels. Want to get quick insight into your service dependencies and lookup most recent or longest traces flowing through it ? Nothing easier now ! If you are an active user of our APM/Tracing data, your out-of-the-box dashboards will get upgraded automatically to include new panels.

New Dashboard panels: Service Map and Trace List

Operation level metrics and dashboards for monitoring Application Services

October 13, 2021

If you are using APM/Distributed Tracing with Sumo Logic, you might notice we have automatically upgraded Explore's Application Service and Service Application Views. They now include new, third level of hierarchy : Operation and associated dashboard with key performance metrics for them. They allow you to get insight into top most active tracing operations like HTTP requests or SQL queries.

Operation level metrics and dashboards for monitoring Application Services

Updated Sumo Logic App for Elasticsearch

October 1, 2021

We’ve released a new version of the Elasticsearch app that now includes pre-packaged alerts and additional dashboards. The Sumo Logic App for Elasticsearch is a unified logs and metrics app that helps you monitor the availability, performance and health of your Elasticsearch clusters. Preconfigured dashboards provide insight into cluster health, resource utilization, sharding, garbage collection, and search, index, and cache performance. Alerts are based on Sumo Logic monitors, leverage metrics and logs, and include preset thresholds for node availability, cluster status, disk space, heap usage, shards, pending tasks, slow queries and errors.

Updated Sumo Logic App for Elasticsearch

Updated Sumo Logic App for Memcached

October 1, 2021

We’ve released a new version of the Memcached app that now includes pre-packaged alerts and additional dashboards. The Sumo Logic App for Memcached is a unified logs and metrics app that helps you monitor the availability, performance and health of your Memcached clusters. Preconfigured dashboards provide insights into uptime, operational metrics, cache performance, resource utilization, errors, warnings, and commands executed. Alerts are based on Sumo Logic monitors, leverage metrics and logs, and include preset thresholds for cache hit ratio, node availability, command/authentication errors, connections and memory usage.

Updated Sumo Logic App for Memcached

Updated Sumo Logic App for ActiveMQ

October 1, 2021

We’ve released a new version of the ActiveMQ app that now includes pre-packaged alerts and additional dashboards. The Sumo Logic App for ActiveMQ is a unified logs and metrics app that helps you monitor the availability, performance and health of your ActiveMQ clusters. The Preconfigured dashboards provide insight into cluster status, nodes, producers, consumers, destinations, resource utilization, message rates and error logs. Alerts are based on Sumo Logic monitors, leverage metrics and logs, and include preset thresholds for node availability, resource utilization (CPU, memory, disk, file descriptors), connections, queues, expired messages and unacknowledged messages.


Updated Sumo Logic App for ActiveMQ

Updated Sumo Logic App for HAProxy

October 1, 2021

We’ve released a new version of the HAProxy app that now includes pre-packaged alerts and additional dashboards. The Sumo Logic App for HAProxy is a unified logs and metrics app that helps you monitor the availability, performance and health of your HAProxy cluster. Preconfigured dashboards provide insights into active servers, visitor locations, sessions, errors, response time and throughput. Alerts are based on Sumo Logic monitors, leverage metrics and logs, and include preset thresholds for errors, server availability, server sessions, blocked/pending requests, slow response times and retries.

Updated Sumo Logic App for HAProxy

Dashboard Export

September 30, 2021

We're thrilled to announce that Sumo Logic Dashboards (New), now allow you to generate an export in PDF or PNG format with just 2 clicks. This new capability further expands the flexibility and portability of your mission-critical data. Dashboard exports are especially useful in situations where you would like to provide stakeholders, outside of Sumo, dashboard-level insights, without them having to log in or take any additional action.

Dashboard Export

Alert Response

September 29, 2021

Troubleshooting production issues is even more challenging with modern distributed applications. With our new alert response feature, your on-call teams can now also leverage curated insights that will help them get to the root cause quickly. The feature generates relevant insights as a context card using Sumo analytics to track what’s occurring in your applications, helping your teams troubleshoot faster.

Alert Response

Distributed Tracing for AWS Lambda

September 28, 2021

We are proud to announce general availability of Sumo Logic lambda layers for distributed tracing. Together with our AWS partners, we deliver this managed layers available directly from your AWS lambda layer repository. Just configure your lambdas to attach to the layer appropriate for your language and enjoy new visibility in Sumo Logic. Lambda calls appear just as any other spans in your traces and by clicking on them you immediately get insights into Cloud Watch metrics related to this lambda and possibility to drill-down to Dashboard of this particular function.


Distributed Tracing for AWS Lambda

AWS Observability Updates

September 24, 2021

We’re happy to announce the latest release of our AWS Observability Solution 2.3.0 which includes the deployment of the AWS Observability Solution using a Terraform script. This update also includes options for streamlined deployment to multiple accounts and regions and updates to dashboards and monitors.

AWS Observability Updates

Updated Sumo Logic App for Cassandra

September 8, 2021

We’ve released a new version of the Cassandra app that now includes pre-packaged alerts and additional dashboards. The Sumo Logic App for Cassandra is a unified logs and metrics app that helps you monitor the availability, performance and resource utilization of your Cassandra database clusters. Preconfigured dashboards provide insight into cluster health, resource utilization, cache/Gossip/Memtable statistics, compaction, garbage collection, thread pools and write paths. Alerts are based on Sumo Logic monitors, leverage metrics and logs, and include preset thresholds for node availability, authentication failures, cache hit rates, pending/blocked/repair tasks, compaction pending tasks, and tombstone scanning.

Updated Sumo Logic App for Cassandra

Anomaly (Outlier) Based Monitors

September 1, 2021

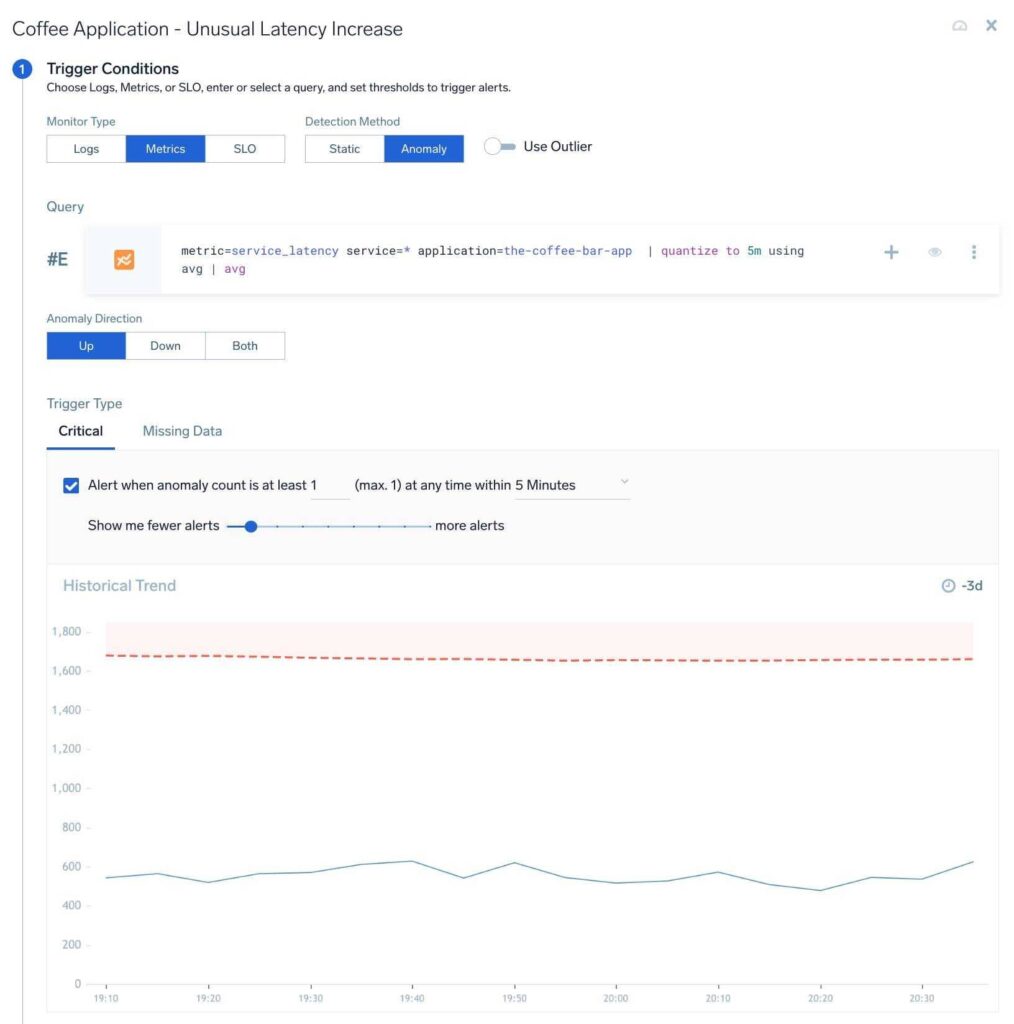
We have extended our monitors capabilities (New alerting framework) to support anomaly(outlier) based alerting for both logs and metrics data sources.

Anomaly based alerting removes the need to specify a static alert threshold. System automatically creates dynamic baselines, and alerts the user, when there is abnormal trend in the alerting KPI compared to its historic behavior.

Anomaly based alerts are especially useful for custom KPIs that constantly change overtime, and don't have a good static reference condition to alert on. For example, Requests, latency and errors are some examples of KPIs that might constantly change based on external and internal factors like changes in customer usage patterns or code changes & feature releases.

Anomaly (Outlier) Based Monitors

Sumo Logic Red Hat Marketplace Operator

August 31, 2021

Sumo Logic has expanded its partnership with Red Hat to accelerate hybrid cloud adoption with Red Hat Operator Certification and availability of the Sumo Logic Helm Operator for OpenShift. Red Hat OpenShift Users can now integrate Sumo Logic by simply installing our operator in the Red Hat MarketPlace. Simply provide your Sumo Logic credentials and Kubenetes cluster name, and with a click our Operator is installed collecting all the critical telemetry you need. Sumo Logic fully integrates and supports Red Hat OpenShift, ensuring customers have complete observability of their Kubernetes clusters.

Sumo Logic Red Hat Marketplace Operator

New Real User Monitoring capabilities

August 18, 2021

Now, you are able not only get visibility into individual user transactions and quickly understand what was the user experience and delay incurred on the client to overall end to end transaction time, but also perform high level monitoring, alerting and troubleshooting of such situations. You have full visibility into user cohorts, their geographical locations, browsers, operating systems. You can also fully understand the overall experience of all users and transactions of your digital business, all the time.

New Real User Monitoring capabilities

Introducing Span Analytics

August 12, 2021

We are excited to introduce a brand new experience we built to help data exploration and query creation for less technical users - our new Span Analytics UI.

This new interface helps you intuitively to perform a multi-dimensional analysis of you application performance signals gathered from trace spans. You can easily filter, aggregate data build charts with custom metrics and inspect your span tags with full fidelity and no high cardinality limits.

You can find this new capability in the “New” menu of your Sumo Logic interface.

Introducing Span Analytics

Updated Sumo Logic App for Varnish

August 9, 2021

We’ve released a new version of the Varnish app that now includes pre-packaged alerts. New features include support for collecting Varnish metrics data using Telegraf and support for monitoring Varnish servers in Kubernetes environments. Out-of-the-box dashboards provide insight into cache performance, communication with backend servers/clients, thread metrics, requests, visitor locations, traffic patterns, errors, resource utilization, web server operations and access from known malicious sources. Alerts are based on Sumo Logic monitors, leverage metrics and logs, and include preset thresholds for busy/unhealthy backend servers, failed connections, failed thread creation, access from known malicious sources and 4xx/5xx errors.


Updated Sumo Logic App for Varnish

Sumo Logic App for Memcached

August 9, 2021

The Memcached app is a unified logs and metrics app that helps you monitor the availability, performance, health and resource utilization of your Memcached clusters. Preconfigured dashboards provide insight into uptime, cache hits/misses, resource utilization, errors, and commands executed.

Sumo Logic App for Memcached

Sumo Logic App for Elasticsearch

August 1, 2021

The Elasticsearch app is a unified logs and metrics app that helps you monitor the availability, performance, health and resource utilization of your Elasticsearch clusters. Preconfigured dashboards provide insight into cluster health, resource utilization, sharding, search and index performance.

Sumo Logic App for Elasticsearch

Updated Sumo Logic App for Apache Tomcat with Pre-packaged Alerts

July 21, 2021

We’ve released a new version of the Apache Tomcat app that now includes pre-packaged alerts. New features include support for collecting Tomcat metrics data using Telegraf and support for monitoring Tomcat servers in Kubernetes environments. Out-of-the-box dashboards provide insight into visitor locations, traffic patterns, errors, resource utilization, garbage collection, web server operations and access from known malicious sources. Alerts are based on Sumo Logic monitors, leverage metrics and logs, and include preset thresholds for high memory usage, access from known malicious sources and 4xx and 5xx errors.

Updated Sumo Logic App for Apache Tomcat with Pre-packaged Alerts

Global Intelligence for Security Insights: Global Confidence score

July 12, 2021

We’re proud to announce Sumo Logic’s Global Intelligence for Security Insights, a new feature in Cloud SIEM Enterprise presented as Global Confidence Scores. This new feature is designed to further assist security analysts as they triage and prioritize the Insights our Cloud SIEM solution automatically generates. These scores represent a level of confidence predicted by Sumo’s Global Intelligence machine learning model that the Insight is actionable. The score is on a scale from 0 to 100 with higher scores indicating a higher confidence level. Our model observes and compares patterns from Insights that are closed with either a False Positive or Resolved resolution by Cloud SIEM Enterprise customers around the world, while also taking into account customizations made by the specific customer. This enables us to apply a score based on patterns seen at one customer when they are encountered at another customer.

Please note: all information used by our model is anonymized, and no customer-confidential information is processed, nor retained.

Global Intelligence for Security Insights: Global Confidence score

Root Cause Explorer: Analyze and Monitor Events of Interest Using Log Queries

July 9, 2021

Root Cause Explorer Events of Interest are unusual spikes in metrics observed on application or infrastructure entities and are the first sign of trouble in complex microservices environments. Events of Interest are now streamed as log messages enabling correlations between custom application/service telemetry data and Events of Interest computed from Open Telemetry trace-metrics, AWS Cloudwatch and Kubernetes metrics. Such correlations surface diagnostics at the application and infrastructure layers of an Observability stack and accelerate root cause analysis. In addition, customers can build dashboards and monitors by analyzing Events of Interest data, exemplified by the following use cases:

  • Alert Strategy: Identify metrics and entities to monitoring based microservices, Kubernetes or AWS entities and associated metrics experiencing the most Events of Interest

  • Health Checks: Assess health of microservices, AWS accounts and Kubernetes clusters based on Events of Interest count (see screenshot)

  • Monitors on Events of Interest

  • Behavior Insights (e.g. LogExplain, LogReduce) on Events of Interest to identify and explain unusual patterns in entity behavior

Root Cause Explorer: Analyze and Monitor Events of Interest Using Log Queries

Sumo Logic App for Cassandra

July 6, 2021

The Sumo Logic App for Cassandra is a unified logs and metrics app that helps you monitor the availability, performance and resource utilization of your Cassandra database clusters. Preconfigured dashboards provide insight into the database cluster status, resource utilization, compactions, SST Tables, dropped messages, warning and error logs.

Sumo Logic App for Cassandra

Sumo Logic App for ActiveMQ

July 2, 2021

The ActiveMQ app is a unified logs and metrics app that helps you monitor the availability, performance, health, and resource utilization of your ActiveMQ messaging clusters. Preconfigured dashboards provide insight into cluster status, nodes, producers, consumers, destinations, resource utilization, message rates and error logs.

Sumo Logic App for ActiveMQ

Sumo Logic App for RabbitMQ

July 2, 2021

The RabbitMQ app is a unified logs and metrics app that helps you monitor the availability, performance, health, and resource utilization of your RabbitMQ messaging clusters. Preconfigured dashboards provide insight into cluster status, exchanges, queues, nodes and error logs. We also have pre-packaged alerts to proactively monitor your RabbitMQ clusters. Alerts are based on Sumo Logic monitors, leverage metrics and logs, and include preset thresholds for high resource utilization, consumers, node availability, connections and unacknowledged and unroutable messages.

Sumo Logic App for RabbitMQ

Sumo Logic App for Nginx Ingress Plus with Pre-packaged Alerts

July 2, 2021

The Nginx Plus Ingress app is a unified logs and metrics app that helps you monitor the availability, performance, health and resource utilization of your Nginx Plus Ingress web servers. Preconfigured dashboards and searches provide insight into server status, location zones, server zones, upstreams, resolvers, visitor locations, visitor access types, traffic patterns, errors, web server operations and access from known malicious sources. We also have pre-packaged alerts to proactively monitor your Nginx Plus servers. Alerts are based on Sumo Logic monitors and include preset thresholds for dropped connections, critical event log messages, access from known malicious sources and 4xx and 5xx errors.

Sumo Logic App for Nginx Ingress Plus with Pre-packaged Alerts

Updated Sumo Logic integration application with Zscaler Internet Access

June 29, 2021

We’ve released an update to our support for Zscaler Internet Access (ZIA), including a fully hosted collection solution using ZIA’s Cloud Nano Streaming Service and Sumo Logic’s HTTP Source. New out of the box dashboards provide rich insights to the web, tunnel, DNS, and firewall activity occurring in the Zscaler Zero Trust Exchange. Cloud SIEM Enterprise customers can leverage this data in Insight generation.

Updated Sumo Logic integration application with Zscaler Internet Access

New Sumo Logic support for Zscaler Private Access

June 29, 2021

The Zscaler Private Access App allows you to easily visualize the state of your Zscaler Private Access (ZPA) infrastructure to assure compliance with policy, operational health, and identify suspicious activity. The solution provides hosted Sumo Logic collection using a CloudSyslog source integrated with the Zscaler Log Streaming Service. Cloud SIEM Enterprise customers can correlate blocked and allowed traffic logs with endpoint, user, and Threat Intelligence data for Insight generation.

New Sumo Logic support for Zscaler Private Access

Root Cause Explorer Improvements

June 28, 2021

Assessing anomalous metrics on a timeline is a key strategy to determining root cause as earlier spikes in metrics of associated entities are closer to the root cause of an incident. Root Cause Explorer now renders a timeline of anomalous metrics, as shown in the screenshot, along with a summary of the affected entity, metric, golden signal type and time series stats. Events of Interest are now computed on operations of application services instrumented with Sumo Logic tracing allowing on-call users to pinpoint issues in particular operations. Additional noise reduction techniques are also rolled out to suppress statistical anomalies that are not relevant for root cause analysis.

Root Cause Explorer Improvements

Global Intelligence for Apache Tomcat

June 22, 2021

Global Intelligence for Apache Tomcat is a companion to the Apache Tomcat application and helps DevOps and infrastructure engineers compare server golden signals (load, error, latency and throughput) and visitor activity patterns associated with their Apache Tomcat servers against thousands of Apache Tomcat servers that beacon their logs to Sumo Logic. Such comparisons can help diagnose or eliminate Apache Tomcat problems over the course of an incident arising from sub-optimal configurations of servers and unusual connection rate, request rate, response size, HTTP verb mix, or backend issues.

Global Intelligence for Apache Tomcat

Global Intelligence for Apache

June 22, 2021

Global Intelligence for Apache App is a companion to the Apache App and helps DevOps and infrastructure engineers compare server golden signals (load, error, latency and throughput) and visitor activity patterns associated with their Apache servers against thousands of Apache servers that beacon their logs to Sumo Logic. Such comparisons can help diagnose or eliminate Apache problems over the course of an incident arising from sub-optimal configurations of servers and unusual bot activity, response size, HTTP verb mix, client mix or backend issues.


Global Intelligence for Apache

Updated Sumo Logic App for SQL Server with Pre-packaged Alerts

June 4, 2021

We’ve released a new version of the SQL Server app that now includes pre-packaged alerts. New features include support for collecting SQL Server metrics data using Telegraf and support for monitoring SQL Server in Kubernetes environments. Out-of-the-box dashboards provide insight into cluster status, performance, operations, replication, latency, I/O as well as backup and restore operations. Alerts are based on Sumo Logic monitors, leverage metrics and logs, and include preset thresholds for cluster availability, backup failures, resource utilization, deadlocks, login failures, errors and blocked processes.

Updated Sumo Logic App for SQL Server with Pre-packaged Alerts

Sumo Logic App for Nginx Plus with Pre-packaged Alerts

June 4, 2021

The Nginx Plus app is a unified logs and metrics app that monitors the availability, performance, health and resource utilization of your Nginx Plus servers. Preconfigured dashboards and searches provide insight into server status, location zones, server zones, upstreams, resolvers, visitor locations, visitor access types, traffic patterns, errors, web server operations and access from known malicious sources. We also have pre-packaged alerts to proactively monitor your Nginx Plus servers. Alerts are based on Sumo Logic monitors and include preset thresholds for dropped connections, critical event log messages, access from known malicious sources and 4xx and 5xx errors.

Sumo Logic App for Nginx Plus with Pre-packaged Alerts

Updated Sumo Logic App for MongoDB Server with Pre-packaged Alerts

June 2, 2021

We’ve released a new version of the MongoDB app that now includes pre-packaged alerts. New features include support for collecting MongoDB metrics data using Telegraf and support for monitoring MongoDB clusters in Kubernetes environments. Out-of-the-box dashboards provide insight into cluster status, logins, connections, slow queries, replication, resource utilization, sharding, errors and warnings. Alerts are based on Sumo Logic monitors, leverage metrics and logs, and include preset thresholds for cursors, missing primaries, instance availability, replication errors, too many connections, slow queries and sharding failures.

Updated Sumo Logic App for MongoDB Server with Pre-packaged Alerts

Sumo Logic App for HAProxy with Pre-packaged Alerts

May 28, 2021

The Sumo Logic App for HAProxy is a unified logs and metrics app that helps you monitor the availability, performance and health of your HAProxy cluster. Preconfigured dashboards provide insights into active servers, visitor locations, sessions, errors, response time and throughput.

Sumo Logic App for HAProxy with Pre-packaged Alerts

Updated Sumo Logic App for Apache with Pre-packaged Alerts

May 28, 2021

We’ve released a new version of the Apache app that now includes pre-packaged alerts. New features include support for collecting Apache metrics data using Telegraf, and support for monitoring Apache web servers in Kubernetes environments. Out-of-the-box dashboards and searches provide insight into visitor locations, visitor access types, traffic patterns, errors, web server operations, resource utilization and access from known malicious sources. Alerts are based on Sumo Logic monitors, leverage metrics and logs, and include preset thresholds for critical error messages, 4XX/5XX error rates, resource utilization, and access from known malicious sources.


Updated Sumo Logic App for Apache with Pre-packaged Alerts

Analyze your tracing data any way you want with Sumo search query language

May 20, 2021

We are proud to introduce the GA of the Extended trace filtering and Search Query Language support. This allows customers to not only find and diagnose transaction traces that match any custom criteria, but also make advanced Sumo-like analysis on the top of trace span data using Sumo Search Query Language (SQL), the same way as for log data, in the same familiar interface.

This capability allows you to access raw tracing data on a span level, treat it as structured or unstructured data for analysis and filter, transform or aggregate any part of the tracing span message (a single atomic request/response representation) to deliver meaningful results to drive smarter decisions.

Analyze your tracing data any way you want with Sumo search query language

Multi-account management with Sumo Organizations

May 4, 2021

Sumo Organizations is a new multi-account management solution that enables managed service providers (MSP) and managed security service providers (MSSP) to efficiently manage multiple Sumo Logic accounts. We are introducing a native multi-tenant and organizational hierarchy, enabling cross-organization visibility, provisioning, aggregate usage reporting, and cost management at the organization level. Key capabilities include:

  • Multi-tenant management interface to view and manage all your organizations
    • Single sign on access to all of your customers
    • Point-in-time usage reporting and the ability to allocate credits across orgs
    • Support for cross-geographical deployment billing
  • Role-based access control permissions for credit allocation and provisioning
  • Self-service provisioning and trial account creation for partners
  • Federated view of Sumo Logic Cloud Enterprise insights
Multi-account management with Sumo Organizations

New AWS Kinesis Data Firehose integrations for streaming CloudWatch Logs and Metrics

May 3, 2021

Our integration with AWS Kinesis Data Firehose provides our customers a fully managed, scalable, and low latency solution to stream Amazon CloudWatch Logs and Metrics using AWS Kinesis Data Firehose into their Sumo Logic accounts, to help simplify the monitoring and troubleshooting of AWS infrastructure, services, and applications.

Our customers now have access to two new hosted sources namely, AWS Kinesis Firehose for Logs Source and AWS Kinesis Firehose for Metrics Source. Some of the key capabilities on offer are:

  • Reliable Delivery of CloudWatch Metrics and Logs.

  • Automatic retry capabilities: Kinesis Data Firehose has an automatic retry mechanism and routes all failed Logs and Metrics to a customer-owned S3 bucket for later recovery.

  • Efficient Filtering for Metrics

  • Performant and less intrusive Log collection

New AWS Kinesis Data Firehose integrations for streaming CloudWatch Logs and Metrics

AWS Observability Updates

May 3, 2021

We’re happy to announce the release of our AWS Observability Solution v2.2.0 which includes:

  • New performance and cost-savings. We’ve added support for collecting AWS CloudWatch metrics and AWS CloudWatch logs through new Amazon Kinesis logs and metrics sources for Sumo Logic. These new sources enable you to collect logs and metrics data from AWS in the most performant and cost-effective manner.

  • AWS benchmarks in-context with AWS Observability. Global Intelligence for AWS CloudTrail DevOps helps you accelerate root cause analysis for incidents by providing error rate and configuration insights benchmarked from Sumo Logic’s AWS customers for nine AWS services: EC2, Lambda, Auto Scaling, S3, ELB, RDS, DynamoDB, ElastiCache and Redshift. In this release, the benchmark dashboards are integrated with AWS Observability solution at the account-region level.

AWS Observability Updates

Updated Sumo Logic App for Redis with Pre-Packaged Alerts

April 30, 2021

We’ve released a new version of the Redis app that includes pre-packaged alerts. New features include updated dashboards that allow you to visualize, search and alert by Redis clusters and hosts. Alerts are based on Sumo Logic monitors, leverage metrics and logs, and include preset thresholds for connections, replication, memory fragmentation, communication failures, resource utilization and other critical conditions.

Updated Sumo Logic App for Redis with Pre-Packaged Alerts

Updated Sumo Logic App for PostgreSQL with Pre-Packaged Alerts

April 30, 2021

We’ve released a new version of the PostgreSQL app that includes pre-packaged alerts. New features include support for collecting PostgreSQL metrics data using Telegraf, and for monitoring PostgreSQL in Kubernetes environments. Out-of-the-box dashboards provide insight into the health of your PostgreSQL clusters, deadlocks, replication status, query performance, slow queries, incoming connections, failed authentications and error logs. Alerts are based on Sumo Logic monitors, leverage metrics and logs, and include preset thresholds for connections, slow queries, commit rates, deadlocks, replication, locks, compression and other critical conditions.

Updated Sumo Logic App for PostgreSQL with Pre-Packaged Alerts

Sumo Logic App for Kafka with Pre-Packaged Alerts

April 30, 2021

The Sumo Logic App for Kafka is a unified logs and metrics app that helps you monitor the availability, performance and resource utilization of Kafka messaging/streaming clusters. Preconfigured dashboards provide insights into cluster status, throughput, broker operations, topics, replication, zookeepers, node resource utilization and error logs. We also have pre-packaged alerts to help you monitor your Kafka cluster. Alerts are based on Sumo Logic monitors, leverage metrics and logs, and include preset thresholds for high resource utilization, disk usage, errors, failed connections, under replicated and offline partitions, unavailable replicas, consumer replica lag and other critical conditions.

Sumo Logic App for Kafka with Pre-Packaged Alerts

New Pre-Packaged Alerts for Nginx and Nginx Ingress

April 30, 2021

We’ve released pre-packaged alerts to help you monitor your Nginx and Nginx Ingress clusters. These alerts are built based on Sumo Logic monitors, leverage metrics and logs and include preset thresholds for dropped connections, critical event log messages, access from known malicious sources and 4xx and 5xx errors.

New Pre-Packaged Alerts for Nginx and Nginx Ingress

LogReduce performance improvements (LogReduce Optimize)

April 8, 2021

Logreduce, a capability within Behavior Insights, is now enhanced to increase the speed of unstructured log summarization with LogReduce Optimize. In our testing, we are seeing 5X-20X improvements in side-by-side comparisons with classic LogReduce. The new operator is most appropriate for customers that are looking for quick patterns analysis and time-based comparisons and do not require interaction with LogReduce results such as splitting or editing signatures. Performance improvements can vary based on query time range, data ingest patterns and other factors. The screenshot below shows 1 M log lines summarized by LogReduce Optimize in 25 seconds, a 20X improvement.

LogReduce performance improvements (LogReduce Optimize)

Service Map & Service Dashboards

March 24, 2021

Service Map is built real-time, out of the box from distributed tracing data incoming to Sumo Logic. It allows you to:

  • understand architecture of your environment on the micro-service level
  • track the connections and dependencies between application components
  • quickly visualise most import KPIs for each service
  • drill-down to:

Service Dashboards give you out of the box, zero configuration view of health, load and performance of your micro-services. They provide:

  • insights toload, latency and errors for each micro-service
  • comparison between components of the same application allowing easy fault domain isolation
  • ability to drill-down to individual traces in context of specific spike on any chart
Service Map & Service Dashboards

New Cloud to Cloud (C2C) Integrations for Azure EventHub, Carbon Black Cloud, Duo and Salesforce

March 12, 2021

The Cloud-to-Cloud Integration framework is an extensible system for running fully hosted, pull, and pub-sub based sources. We now have new sources for Azure EventHub, Carbon Black Cloud, Duo and Salesforce. All of these integrations have been certified to work with the corresponding apps in the app catalog.

  • The Azure Event Hubs Source provides a secure endpoint to receive data from Azure Event Hubs. It securely stores the required namespace and policy information,, scheduling, and state tracking information required to collect from Azure Event Hubs.

  • The Carbon Black Cloud Source provides a secure endpoint to receive data from VMWare Carbon Black Cloud Endpoint Standard APIs (formerly Defense). It securely stores the required Carbon Black URL, authentication, scheduling, and state tracking information for communicating with Carbon Black Cloud Endpoint Standard.

  • The Duo Source provides a secure endpoint to receive authentication logs from the Duo Authentication Logs API. It securely stores the required domain, authentication, scheduling, and state tracking information.

  • The Salesforce Source provides a secure endpoint to receive event data from the Salesforce through its Rest API. The source securely stores the required authentication, scheduling, and state tracking information.

New Cloud to Cloud (C2C) Integrations for Azure EventHub,  Carbon Black Cloud, Duo and Salesforce

Root Cause Explorer for Kubernetes metrics and OpenTelemetry traces

March 8, 2021

Root Cause Explorer is now enhanced to incorporate Events of Interest detected in Open Telemetry traces, through trace metrics, and Kubernetes metrics. This allows on-call staff, SREs and infrastructure engineers to correlate spikes at the service and Kubernetes layers to AWS infrastructure spikes to troubleshoot incidents faster. In addition, users can now drill into logs, traces and related dashboards for the next step in troubleshooting when viewing an Event of Interest on an entity.

Root Cause Explorer for Kubernetes metrics and OpenTelemetry traces

Global Intelligence for AWS CloudTrail DevOps (Updated)

March 8, 2021

Global Intelligence for AWS CloudTrail DevOps helps infrastructure engineers, on-call staff and DevOps users accelerate root cause analysis for incidents by providing error rate and configuration insights benchmarked from Sumo Logic’s AWS customers for nine AWS services: EC2, Lambda, Auto Scaling, S3, ELB, RDS, DynamoDB, ElastiCache and Redshift. The benchmarks are powered by more than 15 million data points per week from AWS CloudTrail logs for a few thousand Sumo Logic tenants across 27 AWS regions. The error benchmarks include:

  • Service Availability errors, where a particular AWS service (e.g. EC2) may be unavailable

  • Throttling errors, where AWS rate-limits API traffic from the customer’s application for a given service and API, for example, PutItem requests for AWS DynamoDB

  • Account Quota errors, where a customer may saturate account limits for a particular service and resource, for example, exceeding the 100 buckets per account limit of AWS S3

  • Insufficient capacity / out-of-stock errors where AWS is unable to provision resources of a particular specification in a given region, such as EC2 m4.xlarge instances in us-west-1

By comparing a given customer’s AWS error rate against other customers by AWS region, service, API, AWS account and instance types, Global Intelligence for AWS CloudTrail DevOps, helps identify if such errors might be the probable cause of an incident. In addition, the app provides configuration guidance for key AWS services based on settings common among other customers.

In this update, the application features Dashboard-New dashboards that are stack linked to AWS Observability at the account-region level, allowing in-context access to benchmarks during troubleshooting.

Global Intelligence for AWS CloudTrail DevOps (Updated)

Global Intelligence for Kubernetes DevOps

March 3, 2021

Benchmark your Kubernetes adoption journey against other customers using Global Intelligence for Kubernetes DevOps. Given the complexity of Kubernetes deployments, over 40% of containers are over provisioned for CPU and memory resulting in underutilized container resources and higher costs. Another 40% of containers are under-provisioned for CPU and memory resources leading to higher risk of out of memory or throttling errors and resulting downtime. Using CPU and memory usage and error baselines of several million containers, Global Intelligence for Kubernetes DevOps’ resource recommendations helps DevOps users and SREs eliminate guesswork and minimize risk and costs of their Kubernetes deployments.

Global Intelligence for Kubernetes DevOps

Global Intelligence for Nginx

March 3, 2021

Nginx is a web server that can be used as a reverse proxy, load balancer, mail proxy, and HTTP cache. Global Intelligence for Nginx App is a companion to the Nginx ULM application and helps DevOps and infrastructure engineers compare server golden signals (load, error and throughput) and visitor activity patterns associated with their Nginx servers against tens of thousands of Nginx servers that beacon their logs to Sumo Logic. Such comparisons can help diagnose or eliminate Nginx problems over the course of an incident arising from sub-optimal configurations of Nginx servers and unusual bot activity, response size, HTTP verb mix, client mix or backend issues.

Global Intelligence for Nginx

Chart Units in Dashboard (New)

February 27, 2021

Dashboard (New) is all about visual control! We’re happy to announce that you can now add units to your charts to make them even easier to consume. With the updated chart units on dashboard panels, you can select a base unit and the chart will auto-adjust the unit as the numbers scale, making the data immediately understandable.


Chart Units in Dashboard (New)

Kubernetes App Updates & OOTB Alerts

February 24, 2021

The Kubernetes App has been updated to have more entity driven views, and a cleaner, easier to understand set of dashboards. In addition to the dashboards, this release includes OOTB alerts you can use to get going on your Kubernetes monitoring journey.

Kubernetes App Updates & OOTB Alerts

The Sumo Logic App for Microsoft Teams

February 23, 2021

The Sumo Logic app for Microsoft Teams provides your IT Operations, security and compliance teams out-of-the-box dashboards to ensure that security policies are being followed by monitoring user sessions, login activity, administrative activity, client browsers used and bots installed. In addition, these dashboards detect incoming threats via Sumo Logic Threat Intel and minimize and prevent breaches by analyzing user activity patterns.

The Sumo Logic App for Microsoft Teams

Microsoft Teams Connection

February 23, 2021

With this new connection, you can now start getting alert notifications within MS Teams with minimal setup. Sumo Logic provides a pre-built template so you just have to provide the channel name to start getting notifications. Furthermore, you can also get notified in MS Teams, when alerts are automatically resolved within Sumo Logic.

Microsoft Teams Connection

Root Cause Explorer Updates

February 5, 2021

Root Cause Explorer has now been enhanced with support for AWS SNS and SQS namespaces. This allows users to correlate Events of Interest related to SNS and SQS with other parts of an AWS stack to diagnose incidents. In addition, the Top Contributing Entities panel is redesigned for better readability. The Events of Interest detail panel is now redesigned to show time series data in the first tab avoiding an additional click to view time series data in a separate tab. The entity inspector also replaces the Related tab to access logs and dashboards related to the entity in focus. Lastly, Root Cause Explorer now supports cause-impact analysis driven by AWS X-ray traces augmented by an inferred service map.

Root Cause Explorer Updates

AWS Observability Updates

February 5, 2021

We are excited to announce support for ECS, ElastiCache and Network Load Balancers as well as 30+ out-of-the-box alerts for all supported services. As part of this release we have documented changes included in each version of our CloudFormation installation template, which will help you understand when to upgrade.

AWS Observability Updates

Dark Theme for Dashboard (New)

January 16, 2021

Dashboard (New) now supports a dark style theme for dashboards. Dark Theme makes dashboards pop by putting light colored visualizations and text on top of a darker background. This enables you to build gorgeous dashboards with eye catching contrast. Dark Theme is now GA for all dashboards, and can be opted into at any time by switching the theme setting on any Dashboard (New) dashboard.

Dark Theme for Dashboard (New)

Dig deeper into Sumo Logic

river lines K8s Tile Cover

Kubernetes Observability ebook

Monitoring, troubleshooting and securing Kubernetes with Sumo Logic.

river lines Ci report foreground 1

Continuous Intelligence Report

Get the first and only industry report that quantitatively defines the state of the modern application stack and its implication to the growing technology, process and culture shift amongst enterprises adopting Cloud and DevSecOps.