Deep visibility into the operations of your Apache web servers
Monitor web server operations
Monitor errors, web server operations and resource utilization.
Identify Outliers
Outlier Analytics from Sumo Logic enable you to automatically detect outliers in the operations of your Apache web servers and take corrective actions if needed.
Monitor usage patterns
Monitor visitor locations, access types and traffic patterns to understand key usage patterns, bottlenecks and improve website performance
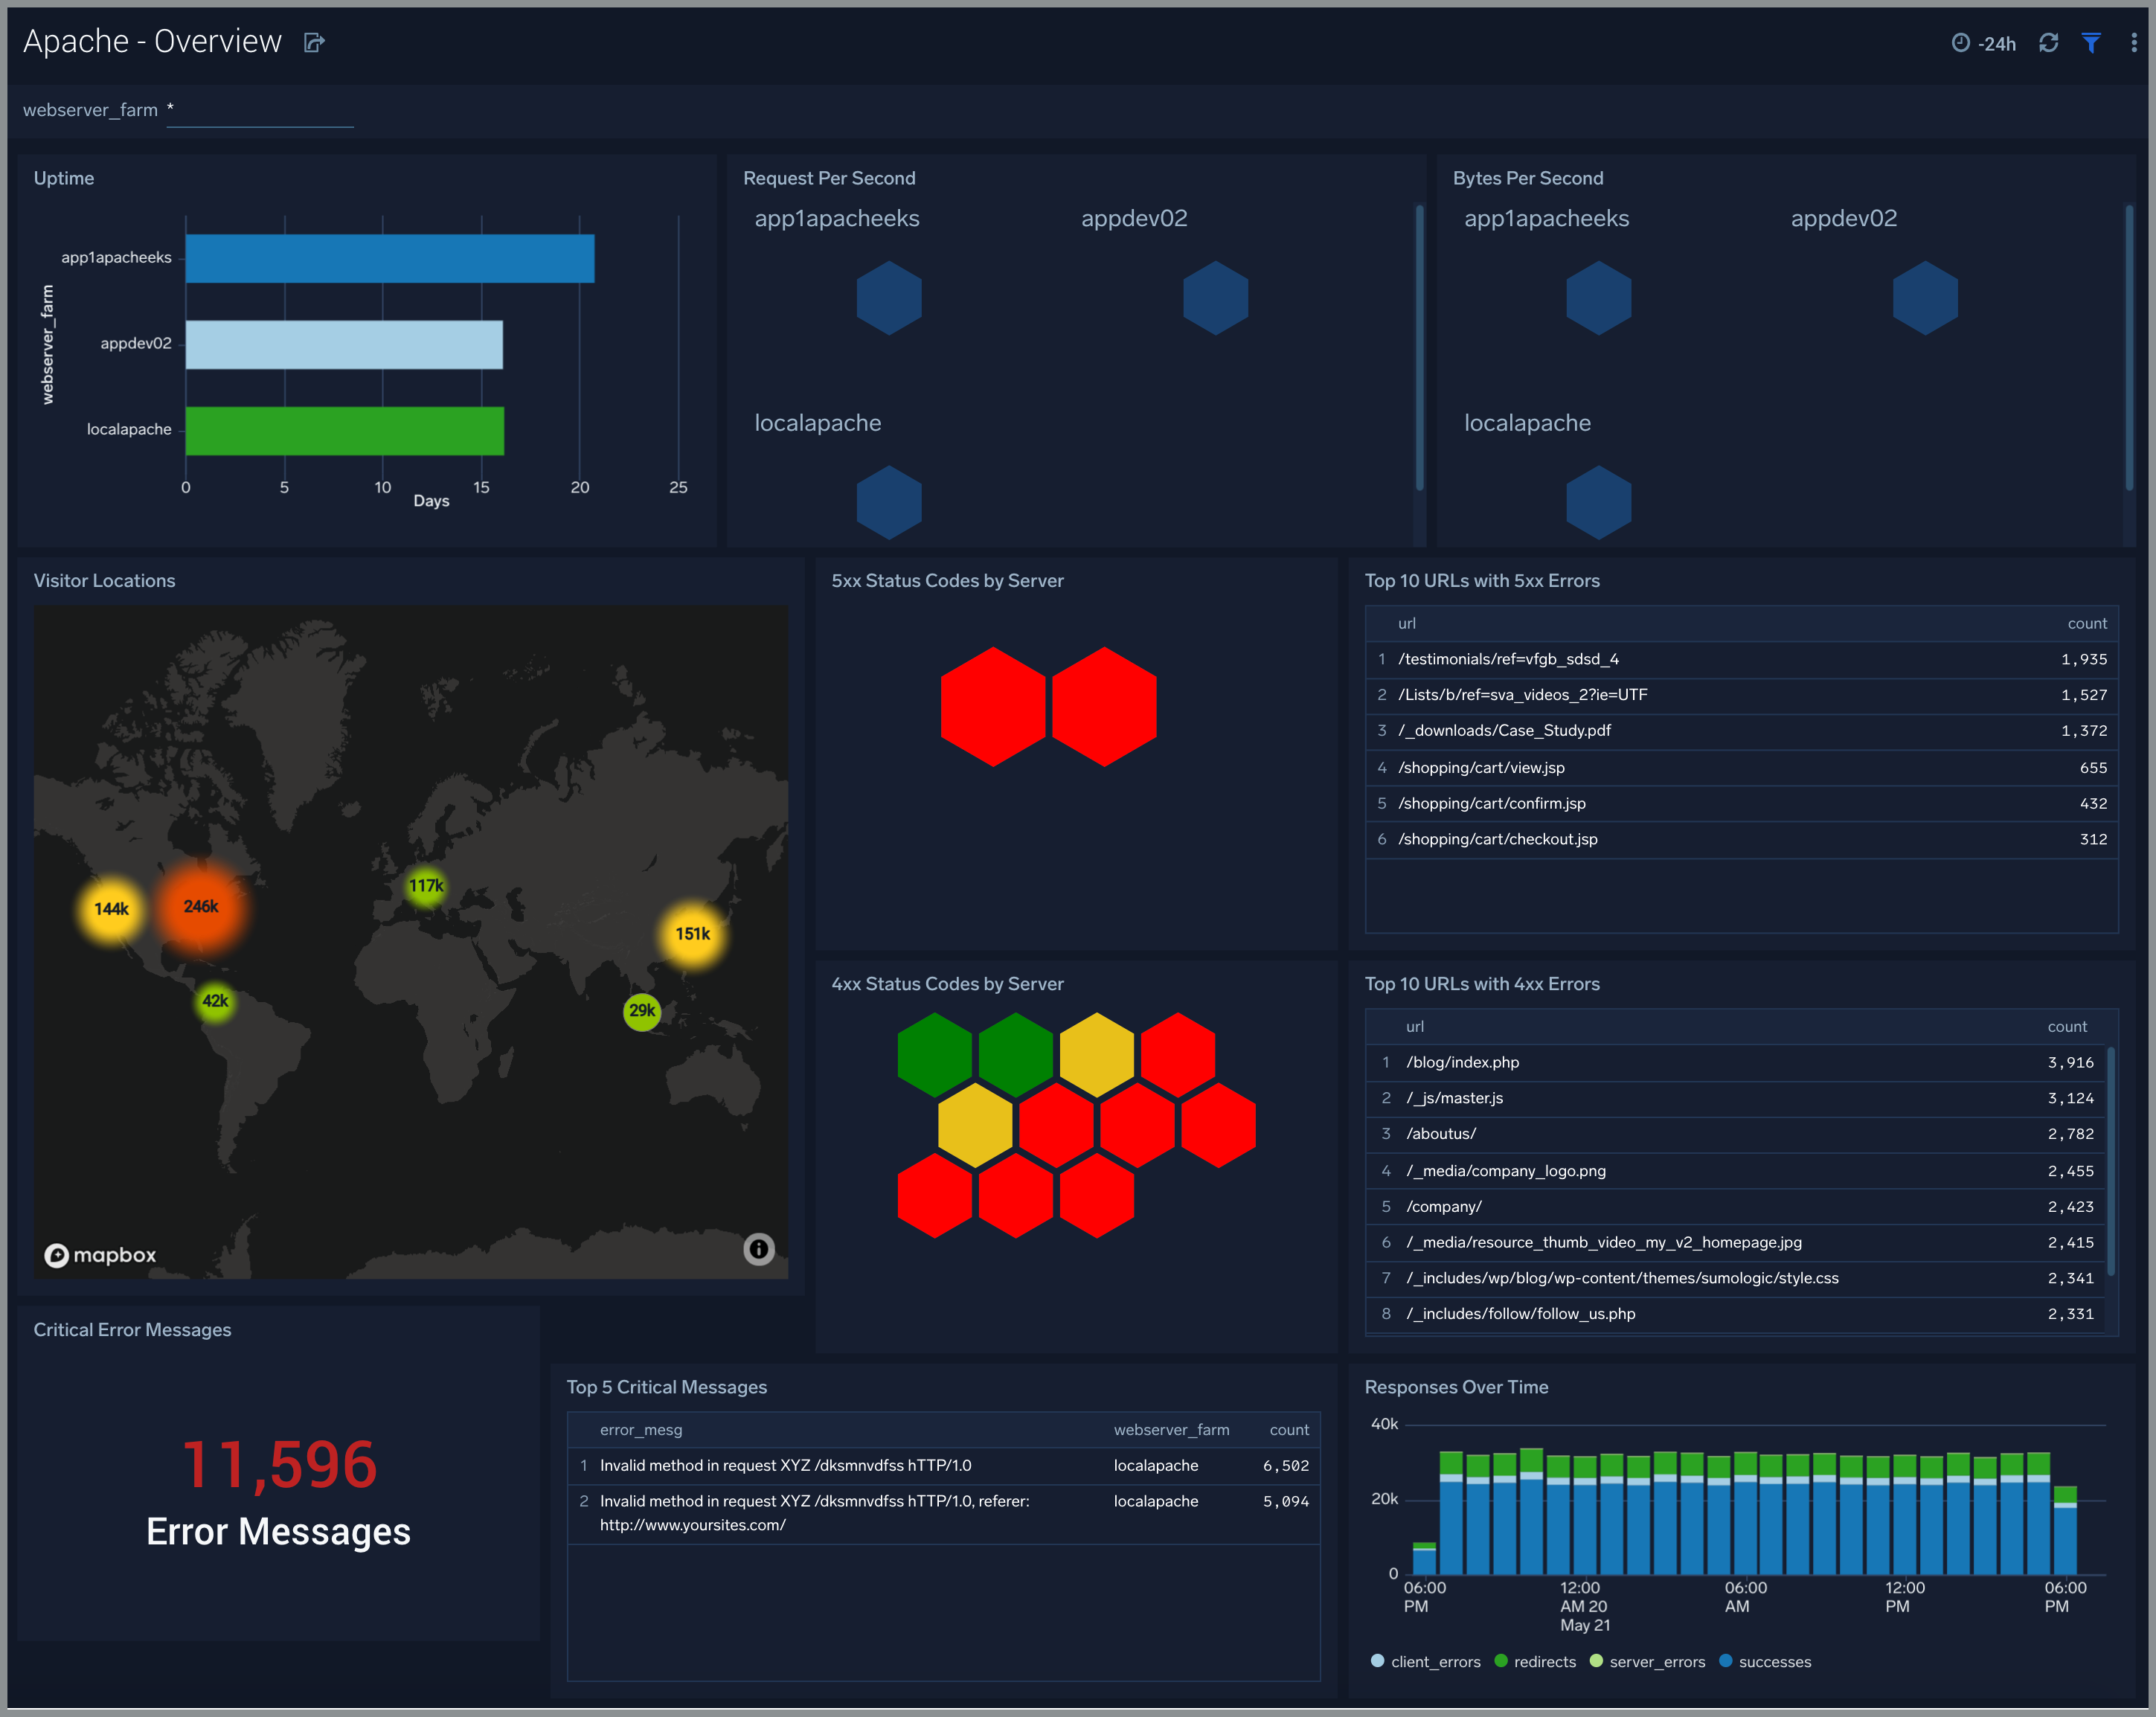
Monitor web server operations
The Apache – Overview Dashboard provides an at-a-glance view of the activity and health of the Apache web server farms, and servers by monitoring uptime, requests, response, traffic, visitor geographic locations, and critical error messages.
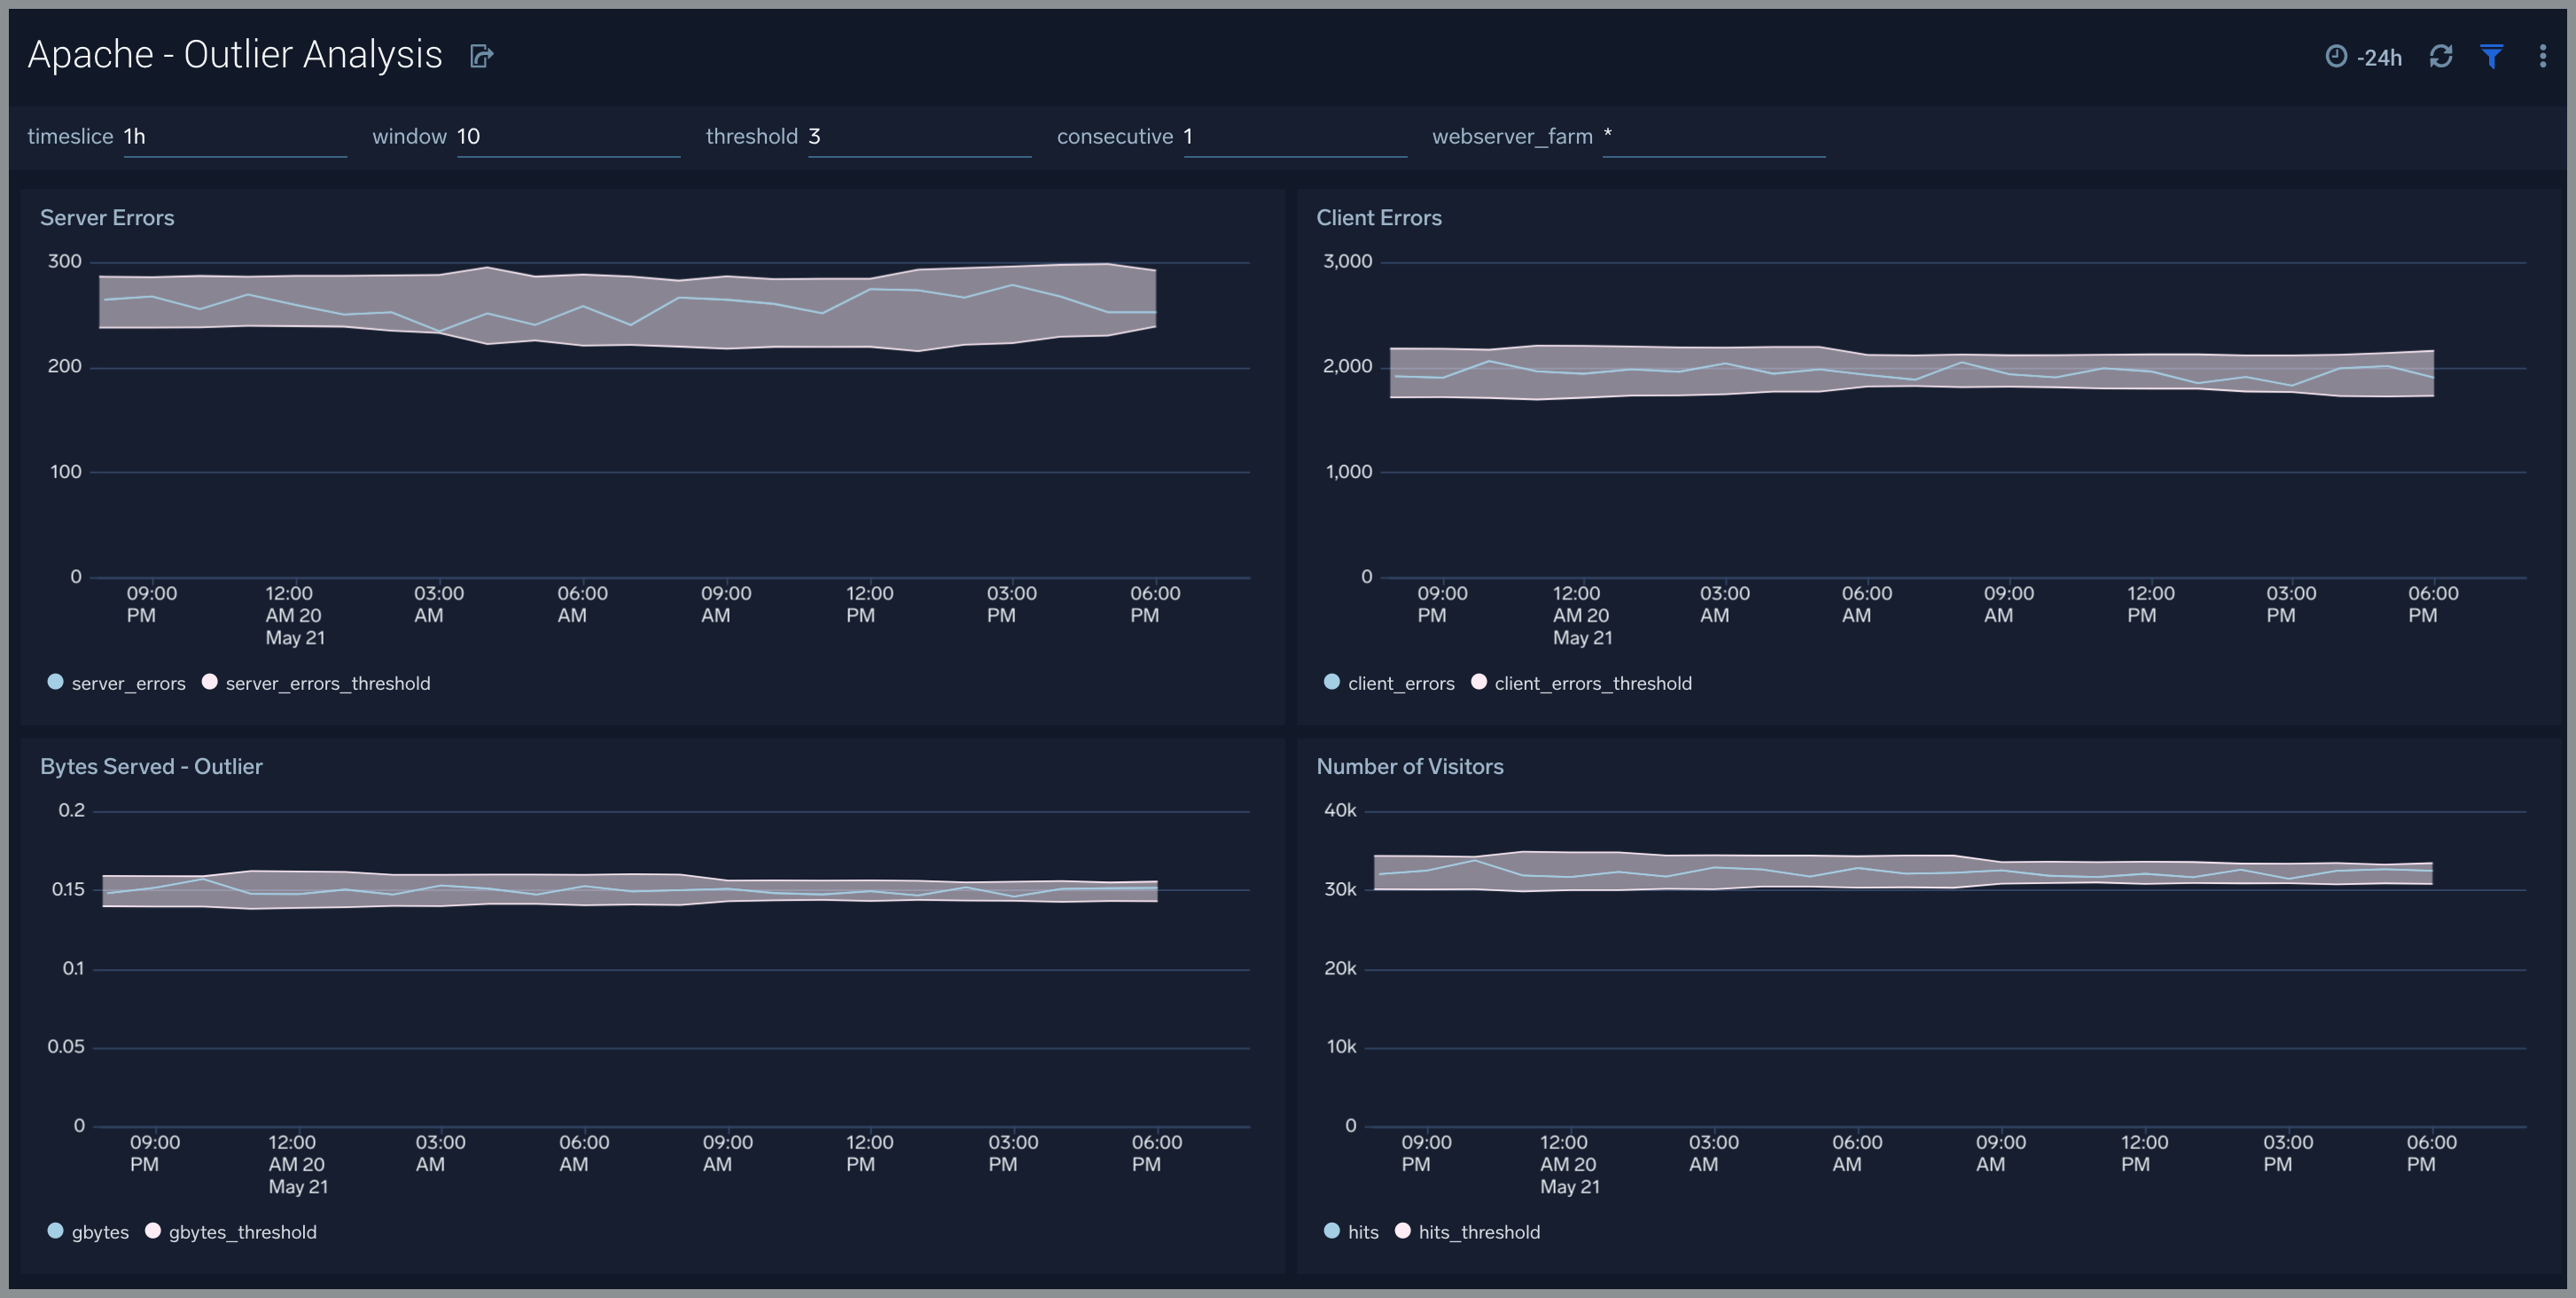
Outlier Analysis
The Apache – Outlier Analysis dashboard helps you quickly identify outliers for key Apache metrics such bytes served, number of visitors, server errors, and client errors.
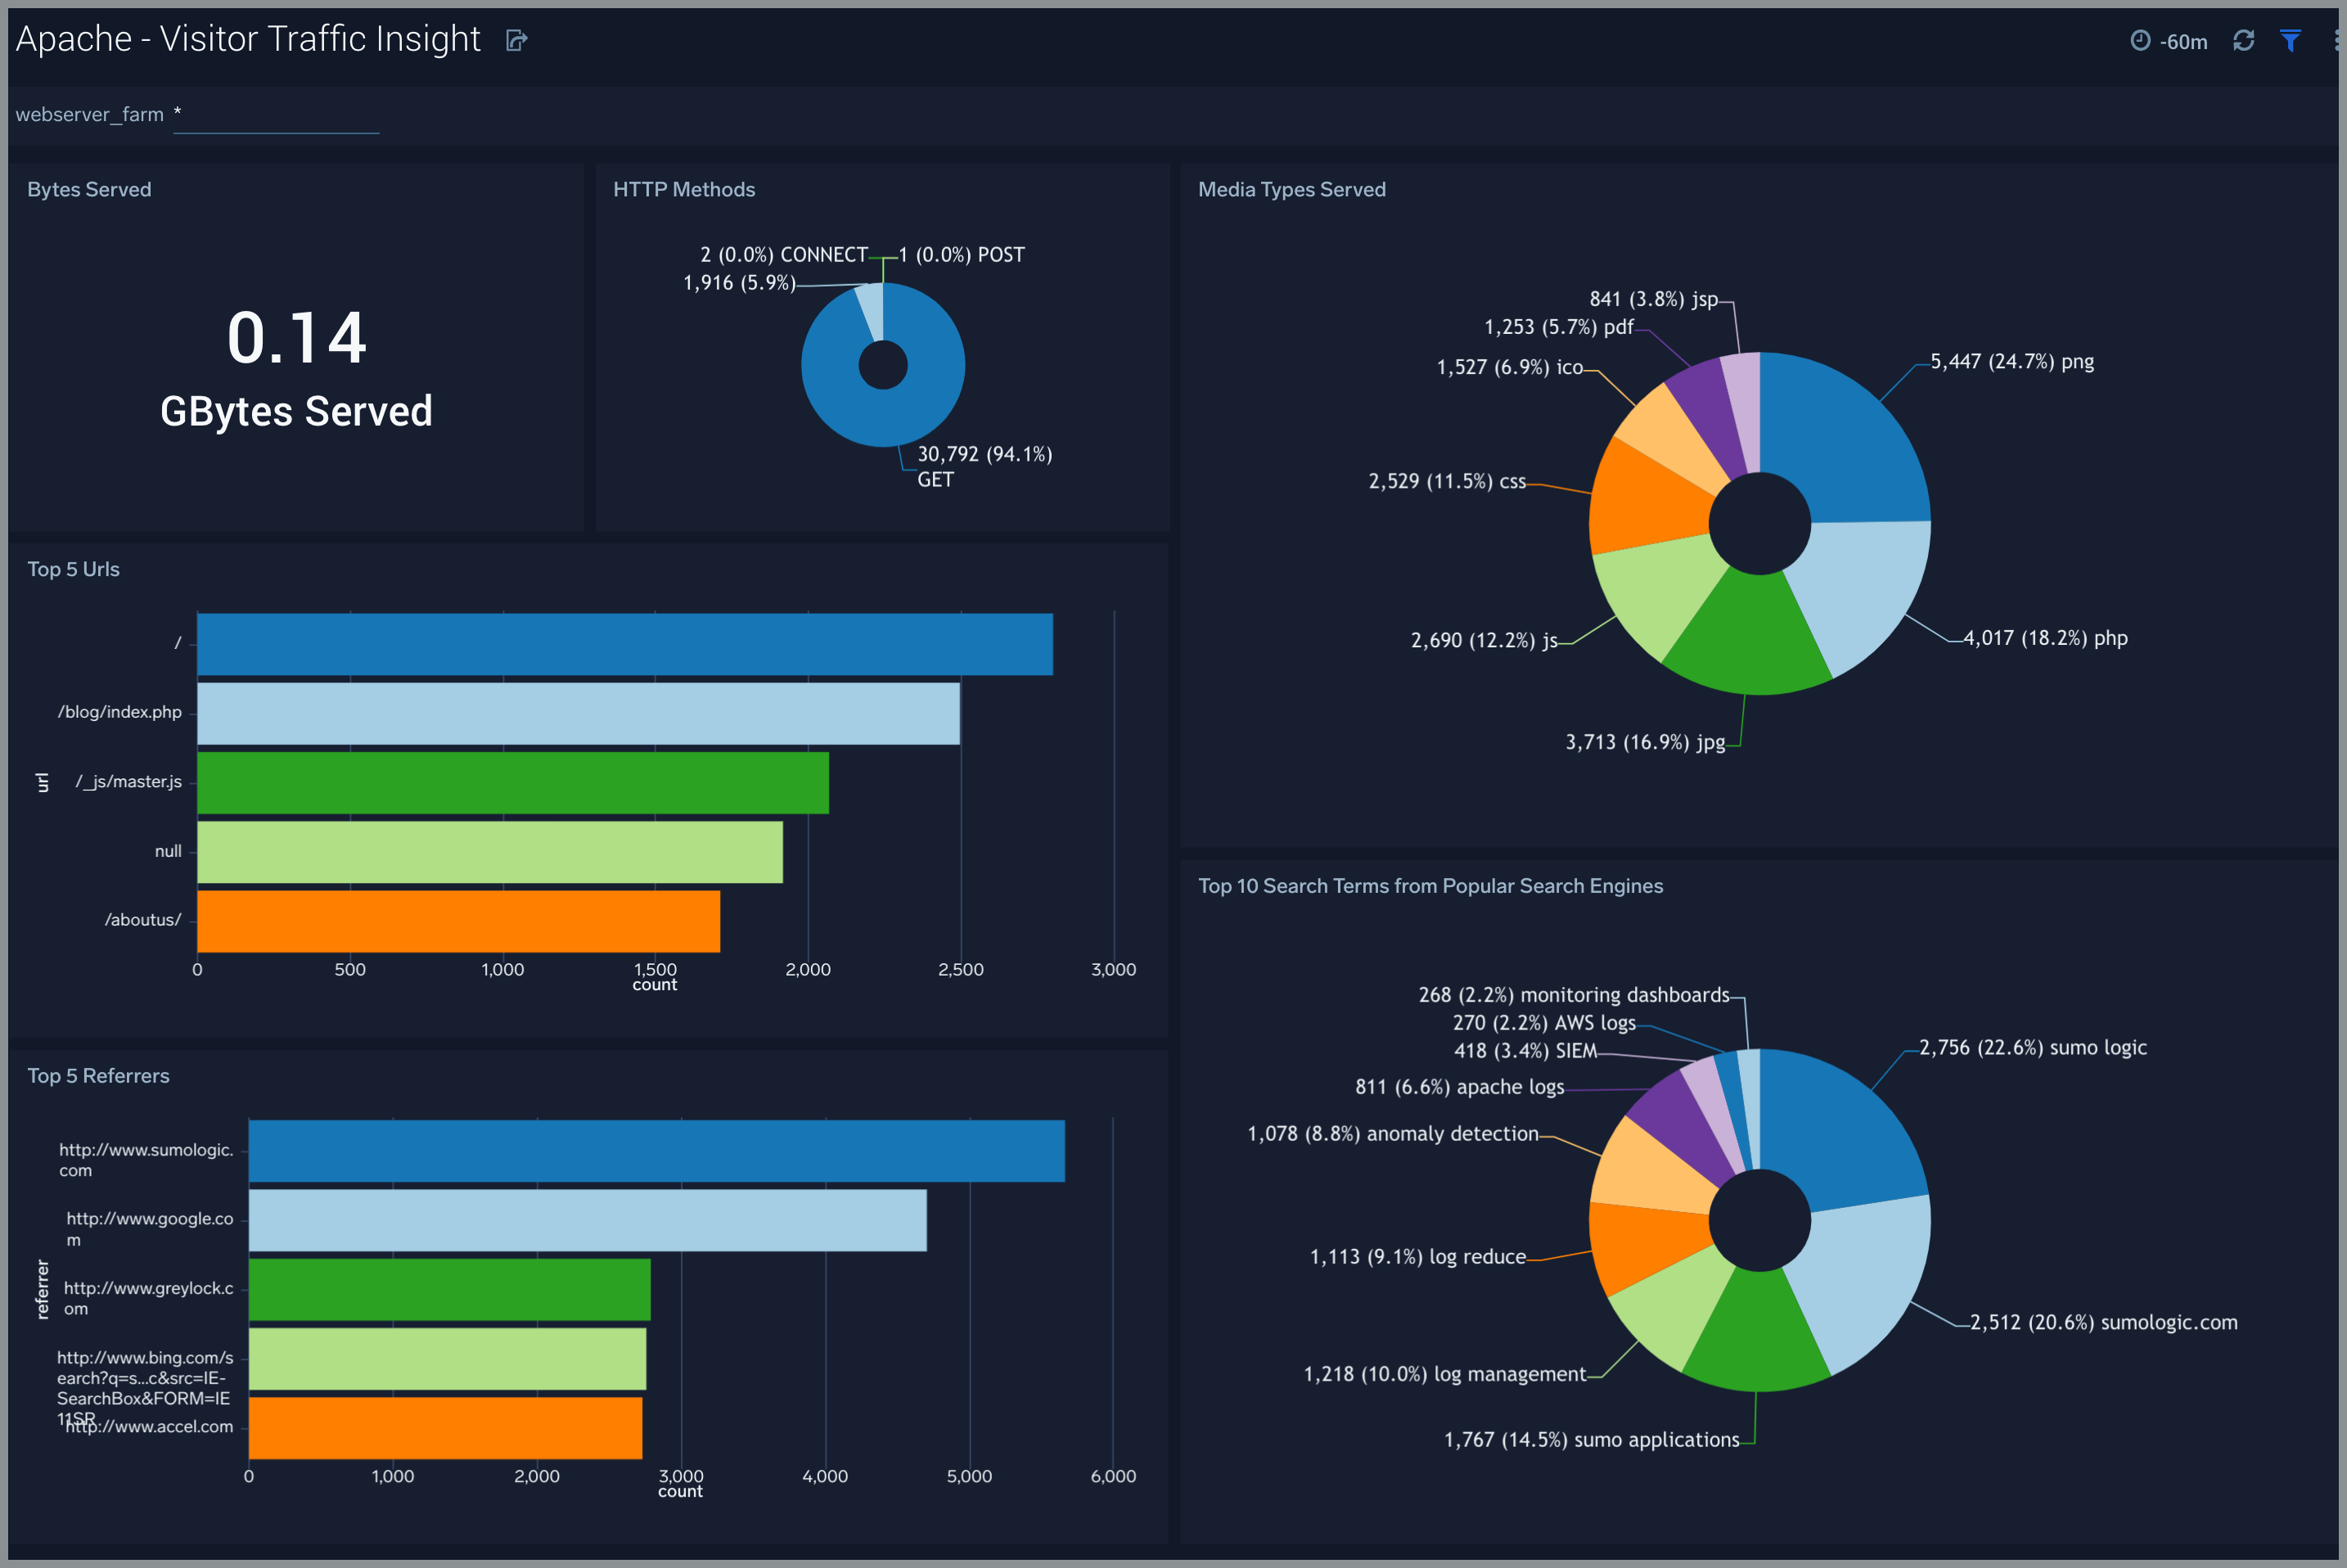
Visitor Insights
The Apache – Visitor Traffic Insight dashboard provides summarized information on the top URLs, referrers, search terms, and media types served.
Log analysis customized for your Apache access
When you start realizing the value Apache logs can provide to you and your operations team, there are three steps you can take to get the most value from your Apache access logs:
Get your logs into one place: Sumo Logic provides lots of different ways to do this.
Jump-start your implementation: Getting started with log analysis can be difficult to do if you haven’t done it before. Sumo Logic provides an Apache application with built-in best practices that provides easy-to-use dashboards and sample searches to get you started quickly.
Decide what is most important to you: You can’t improve what you can’t measure, and you can’t measure it if you don’t know what “it” is. Now that you have the data and you know how to extract value, look at the most important metrics for your business.
Learn how to customize Sumo Logic for your Apache server environment in our documentation.
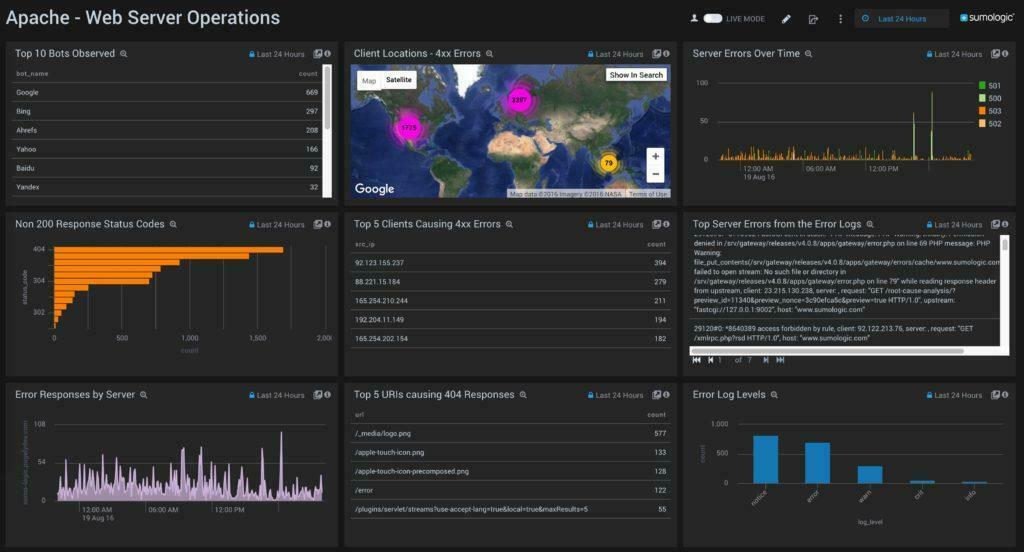
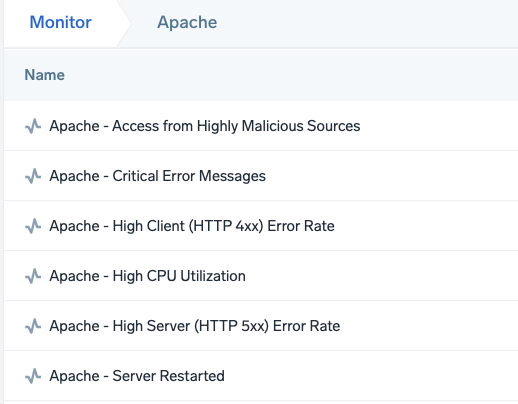
Apache Alerts
Pre-packaged Sumo Logic alerts help you monitor your Apache web servers, are based on Sumo Logic monitors, leverage metrics and logs, and include preset thresholds for critical error messages, 4XX/5XX error rates, resource utilization, and access from known malicious sources.


