Analyze Tomcat server health, performance, and client responses to optimize your customer experience
Tomcat Server Health
Get instant insight into the health of your Tomcat application server operations by visualizing key metrics and logs
Optimize Tomcat servers
Optimize web resources and identify misbehaving bots to speed up response times.
Track usage patterns
Track user behavior to understand key bottlenecks to improve your data center location strategy and identify requests from known malicious users.

Server Health
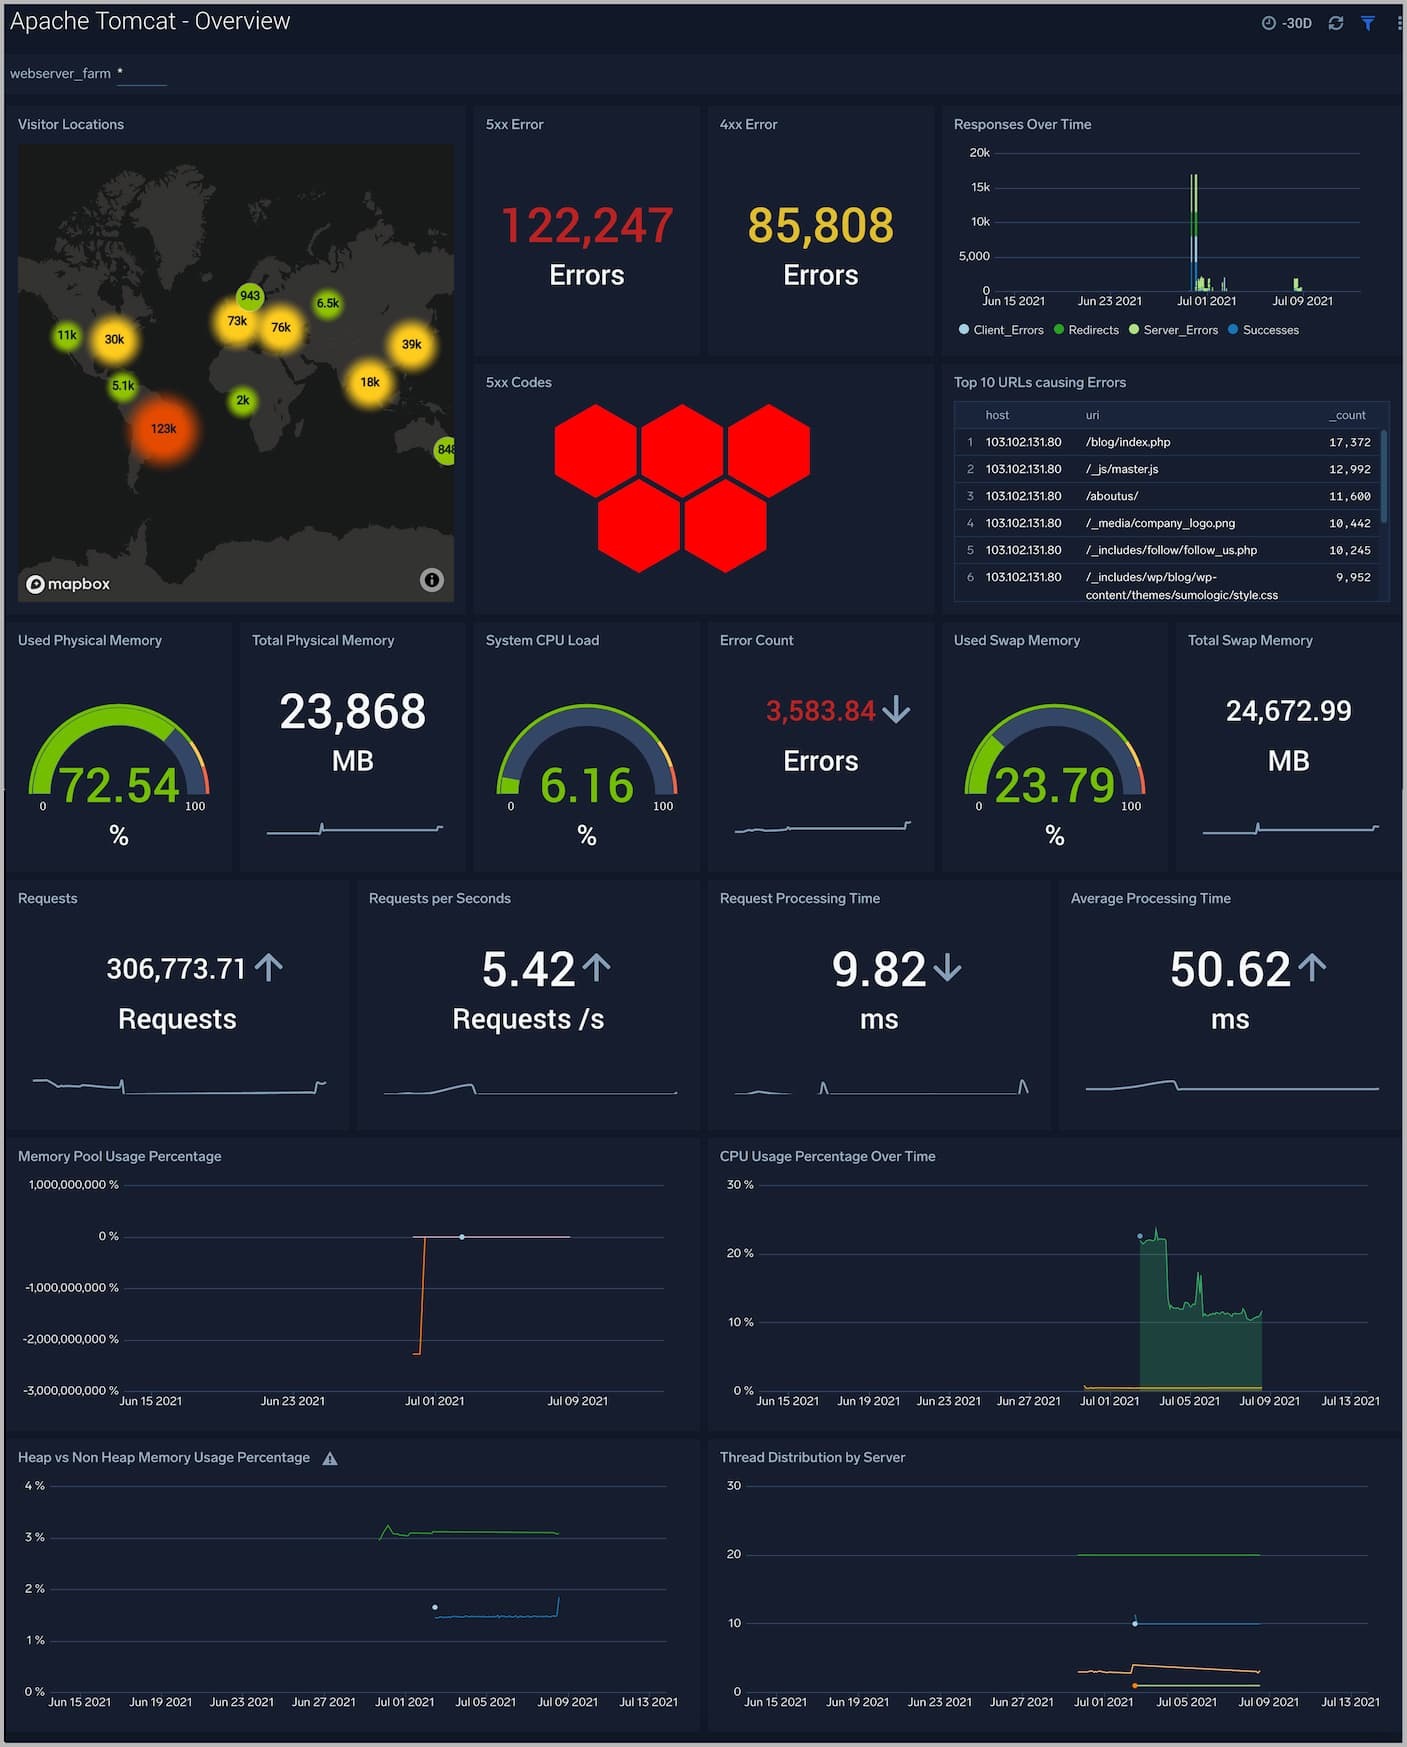
The Apache Tomcat – Overview Dashboard provides a high-level view of the activity and health of Tomcat servers on your network. Dashboard panels display visual graphs and detailed information on visitor geographic locations, traffic volume and distribution, responses over time, as well as time comparisons for visitor locations and CPU memory.
Server Operations
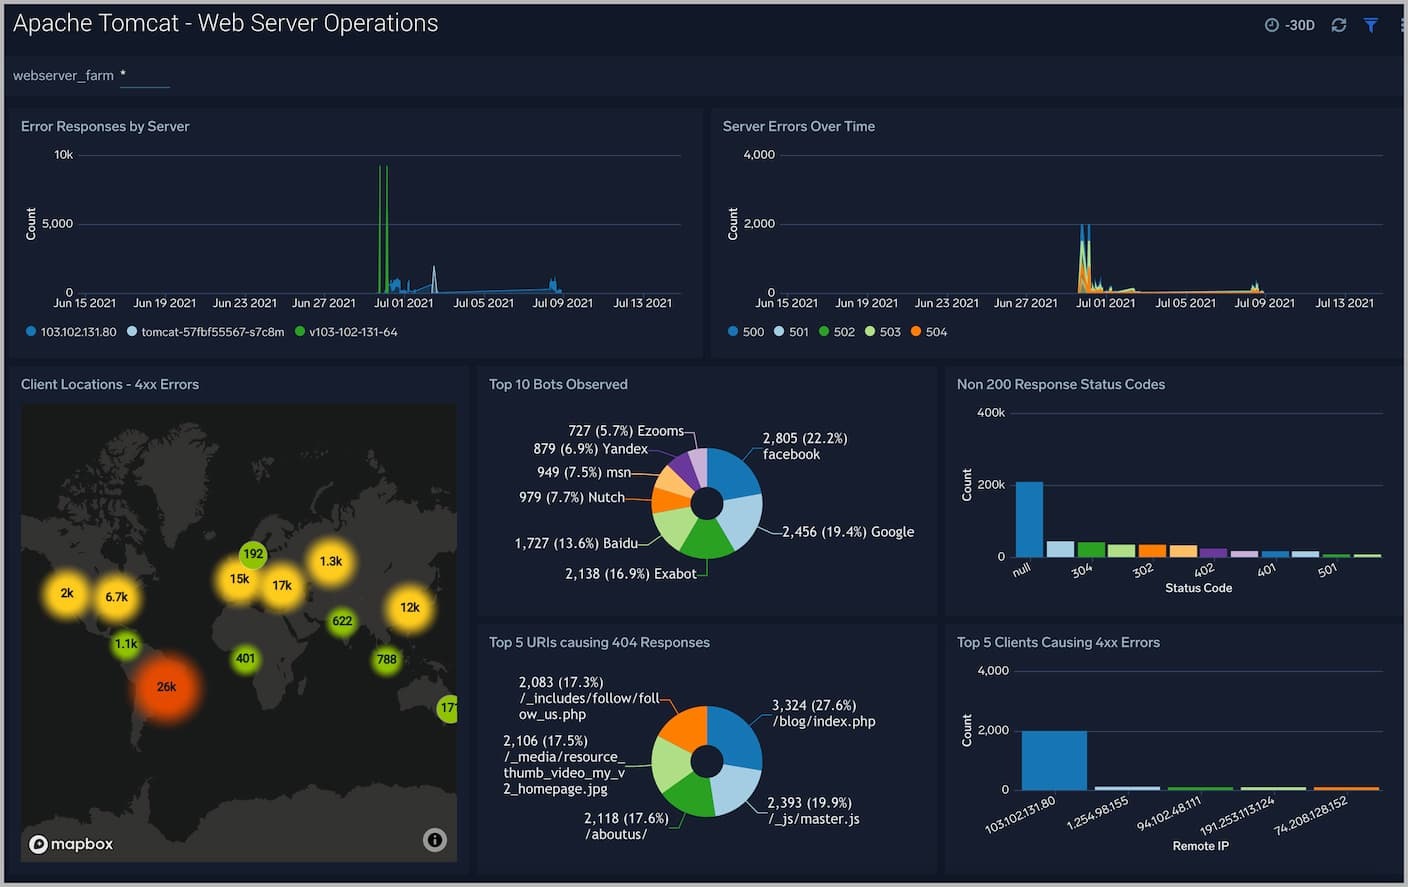
The Apache Tomcat – Web Server Operations Dashboard provides a high-level view combined with detailed information on the top ten bots, geographic locations and data for clients with high error rates, server errors over time, and non 200 response code status codes. Dashboard panels also show information on server error logs, error log levels, error responses by server, and the top URIs responsible for 404 responses.


Visitor Insight
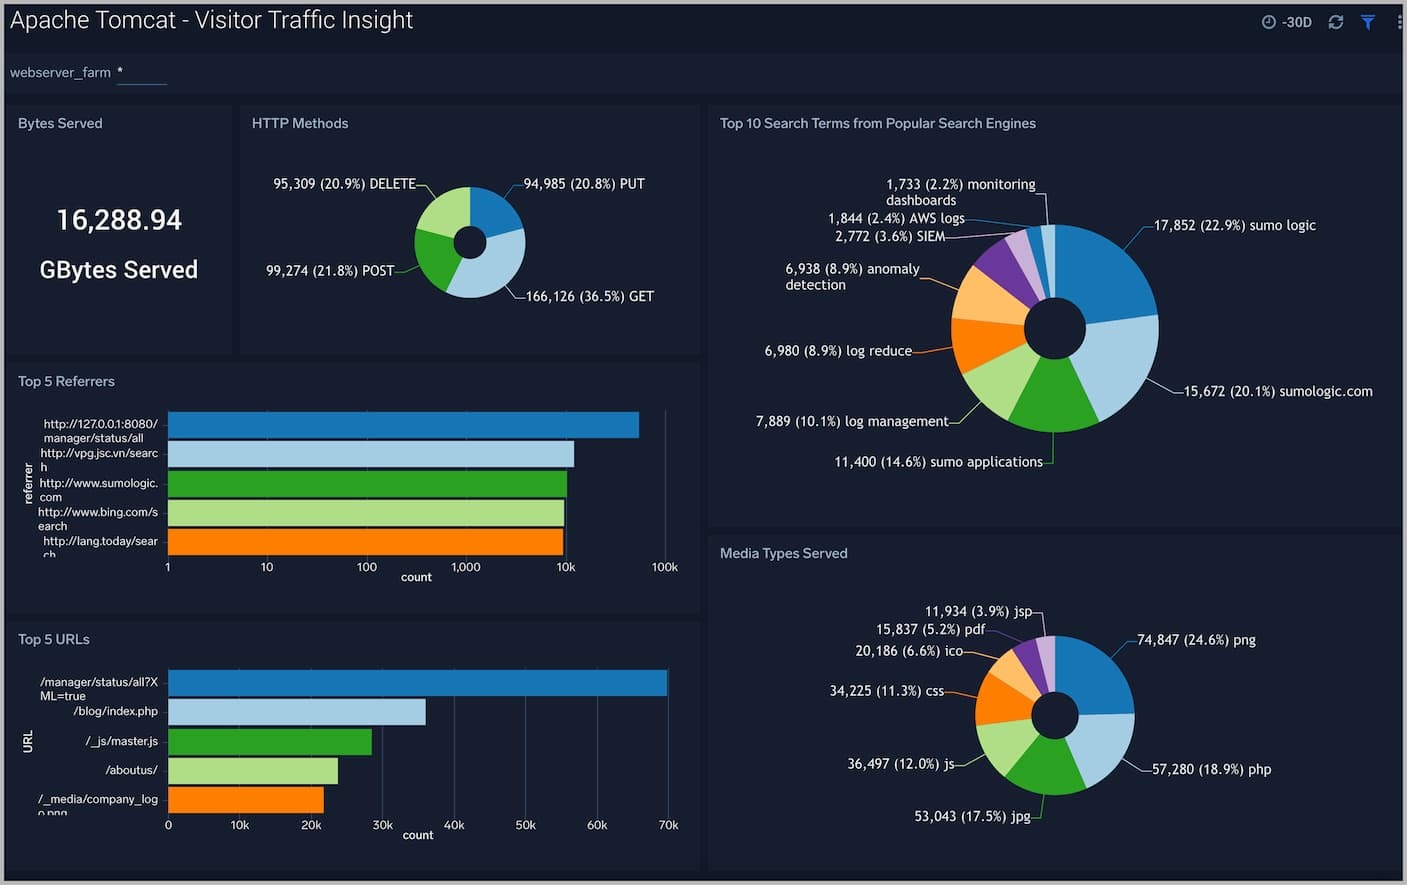
The Apache Tomcat – Visitor Traffic Insight Dashboard provides detailed information on the top documents accessed, top referrers, top search terms from popular search engines, and the media types served.
Tomcat Alerts
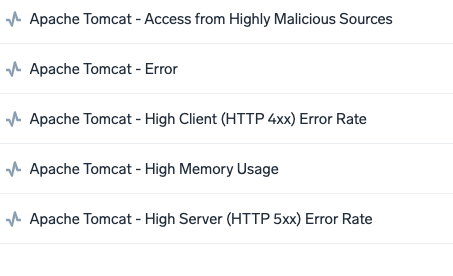
Pre-packaged Sumo Logic alerts help you monitor your Tomcat app servers are based on Sumo Logic monitors, leverage metrics and logs and include preset thresholds for high memory usage, access from known malicious sources and 4xx and 5xx errors.

Troubleshooting Modern Applications with Sumo Logic
Check out this demo to learn more about how Sumo Logic’s advanced analytics enable you to visualize issues and respond faster than ever.

