Deep visibility into the operations of your MySQL clusters
Comprehensive Database Cluster Monitoring
Get instant insight into database cluster operations by visualizing key metrics and logs

Query Performance Monitoring
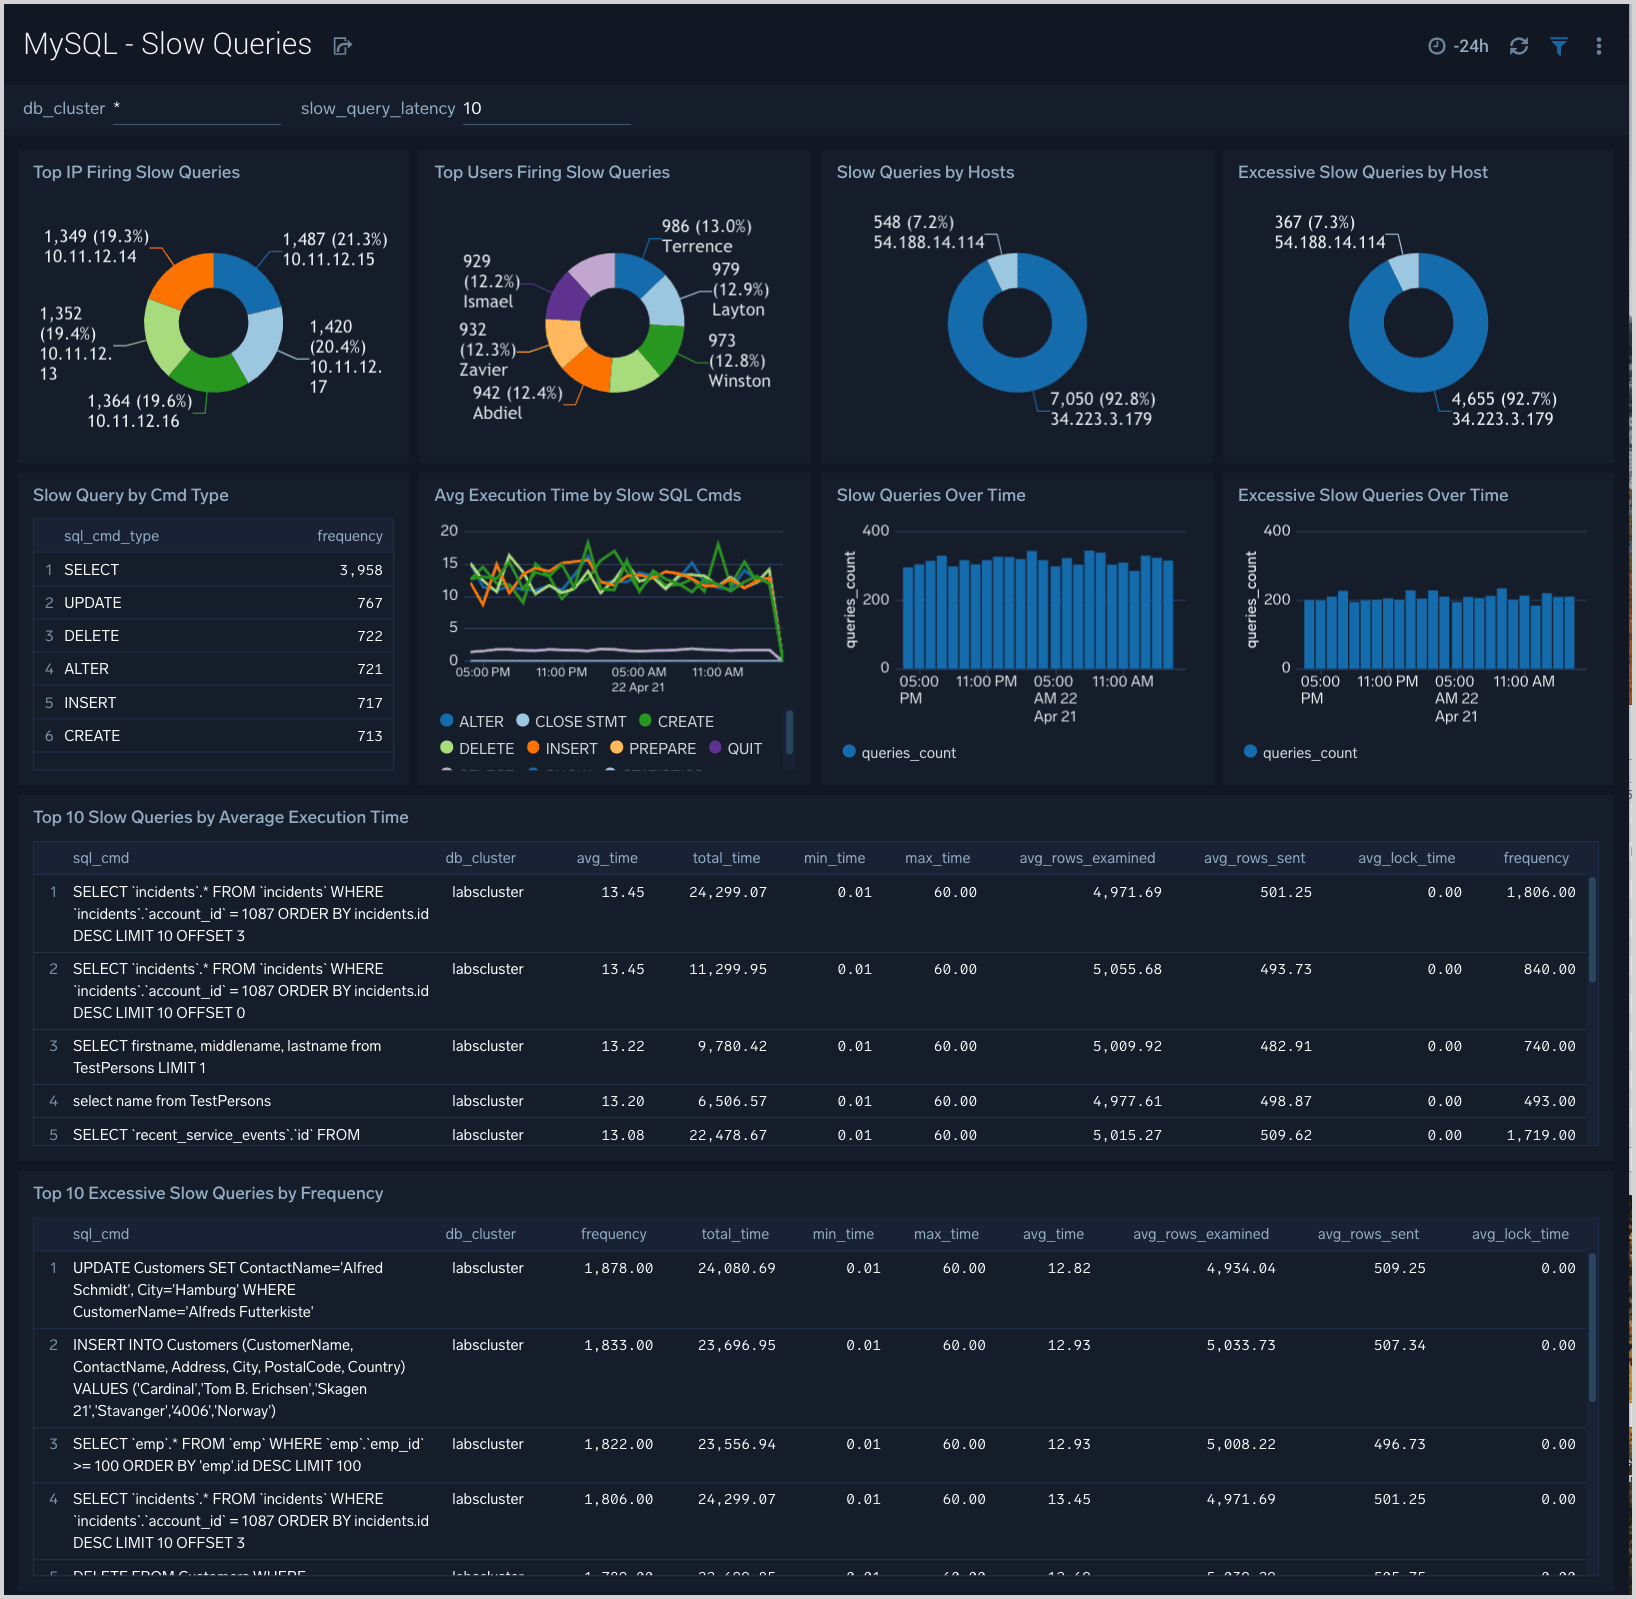
Get detailed insight into slow queries and query performance in general to optimize database performance
Fast Troubleshooting
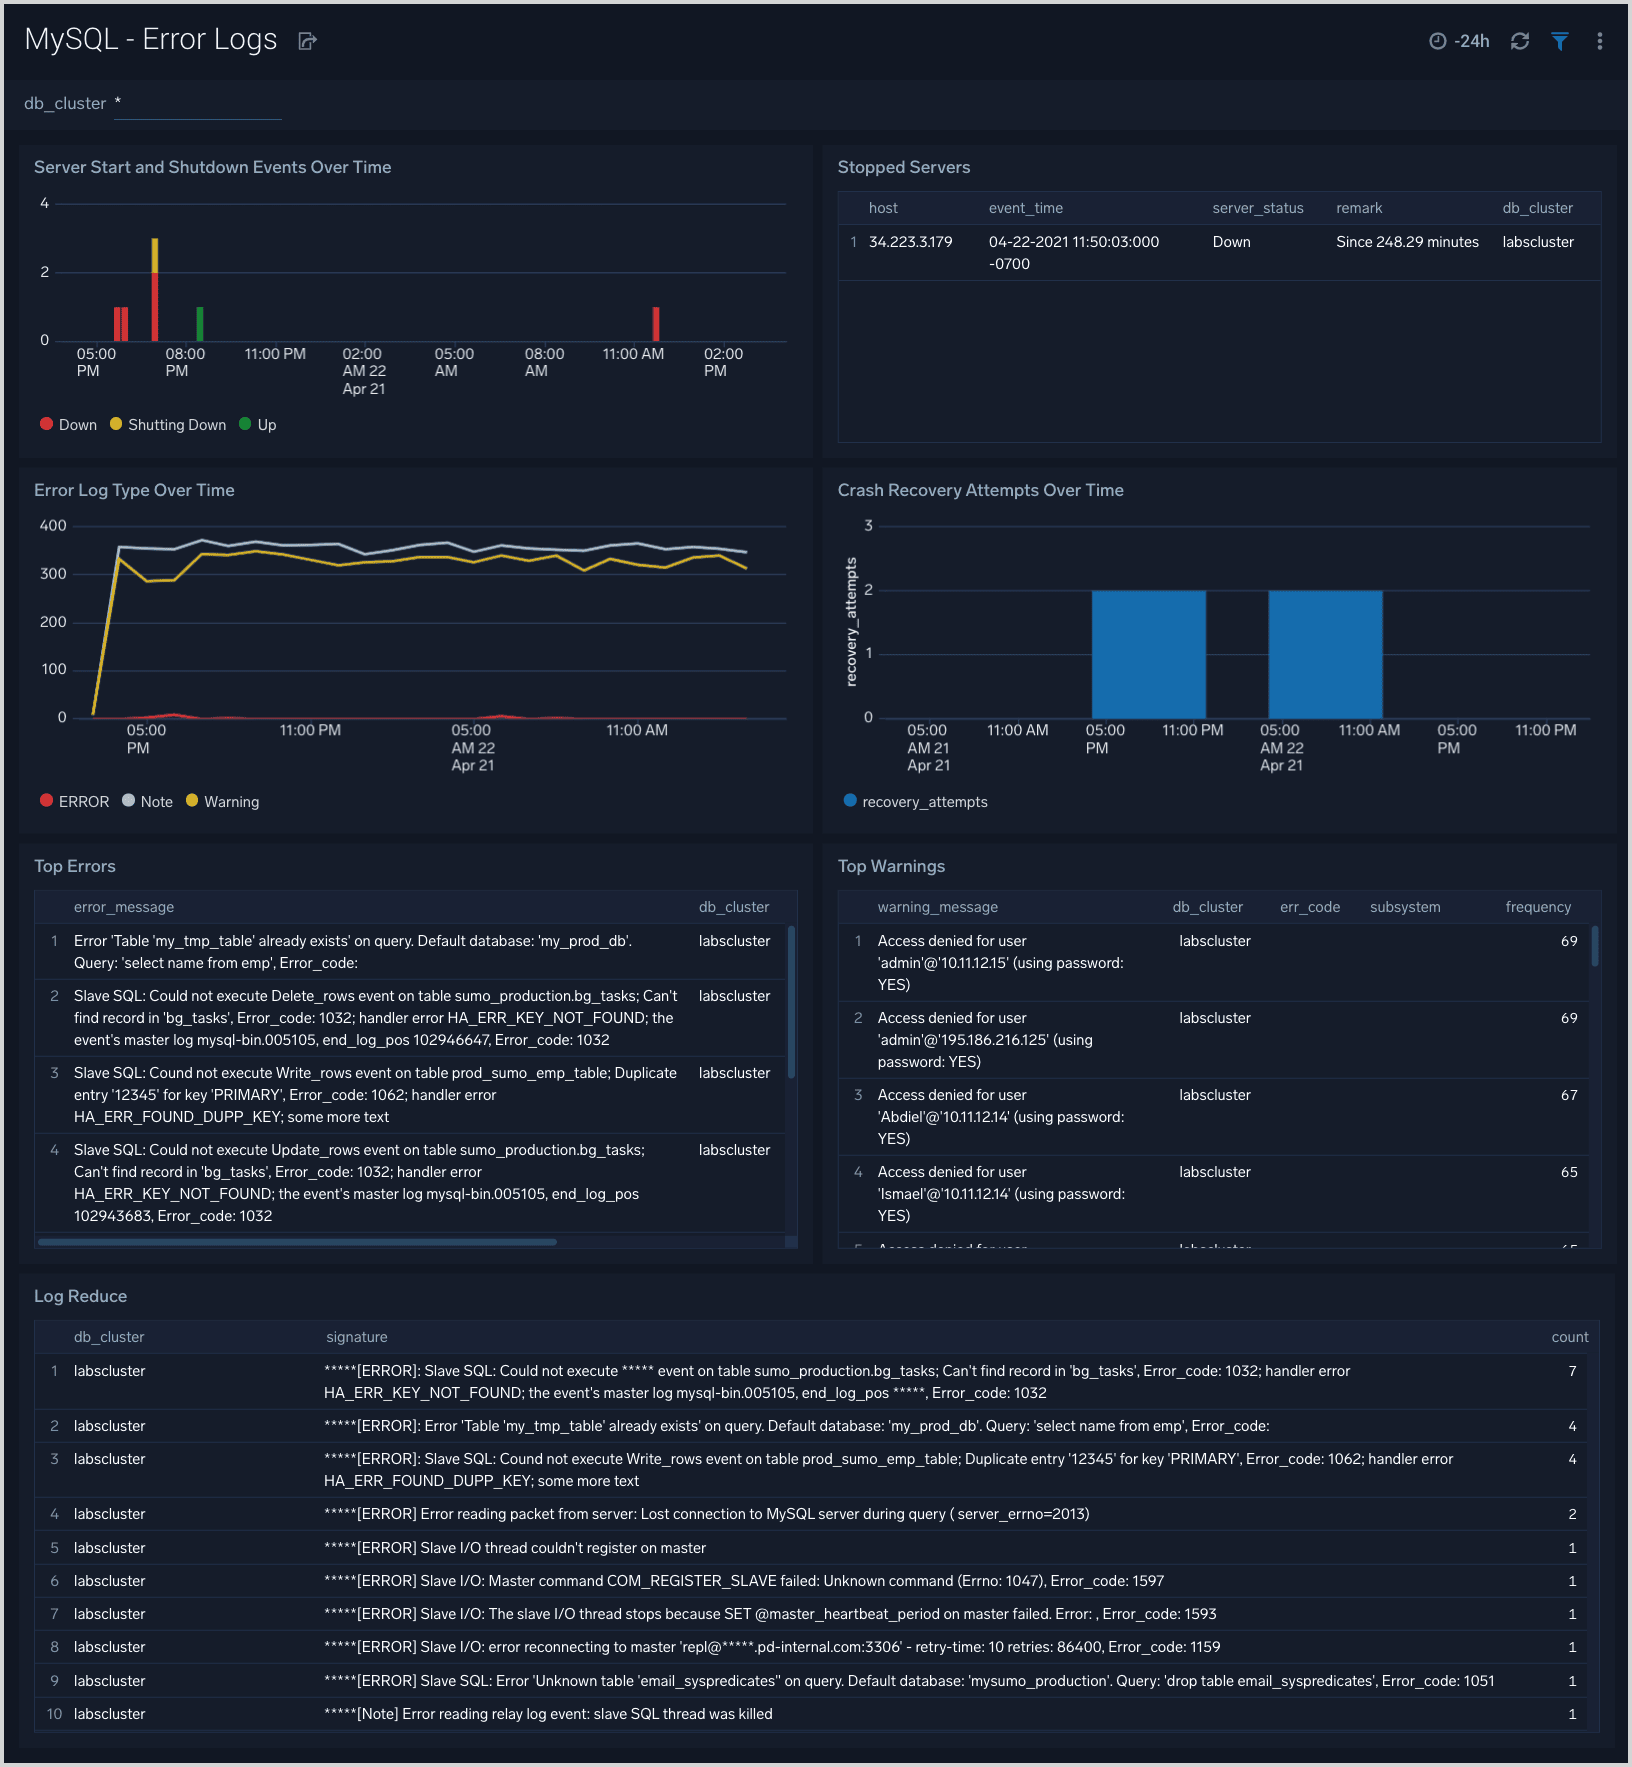
Quickly analyze patterns in MySQL error logs for fast troubleshooting

Database Cluster Monitoring
Dashboards give you instant insight into the state of your database clusters by monitoring key cluster information such as errors, failed logins, queries executed, slow queries, lock waits, uptime and more.
Query Performance Monitoring
The Slow Queries dashboard shows all slow queries executed on the database along with critical information like slow SQL commands, users and hosts running slow queries and trends over time


Fast Troubleshooting
The Error Logs dashboard provides insight into database error logs by specifically monitoring database shutdown/start events, errors over time, errors, warnings and crash recovery attempts to enable fast troubleshooting.
MySQL Alerts
Pre-packaged Sumo Logic alerts help you monitor your MySQL cluster, are based on Sumo Logic monitors, leverage metrics and logs, and include preset thresholds for connections, query run times, slow queries, resource utilization, errors, and other critical conditions.


