Deep Visibility into the operations of your PostgreSQL clusters

Comprehensive Database Cluster Monitoring
Get instant insight into database cluster operations by visualizing key metrics and logs
Query Performance Monitoring
Get detailed insight into slow queries and query performance in general to optimize database performance
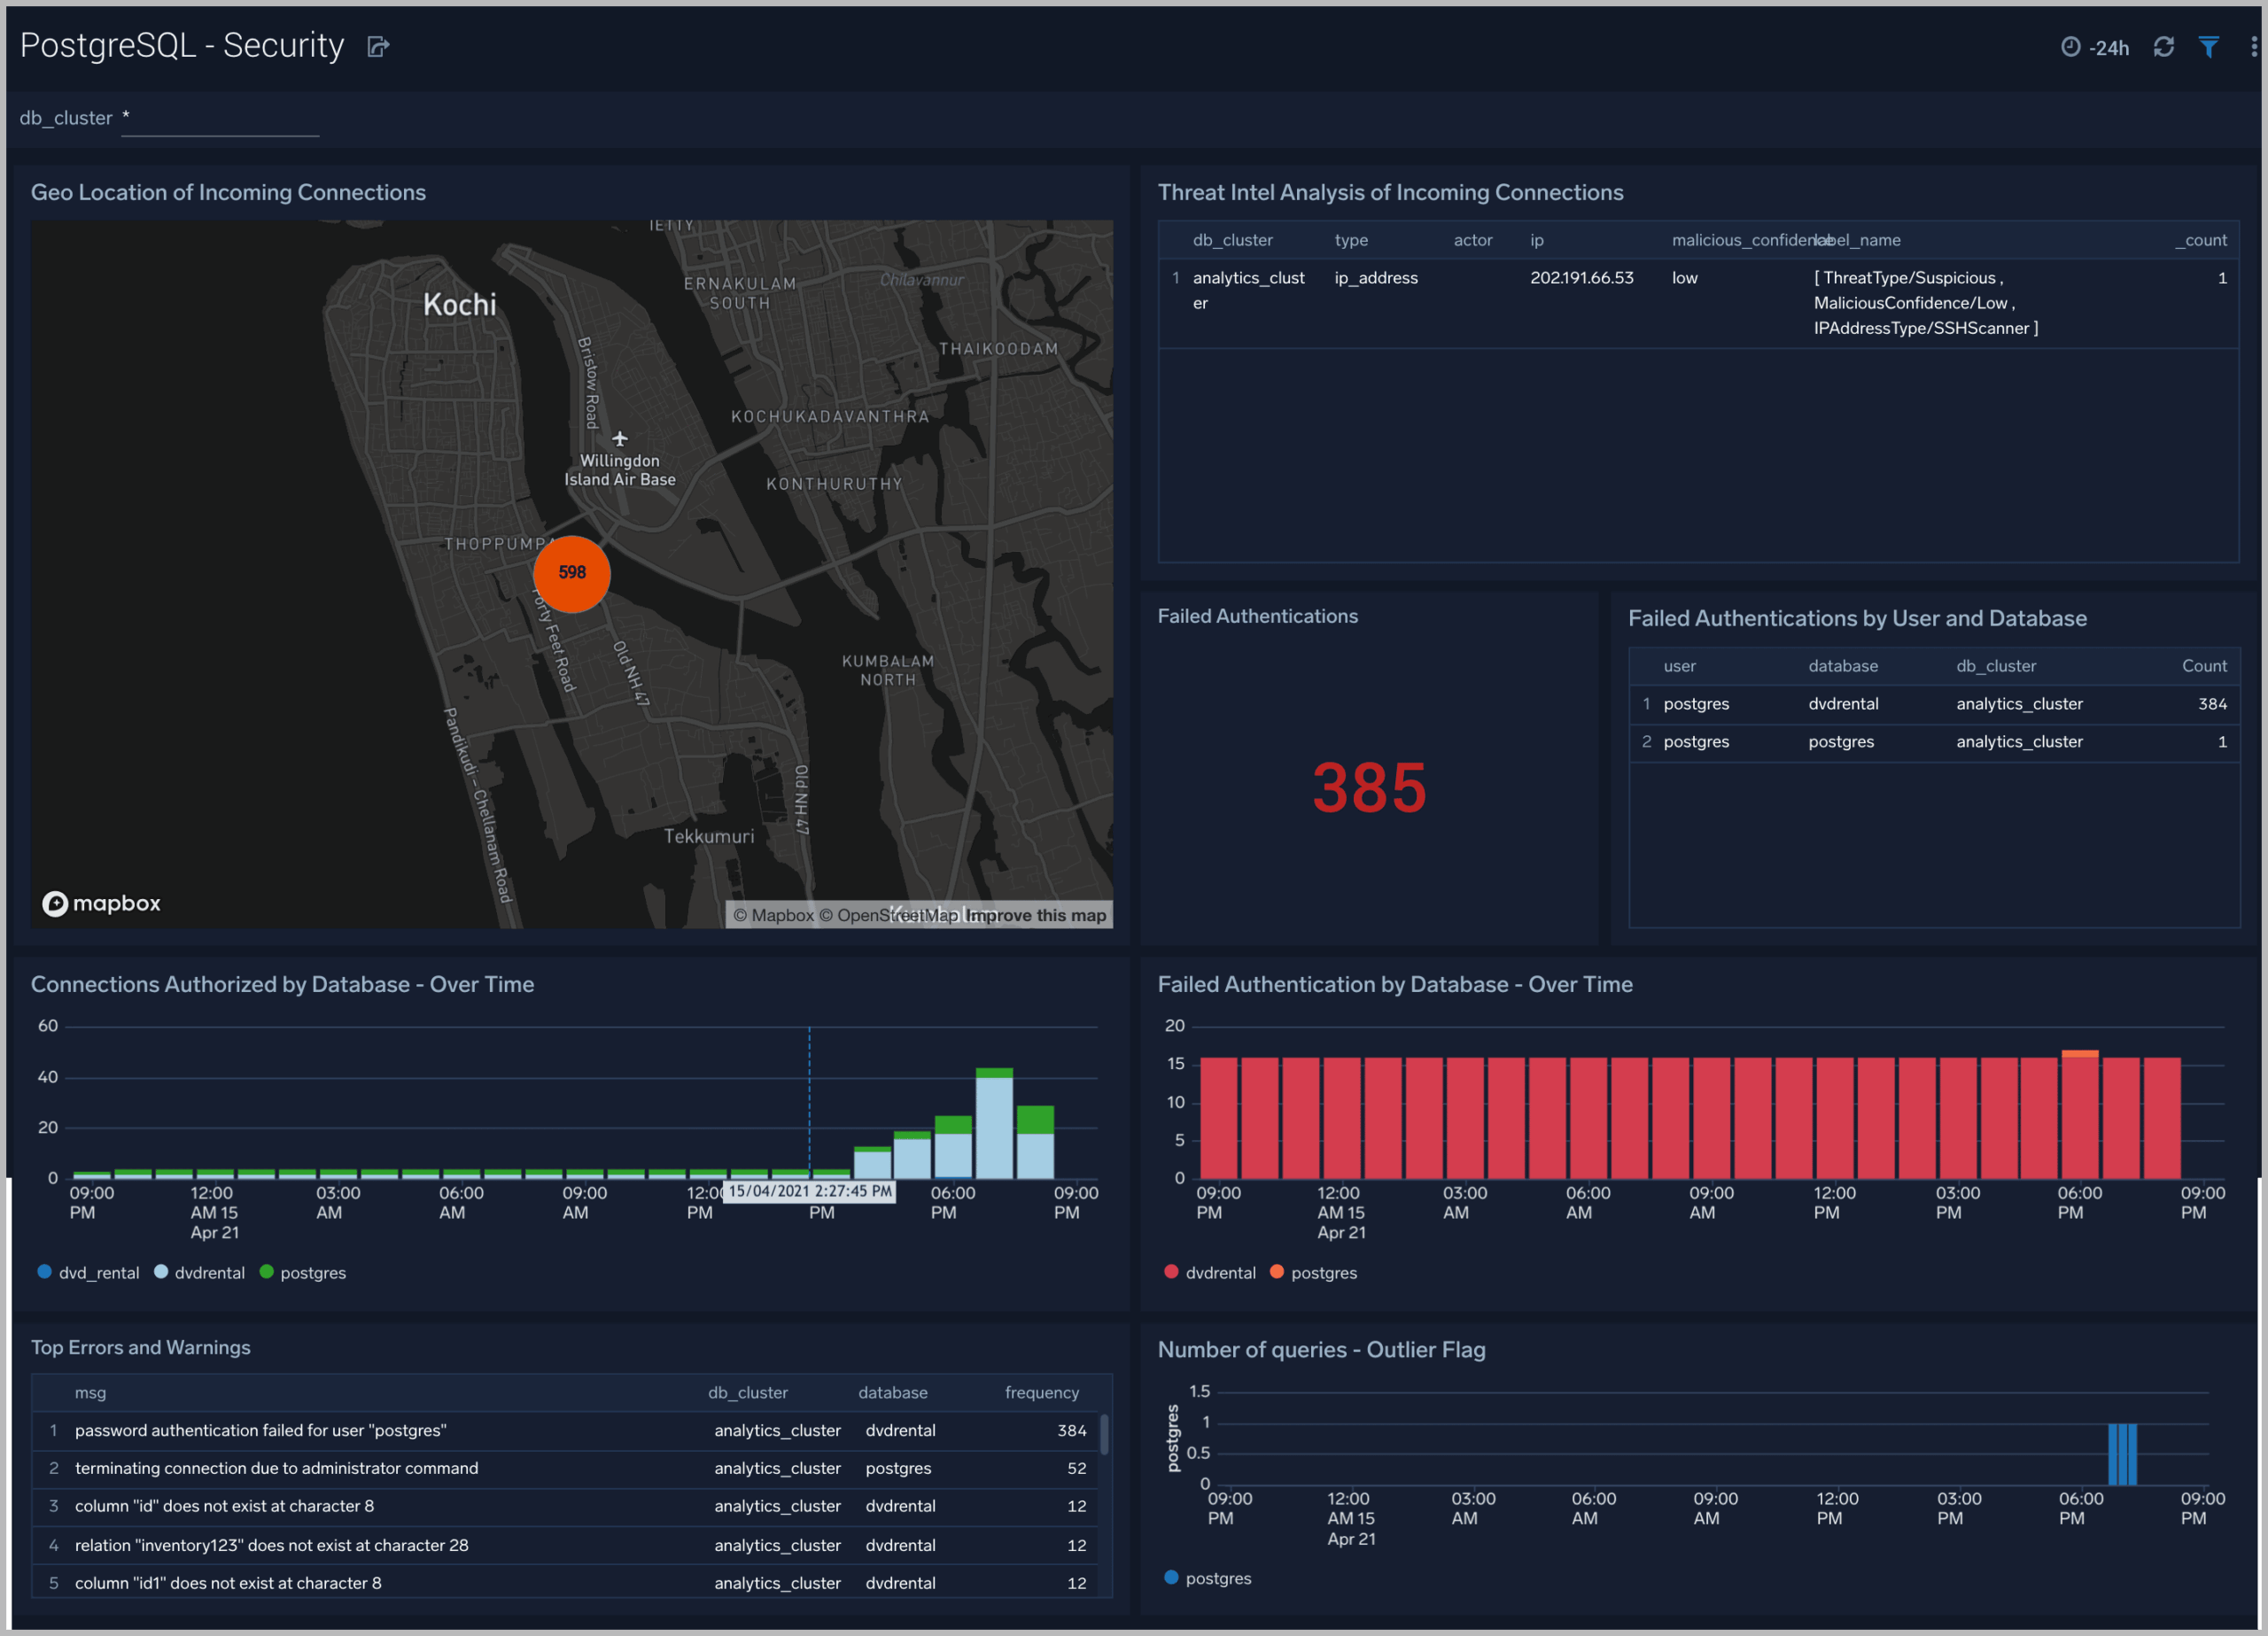
Security Monitoring
Get insight into user logins and incoming threats

Database Cluster Monitoring
The PostgreSQL – Overview dashboard gives you an at-a-glance view of the state of your database clusters by monitoring errors, failed logins, slow queries and trends over time.

Query Performance Monitoring
The PostgreSQL Query Execution dashboard helps vou quickly identify slow queries and examine query execution trends.

Query Performance Monitoring
The PostgreSQL Query Execution dashboard helps vou quickly identify slow queries and examine query execution trends.

PostgreSQL Alerts
Pre-packaged Sumo Logic alerts help you monitor your PostgreSQL clusters, are based on Sumo Logic monitors, leverage metrics and logs, and include preset thresholds for connections, slow queries, commit rates, deadlocks, replication, locks, compression and other critical conditions.

