Observability for complex application architectures powered by NGINX
Monitor, diagnose and troubleshoot availability, performance and resource utilization issues of complex application architectures powered by Nginx Plus with real-time dashboards and alerts.

NGINX Plus metrics visibility
Monitor the large array of NGINX Plus metrics in real-time across complex application deployments
Track usage behaviors
Monitor visitor patterns and identify anomalous behaviors and errors before they impact your customers
Native kubernetes support
Out-of-the-box support for k8s Ingress Controller metrics helps operators monitor ingress status and optimize availability

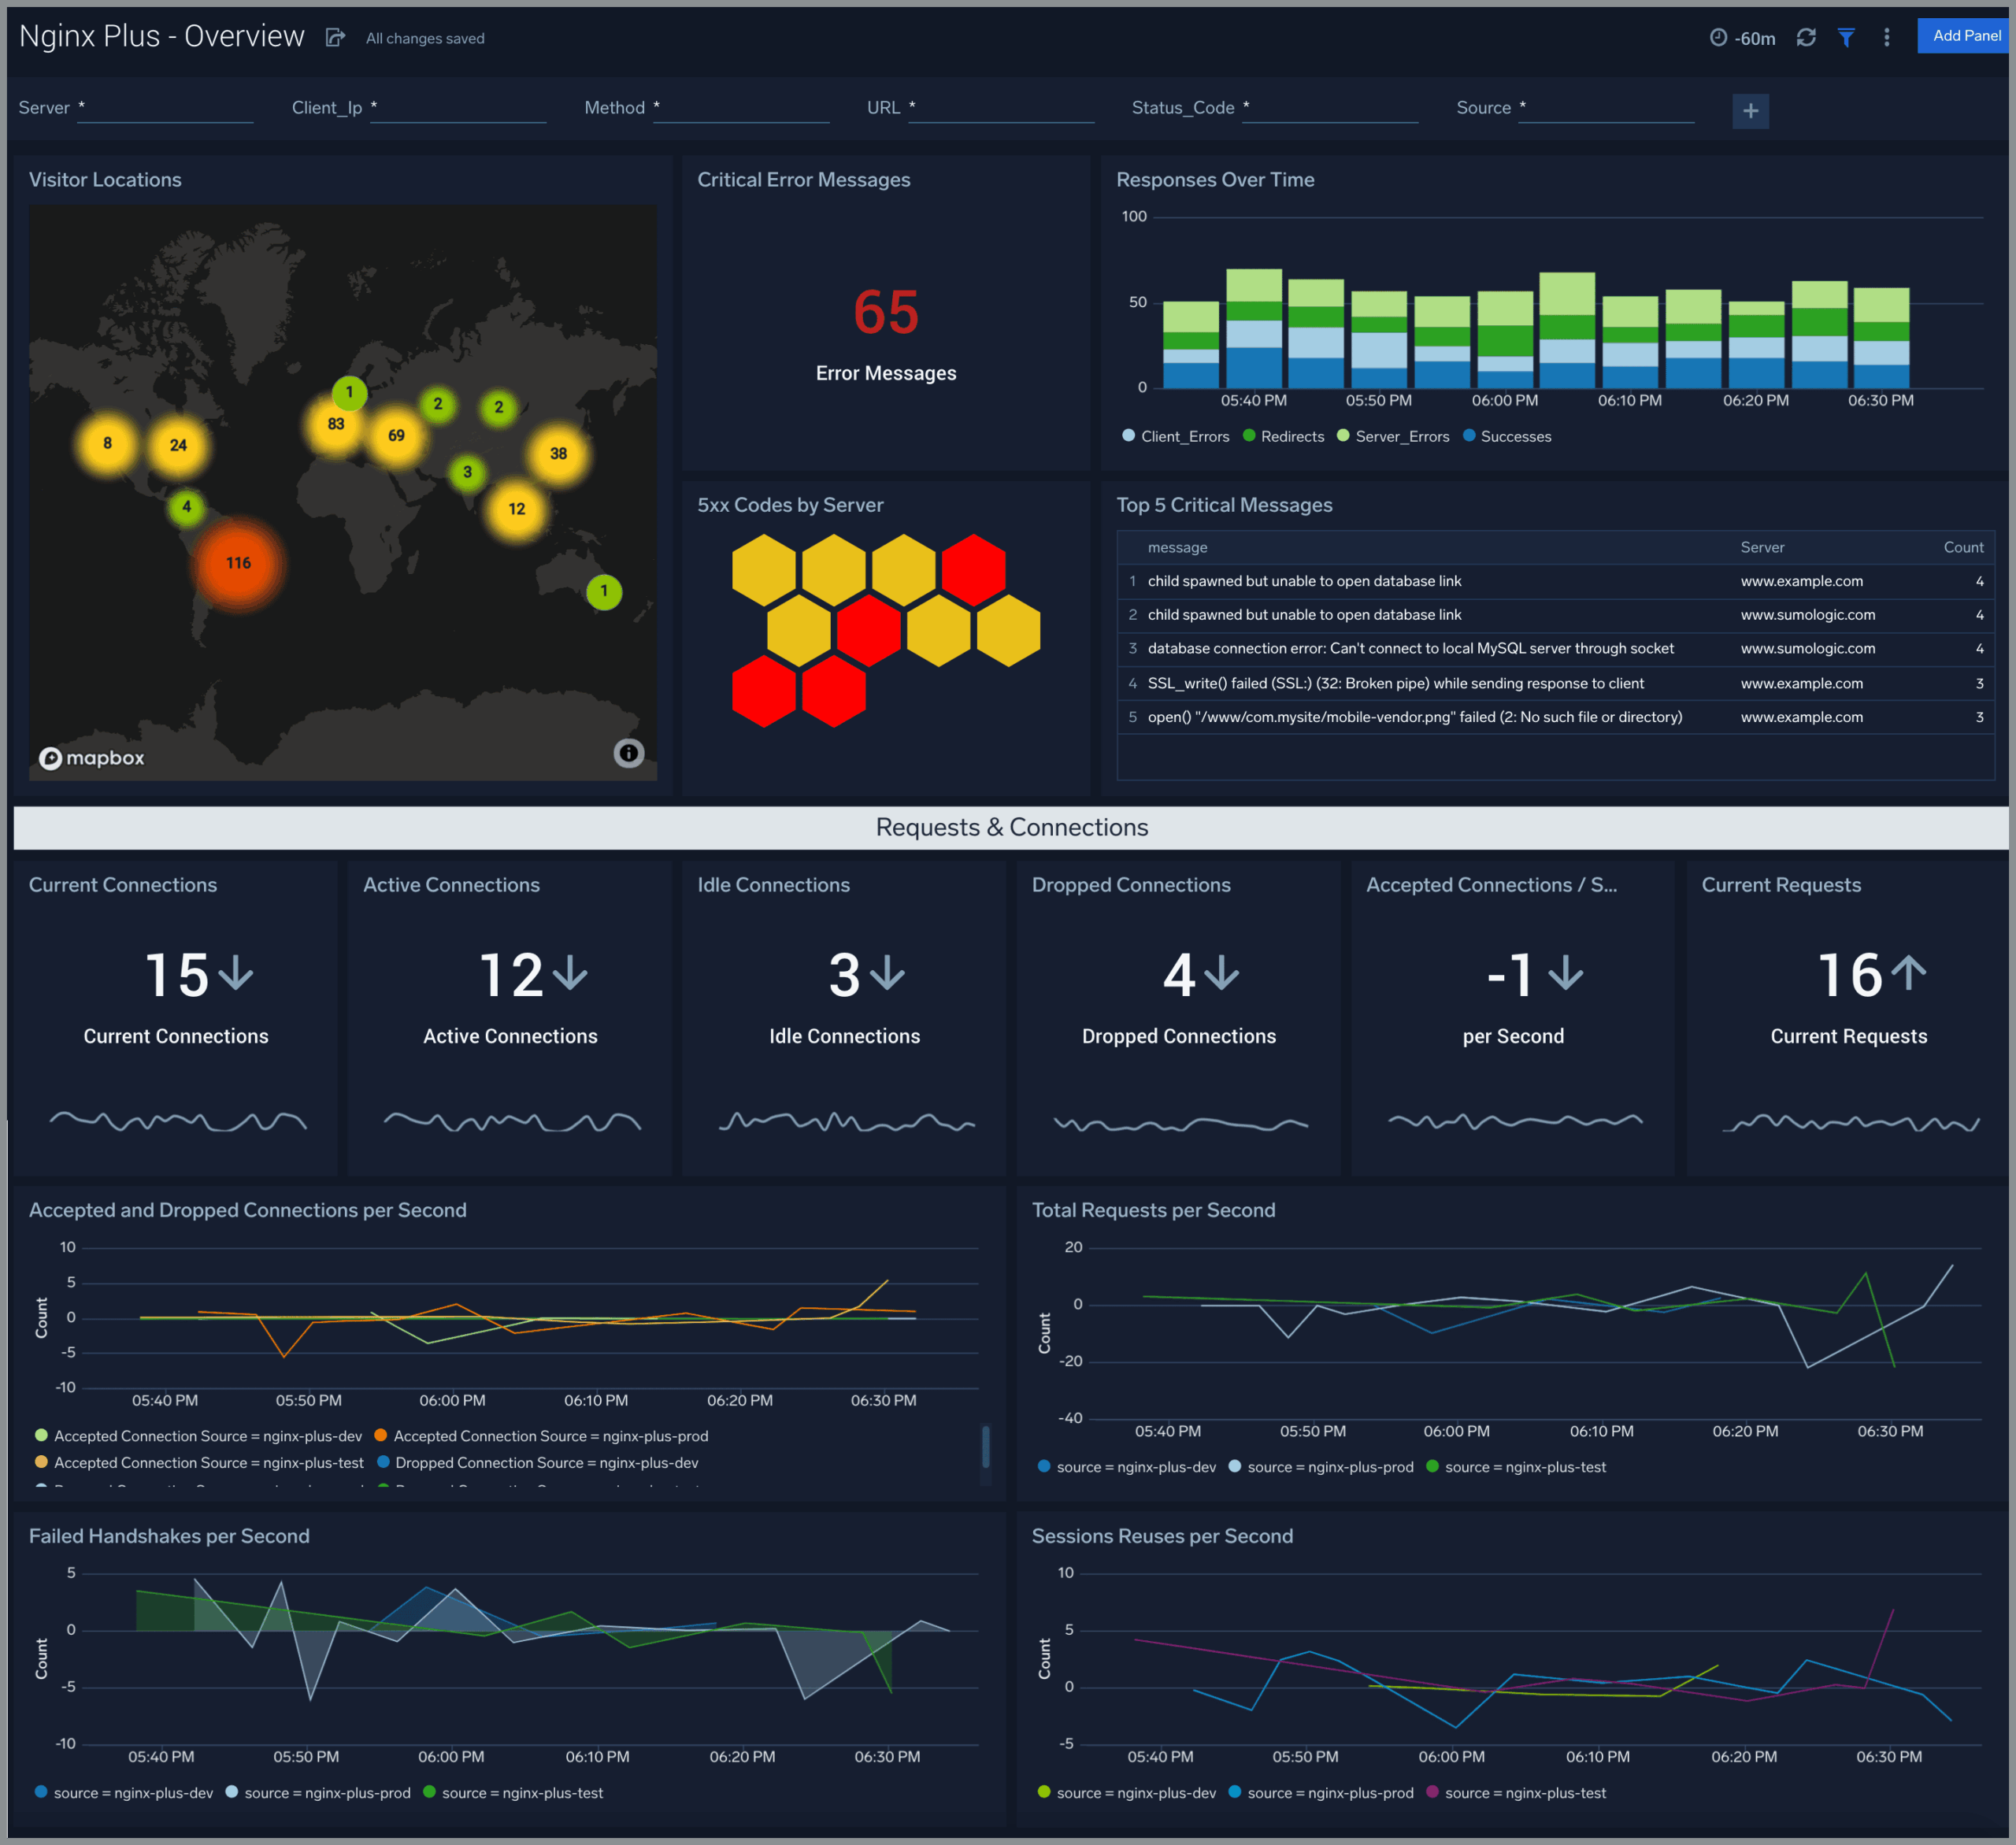
An at-a-glance view of the Nginx Plus server access locations, error logs along with advanced connection metrics.
Quickly gain insights into originated traffic location by region, critical errors and response codes, as well as real-time requests and connections metrics to identify and resolve issues before they impact your customers.
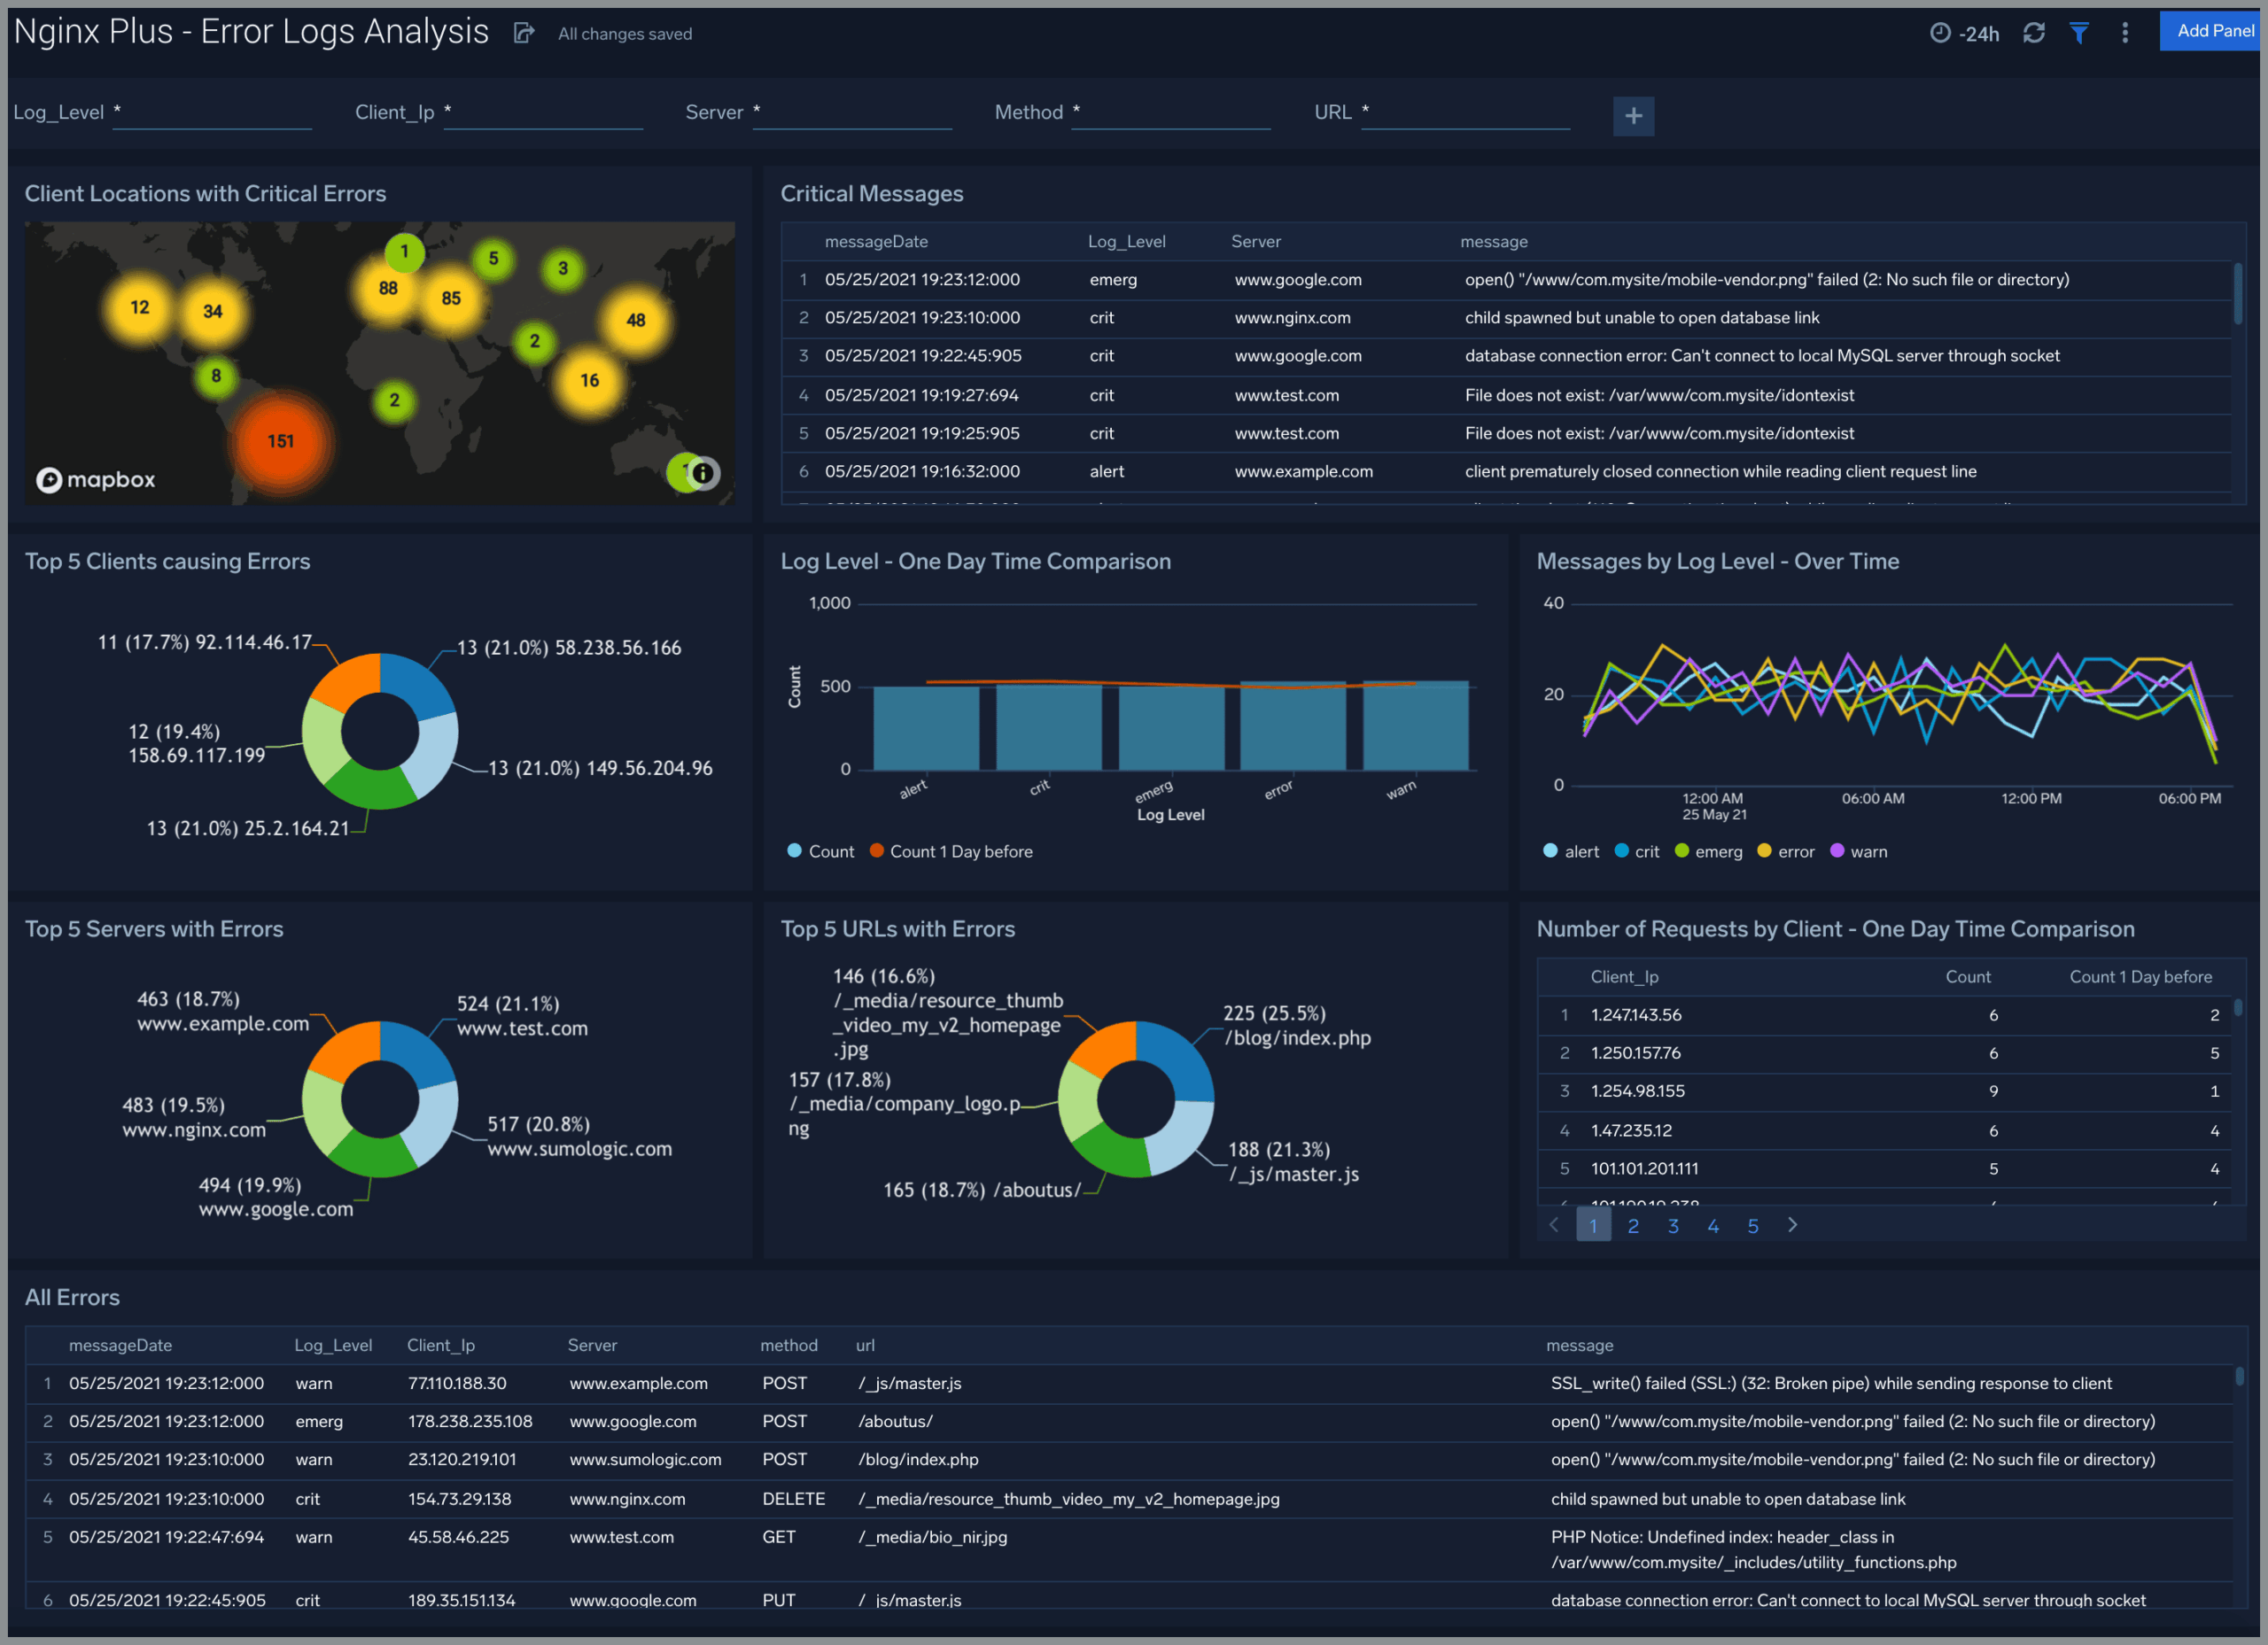
Deep analysis of NGINX Plus errors for advanced troubleshooting
Error log analysis dashboards visualize error messages from your NGINX Plus deployments by client, server and URL. Alerts tied to these error messages give teams immediate feedback related to connection outliers, request trends, anomalous server activity and more.


Timeseries cache activity and trends
Monitor and alert on changes in trends related to cache states, cache hit rate and cache disk usage over time to identify potential issues or optimizations that can be made to your NGINX Plus deployments.
Advanced NGINX Plus Metrics
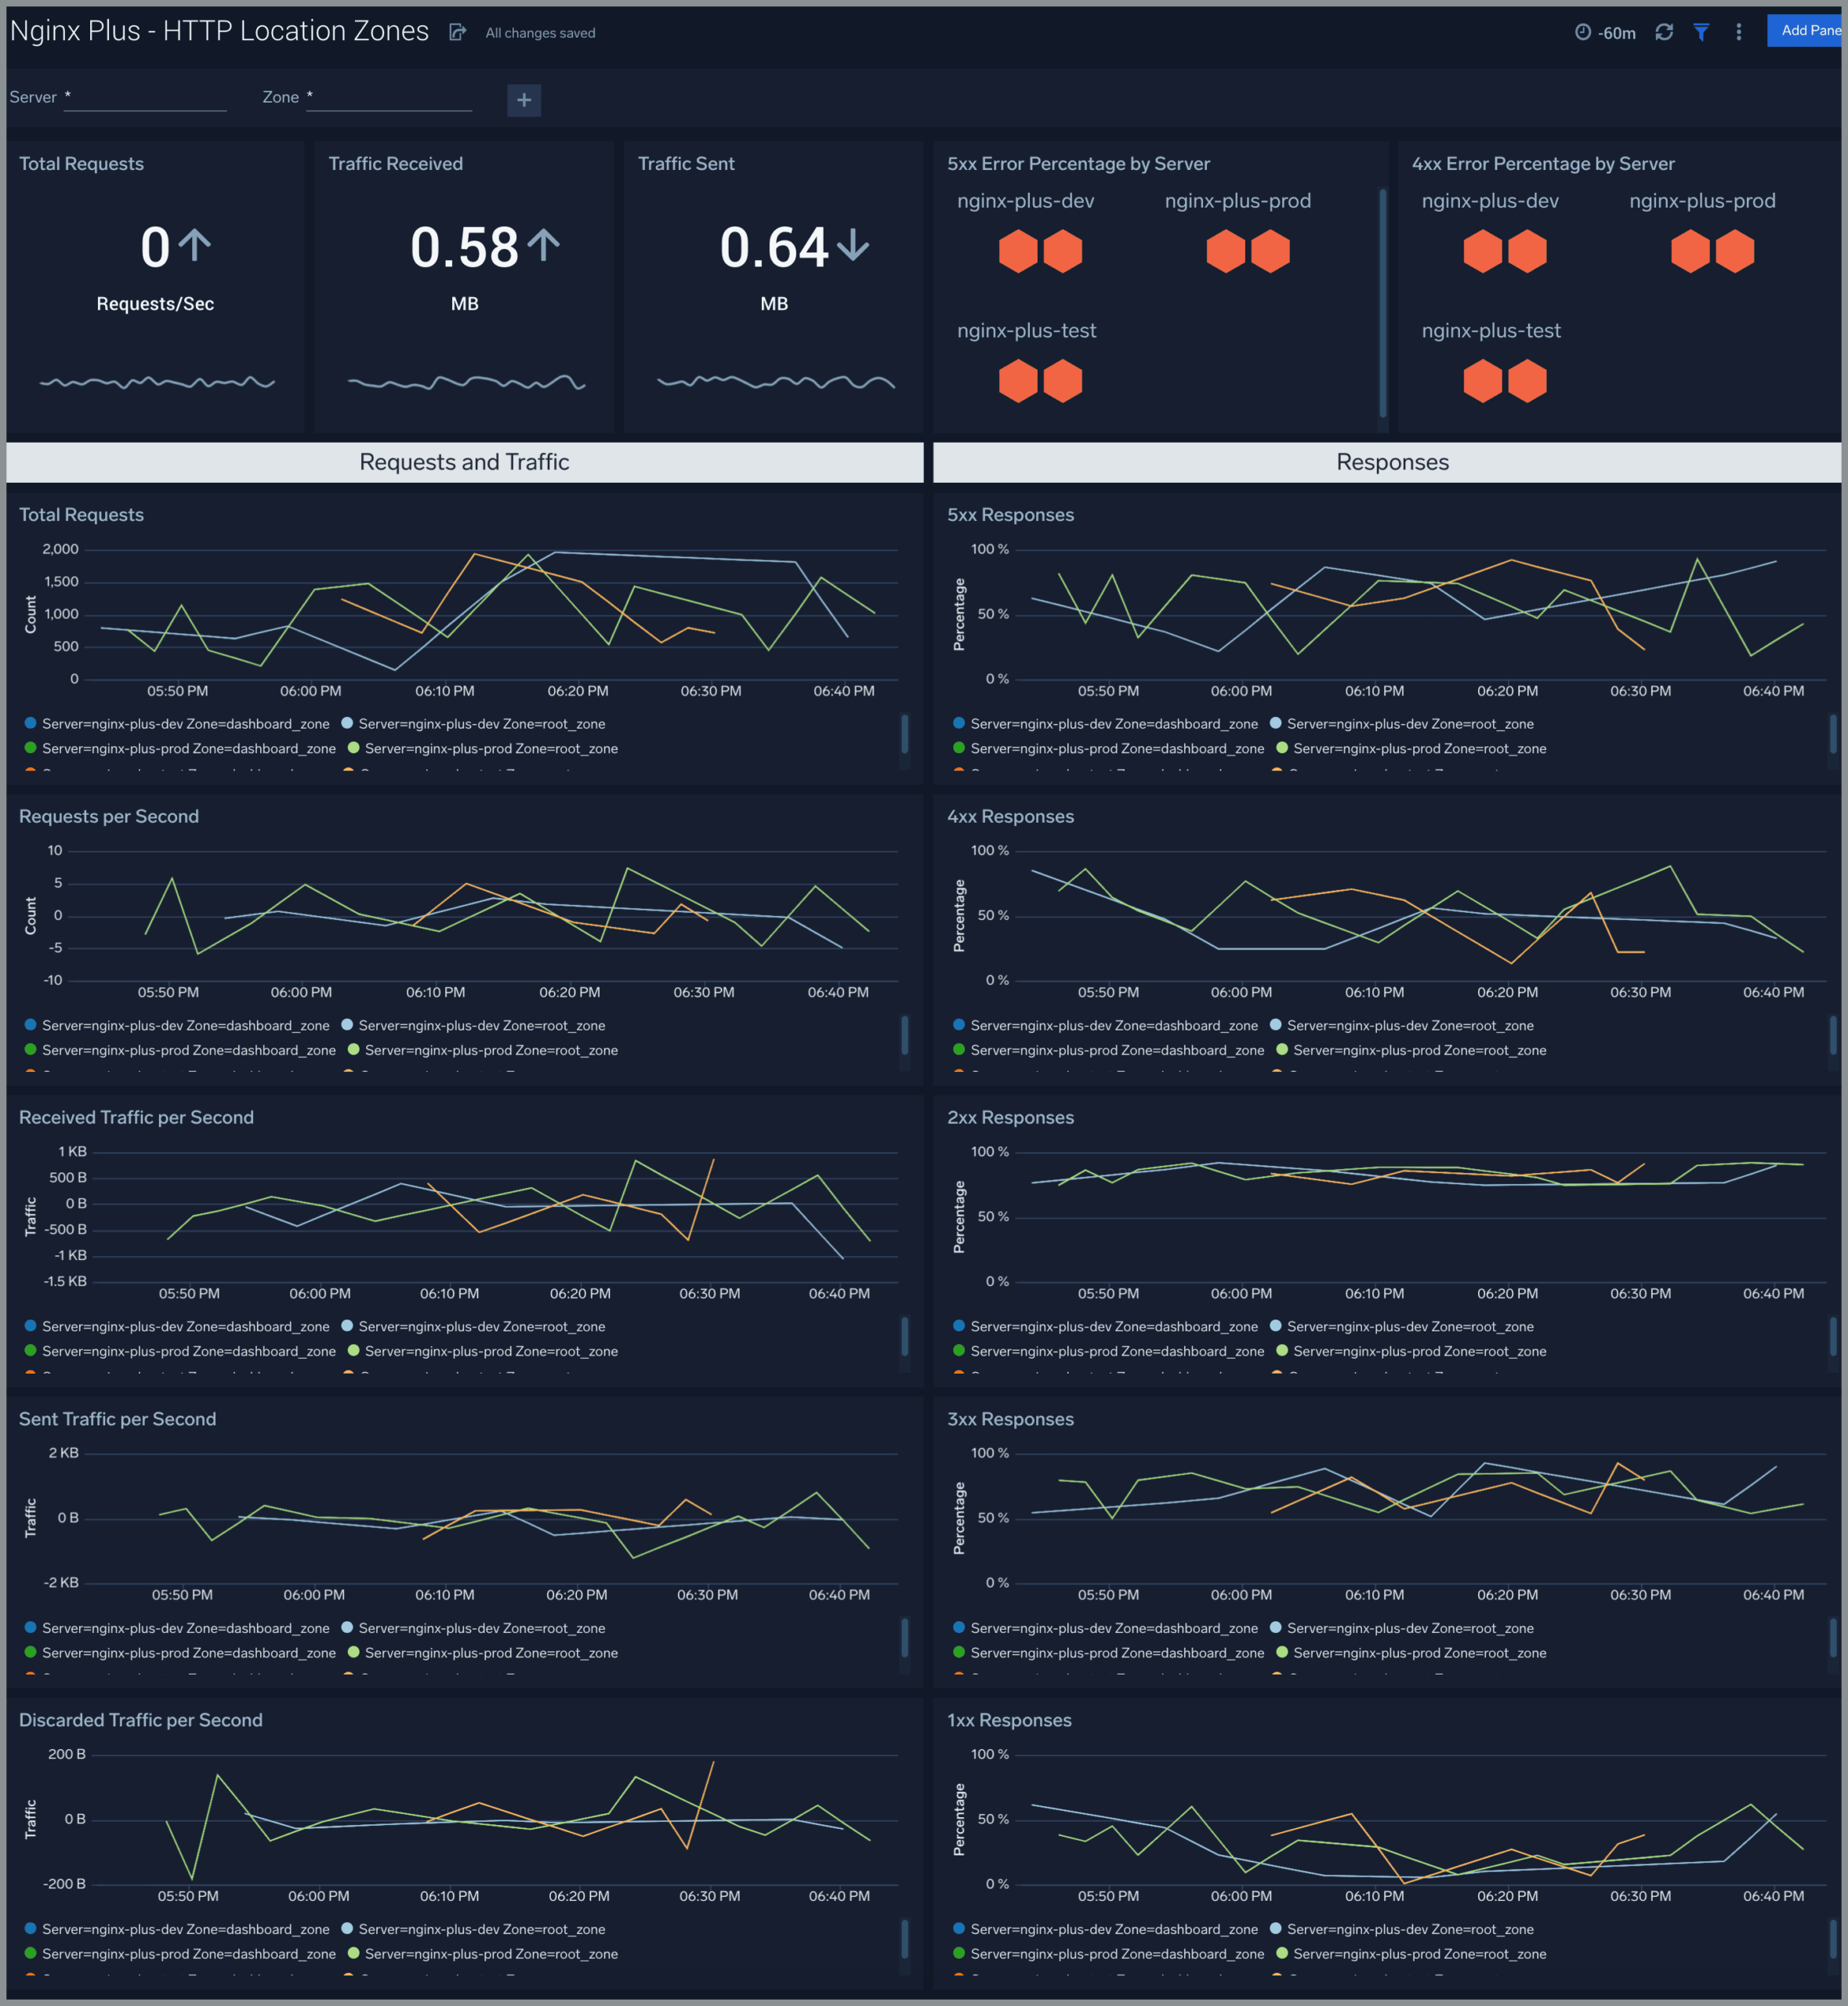
NGINX Plus’ advanced metrics service replaces the open source httpd status stub module to deliver dozens of additional metrics needed to monitor enterprise-grade, complex NGINX architectures. Sumo Logic’s Unified Logs and Metrics app for NGINX Plus surfaces these additional metrics to give teams visibility into HTTP location and server zones, HTTP, TCP and UDP upstreams, as well as resolvers.


Nginx Plus Alerts
Pre-packaged Sumo Logic alerts help you monitor your Nginx Plus alerts, are based on Sumo Logic monitors, and include preset thresholds for connections, critical error messages, error rates and potential threats from highly malicious sources.

