
With the current rise in modern web applications, engineering teams responsible for application availability, reliability and overall customer satisfaction are challenged with monitoring, diagnosing, and troubleshooting more complex environments faster than ever. What better way is there to get insight into your app performance than by leveraging the traffic management tools connecting your apps to your customers? With Sumo Logic and NGINX, you can easily get information on the health of your apps and save valuable time.
The F5 NGINX team has taken on the challenge of taming the modern data plane with two commercial offerings:
-
NGINX Plus is an all-in-one web server, reverse proxy, load balancer, content cache, and API gateway with enterprise-grade features for complex deployments where high availability, DNS system discovery, session persistence and dynamic configuration are all must-haves.
-
NGINX Ingress Controller brings the power of NGINX Plus to Kubernetes. In a CNCF survey, nearly two‑thirds of respondents reported using the NGINX Ingress Controller, more than all other controllers combined – and NGINX Ingress Controller has been downloaded more than 10 million times on DockerHub.
With the release of our two new NGINX Plus apps for the Sumo Logic Continuous Intelligence Platform, it’s now easier than ever to comprehensively collect, analyze, alert on and respond to events, visitor patterns, anomalous behavior and potential security incidents across your NGINX Plus clusters before the customer is impacted.
At a high level, with these two new apps for NGINX, you can now:
-
Comprehensively collect and analyze logs, metrics, errors and statistical outliers from complex NGINX Plus and NGINX Ingress Controller deployments on any underlying platform or infrastructure
-
Track visitor patterns and identify anomalous behaviors and errors before they impact your customers
-
Get up and running quickly with several pre-built alerts designed to surface erroneous behavior and summarize client and server interactions for rapid response
-
Monitor and analyze NGINX Plus metrics made available by the ngx_http_api_module as time-series charts across complex application deployments in real time.
-
Take advantage of native support for k8s Ingress Controller metrics to monitor ingress status and optimize availability
Sumo Logic’s app release for NGINX has been separated into two distinct apps – NGINX Plus Ingress and NGINX Plus. The NGINX Plus Ingress app is for infrastructure and app teams that have deployed the NGINX Plus-based version of NGINX Ingress Controller on Kubernetes, and is identical to the NGINX Plus app with the exception of additional out-of-the-box visualizations for metrics and process logs used to monitor and optimize the Ingress controller resource itself. Teams using any other deployment model, including k8s deployments that use a load balancing strategy other than the Ingress controller, can use the NGINX Plus app.
Kubernetes aside, the team at Sumo Logic has worked closely with NGINX to construct several dashboards that take full advantage of the new ngx_http_api_module for NGINX Plus. This module emits dozens of valuable metrics for connections, requests, HTTP/TCP/UDP Upstreams, Caches and Resolvers that are critical in identifying anomalous behavior that could lead to availability issues. Time series visualizations are now made available for these metrics for simple monitoring and alerting.
How does it work?
Collection
The process of logs and metrics collection for NGINX varies based on the deployment type.
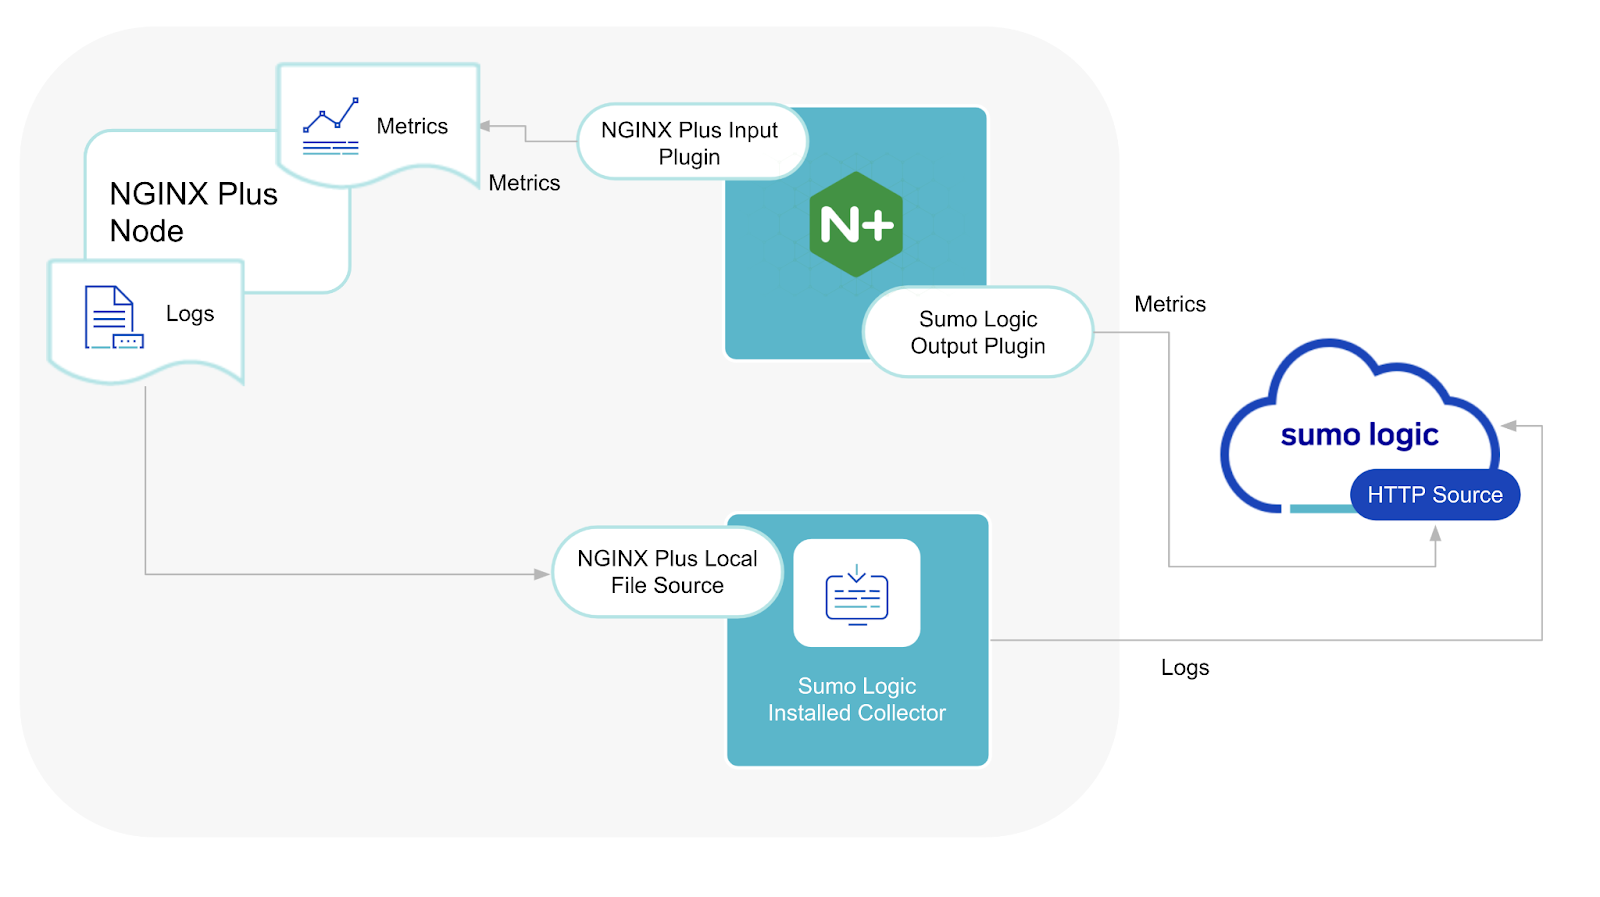
Non-Kubernetes
Non-Kubernetes Deployment Guide
Teams running NGINX in a non-Kubernetes deployment can deploy the Sumo Logic Installed Collector and Telegraf to collect logs and metrics respectively. To learn more on how to set up NGINX Plus collection for non-k8s deployments, please see our detailed documentation here.
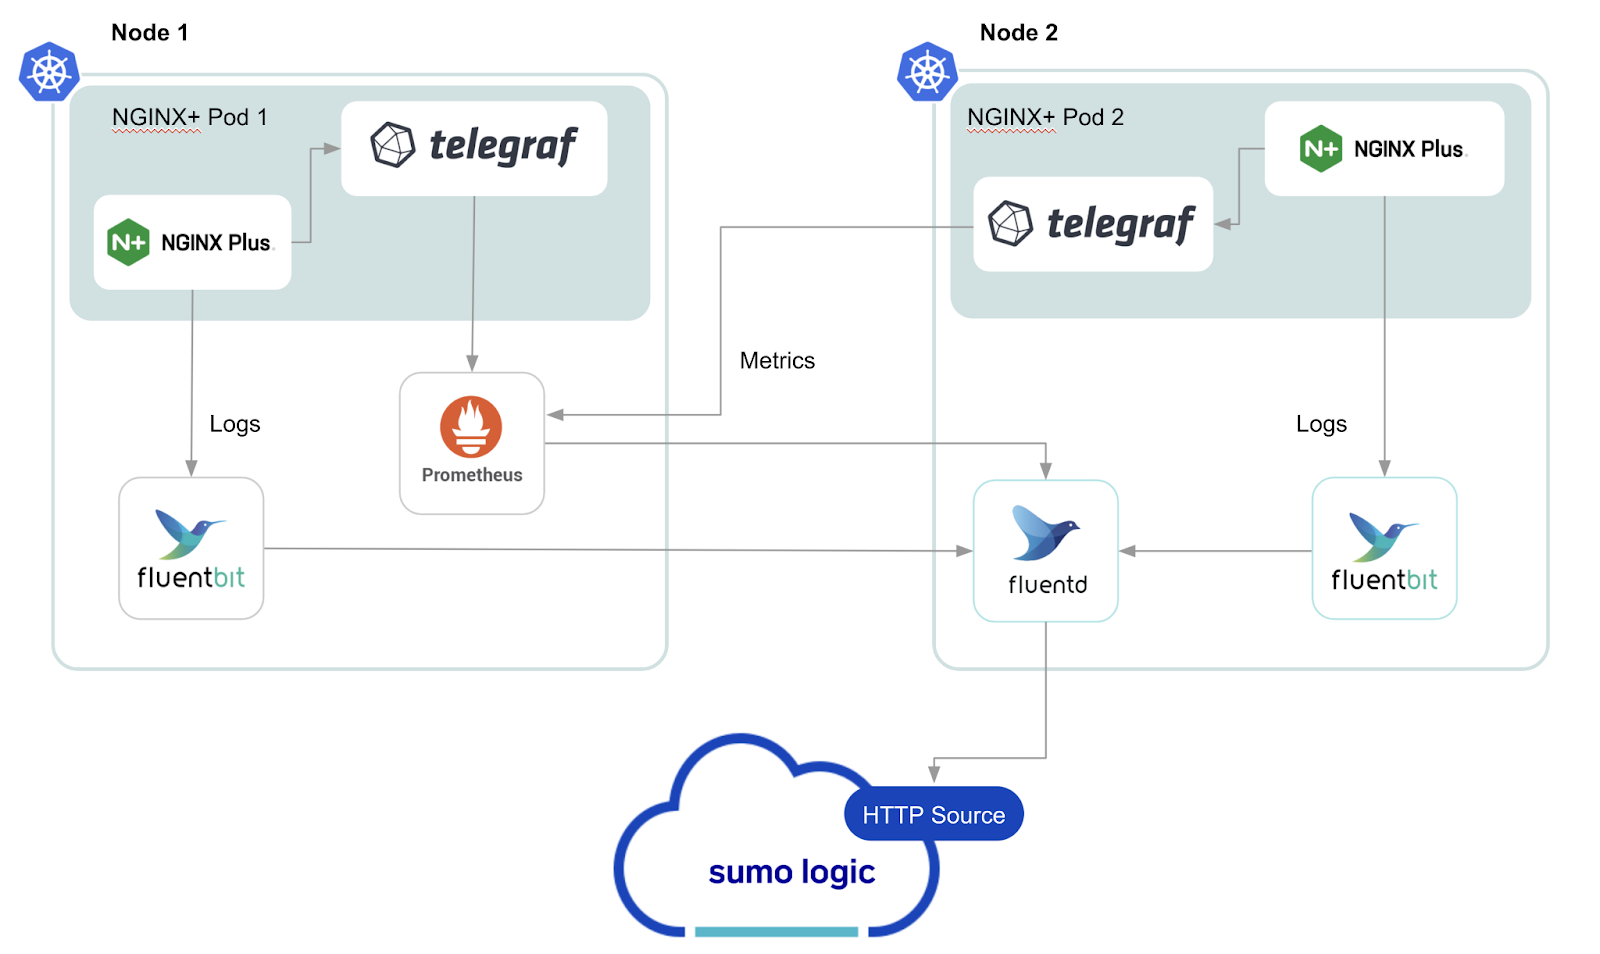
Kubernetes
Kubernetes Deployment Guide
Teams running NGINX Plus in a Kubernetes environment can take advantage of our open source Kubernetes collection agent to send logs and metrics to Sumo Logic. Our agent is deployed via Helm and leverages NGINX’s Telegraf Input Plugin for metrics collection, and Fluentbit combined with Fluentd for log collection. To learn more on how to setup NGINX Plus collection for k8s deployments, please see our detailed documentation here.
App Use Cases
The NGINX Plus App for Sumo Logic targets specific use cases geared towards reducing the complexity in maintaining ideal application reliability. While content below covers key use cases, there are several more dashboards available in the Sumo App for advanced NGINX Plus users that we encourage you to explore on our help docs for k8s or non-k8s deployments.
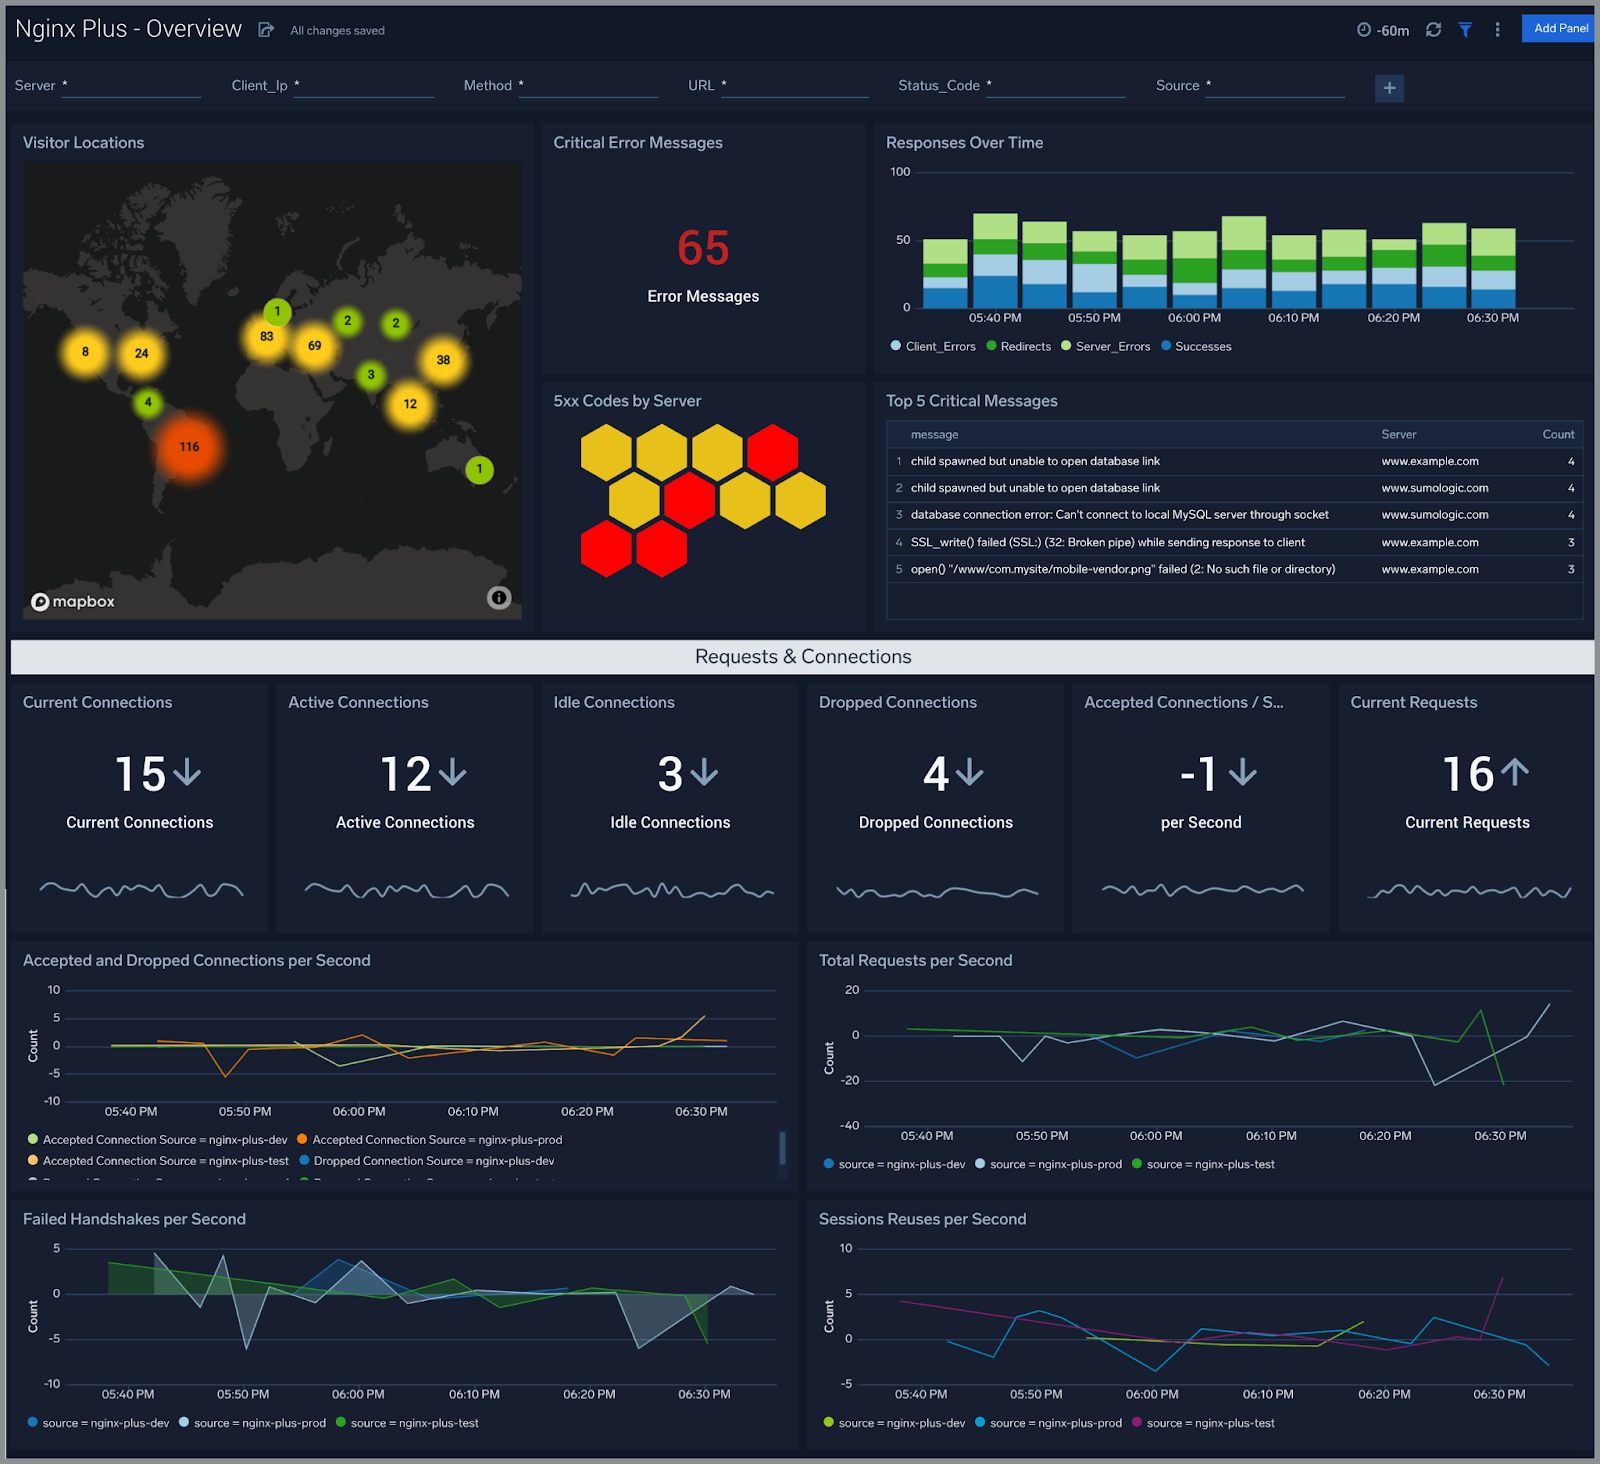
Server access locations, error logs and advanced connection metrics.
The NGINX Plus Overview dashboards enable users to quickly gain insights into originated traffic location by region, critical errors and response codes, as well as real-time requests and connections metric trends. Alerts and outlier detection can also be configured for these metrics to help identify behavioral patterns that can lead to customer-impacting incidents.
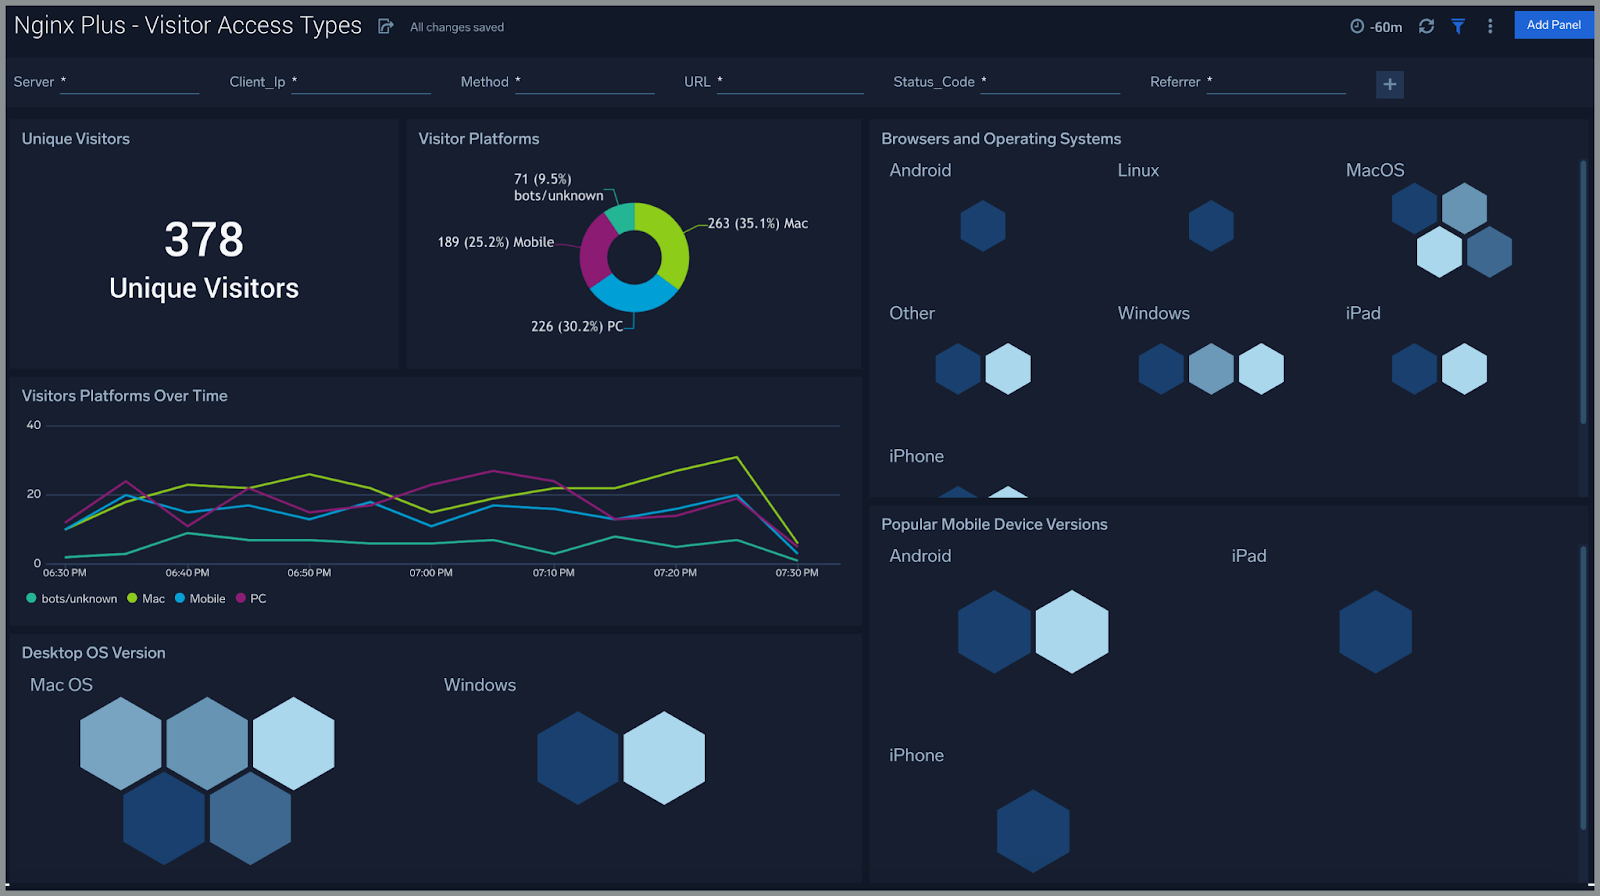
Visitor Pattern Analysis
One of the key use cases for aggregating NGINX logs and metrics into an analytics platform is visitor pattern analysis. The NGINX Plus app for Sumo Logic parses several valuable insights across your NGINX Plus deployments including top documents accessed, top referrers, top search terms, media types, geographic visitor locations, as well as visitor platform, os and device types to help teams properly allocate resources for specific content types, perform data-driven resource planning at per-region fidelity, and prioritize platform support that aligns with production usage trends.

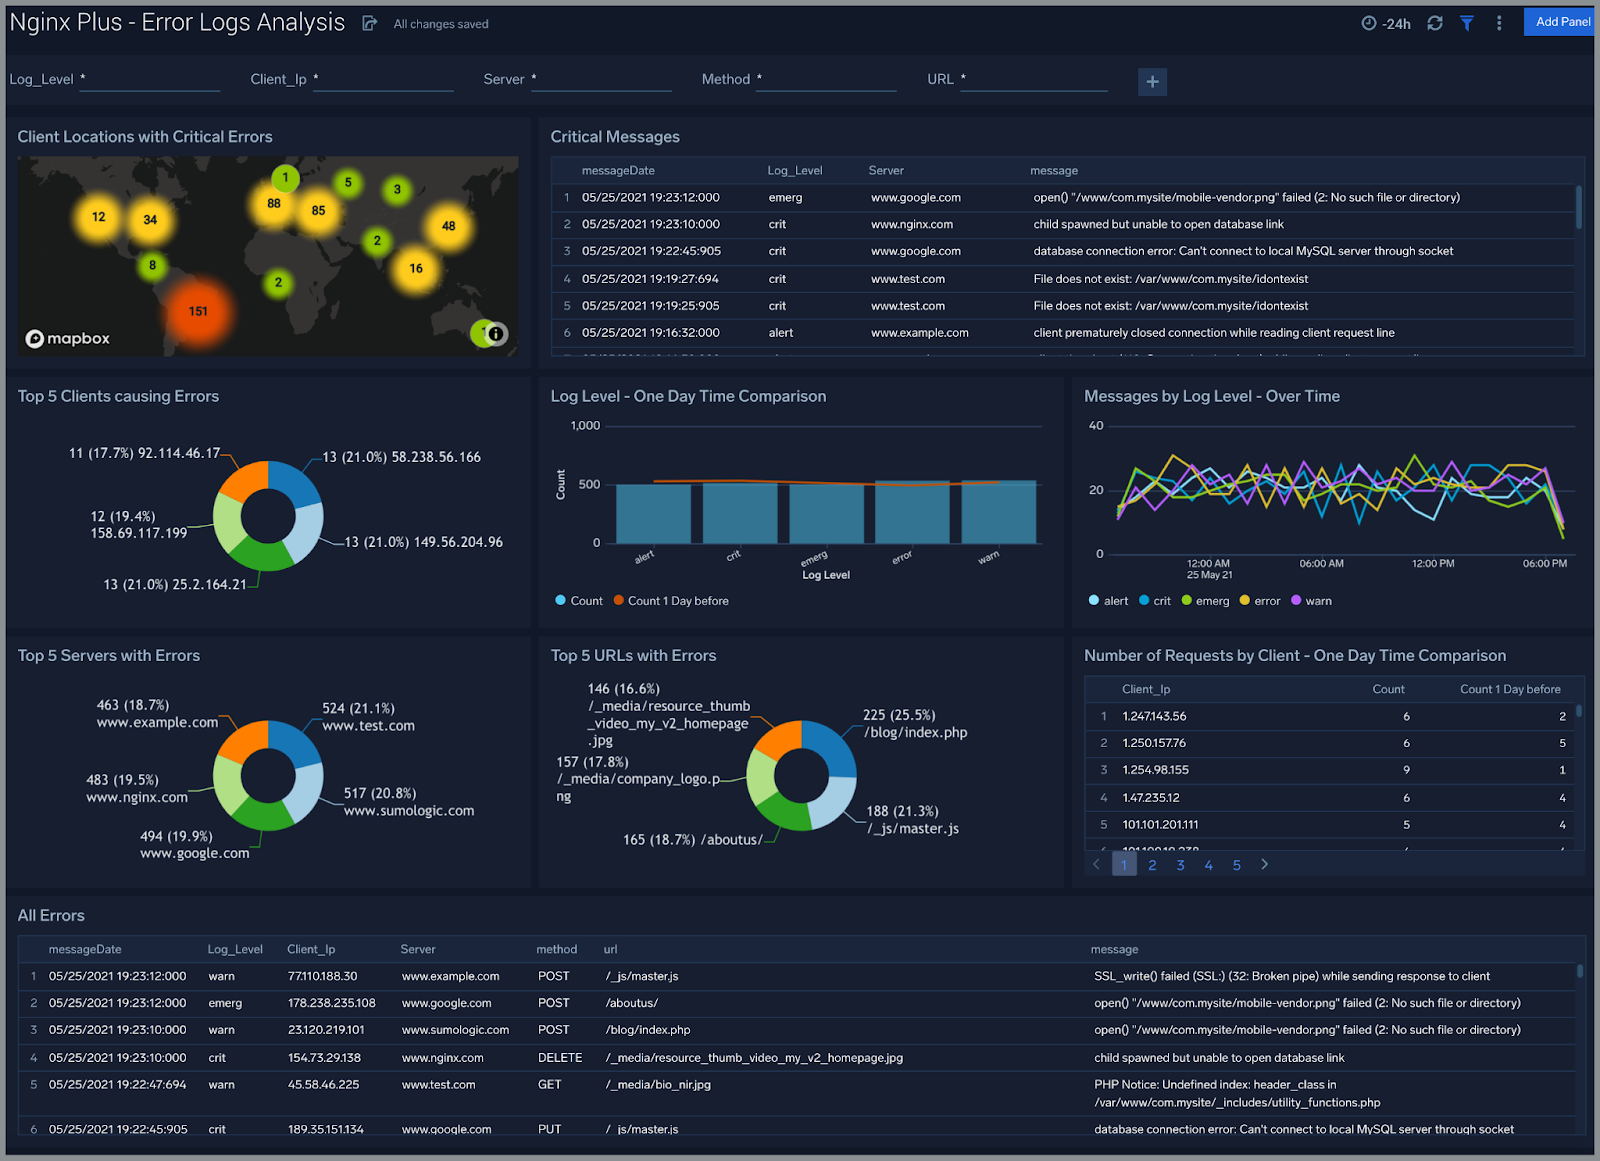
NGINX Plus error analysis for advanced troubleshooting
The error log analysis dashboards visualize error messages from your NGINX Plus deployments by client, server and URL. In addition, our out-of-the-box error message alerts give teams immediate feedback related to connection outliers, request trends, anomalous server activity and more to help quickly identify and resolve issues before customers are impacted.
Out-of-the-box NGINX Plus Alerts
In order to get teams up and running quickly, Sumo Logic has packaged a handful of alerts based on best practices and common issues found when managing complex NGINX Plus deployments. Error messages, HTTP Status code trends, traffic volume changes, and visitor activities are all made available via searches that can be configured as monitors for real-time alerting and incident response.
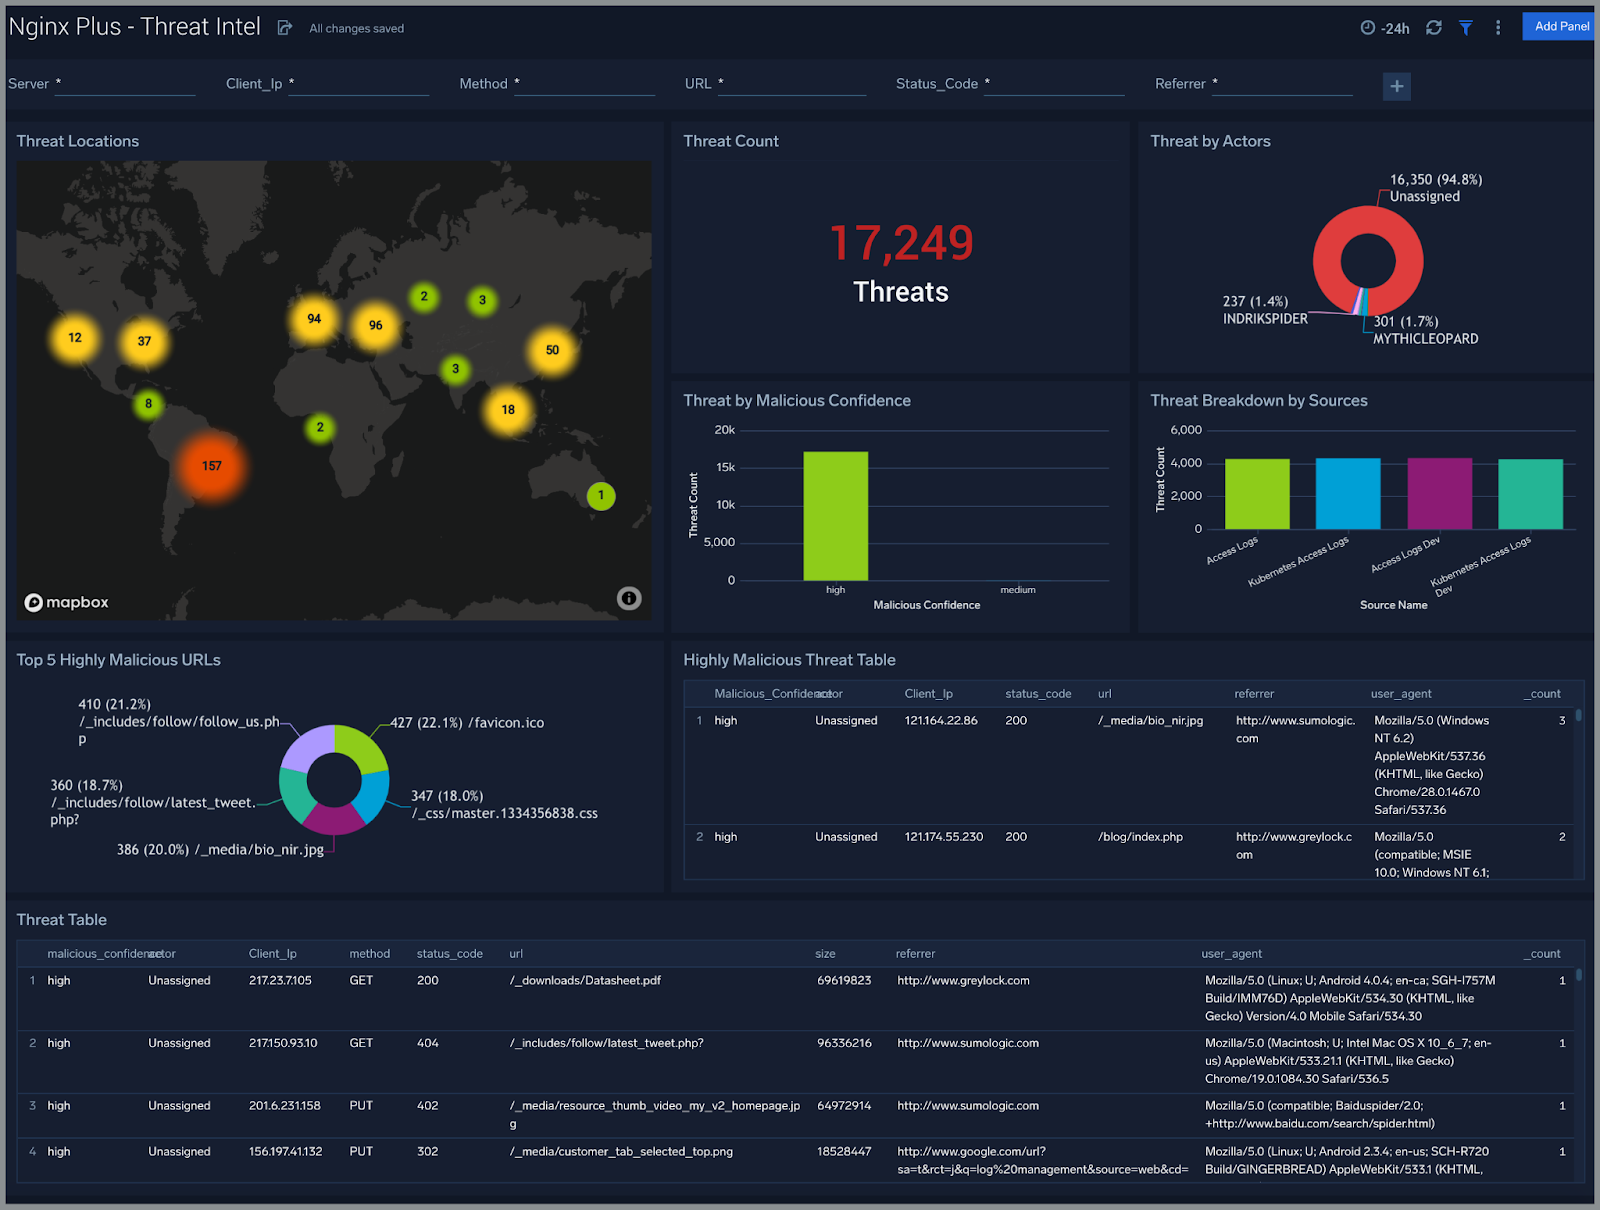
Threat Intelligence
Since not all visitors to your apps are friendly, we’ve also included a Threat Intelligence dashboard to identify and alert on malicious indicators of compromise. All visitor traffic is correlated in real time with CrowdStrike’s Threat Intelligence feed, providing data on threat actors, severity and methods, allowing teams to quickly triage security incidents and respond to threats faster.
Get Started Now!
The Sumo Logic apps for NGINX Plus and NGINX Ingress Controller are unified logs and metrics apps that help engineers monitor, diagnose and troubleshoot availability, performance and resource utilization issues of complex application architectures powered by NGINX. Prebuilt dashboards combined with real-time alerts monitor and identify anomalous usage patterns before they impact your customers.
To get started, check out the Sumo Logic NGINX Plus and NGINX Plus Ingress documentation. If you don’t yet have a Sumo Logic account, you can sign up for a free trial today.
Additional Resources
For more great DevOps and security focused reads, check out the Sumo Logic blog.
Download the Sumo Logic Continuous Intelligence Report that quantitatively defines the state of the modern application stack and the shift in technology used by enterprises adopting Cloud and DevSecOps during the COVID-19 global pandemic.


