Monitor and visualize your Jenkins CI/CD environment in real-time
Accelerate application development velocity
Easily troubleshoot and debug multiple code pipeline jobs including multi-branch pipelines all in a single app
Improve customer satisfaction & app quality
Improve the development and testing process for your software. Ensure product updates are delivered smoothly and your CI/CD environment is operating the way it should
Enable fine grained monitoring and control
Monitor multiple Jenkins master nodes from a single-pane of glass. Gain the ability to control the types of logs that need to be processed or monitor specific jobs or all logs

Easily set up and configure
Effortlessly send your Jenkins systems and jobs information to Sumo Logic through our published plugin. Monitor all multiple Jenkins Master in a single place
Fine grained system monitoring
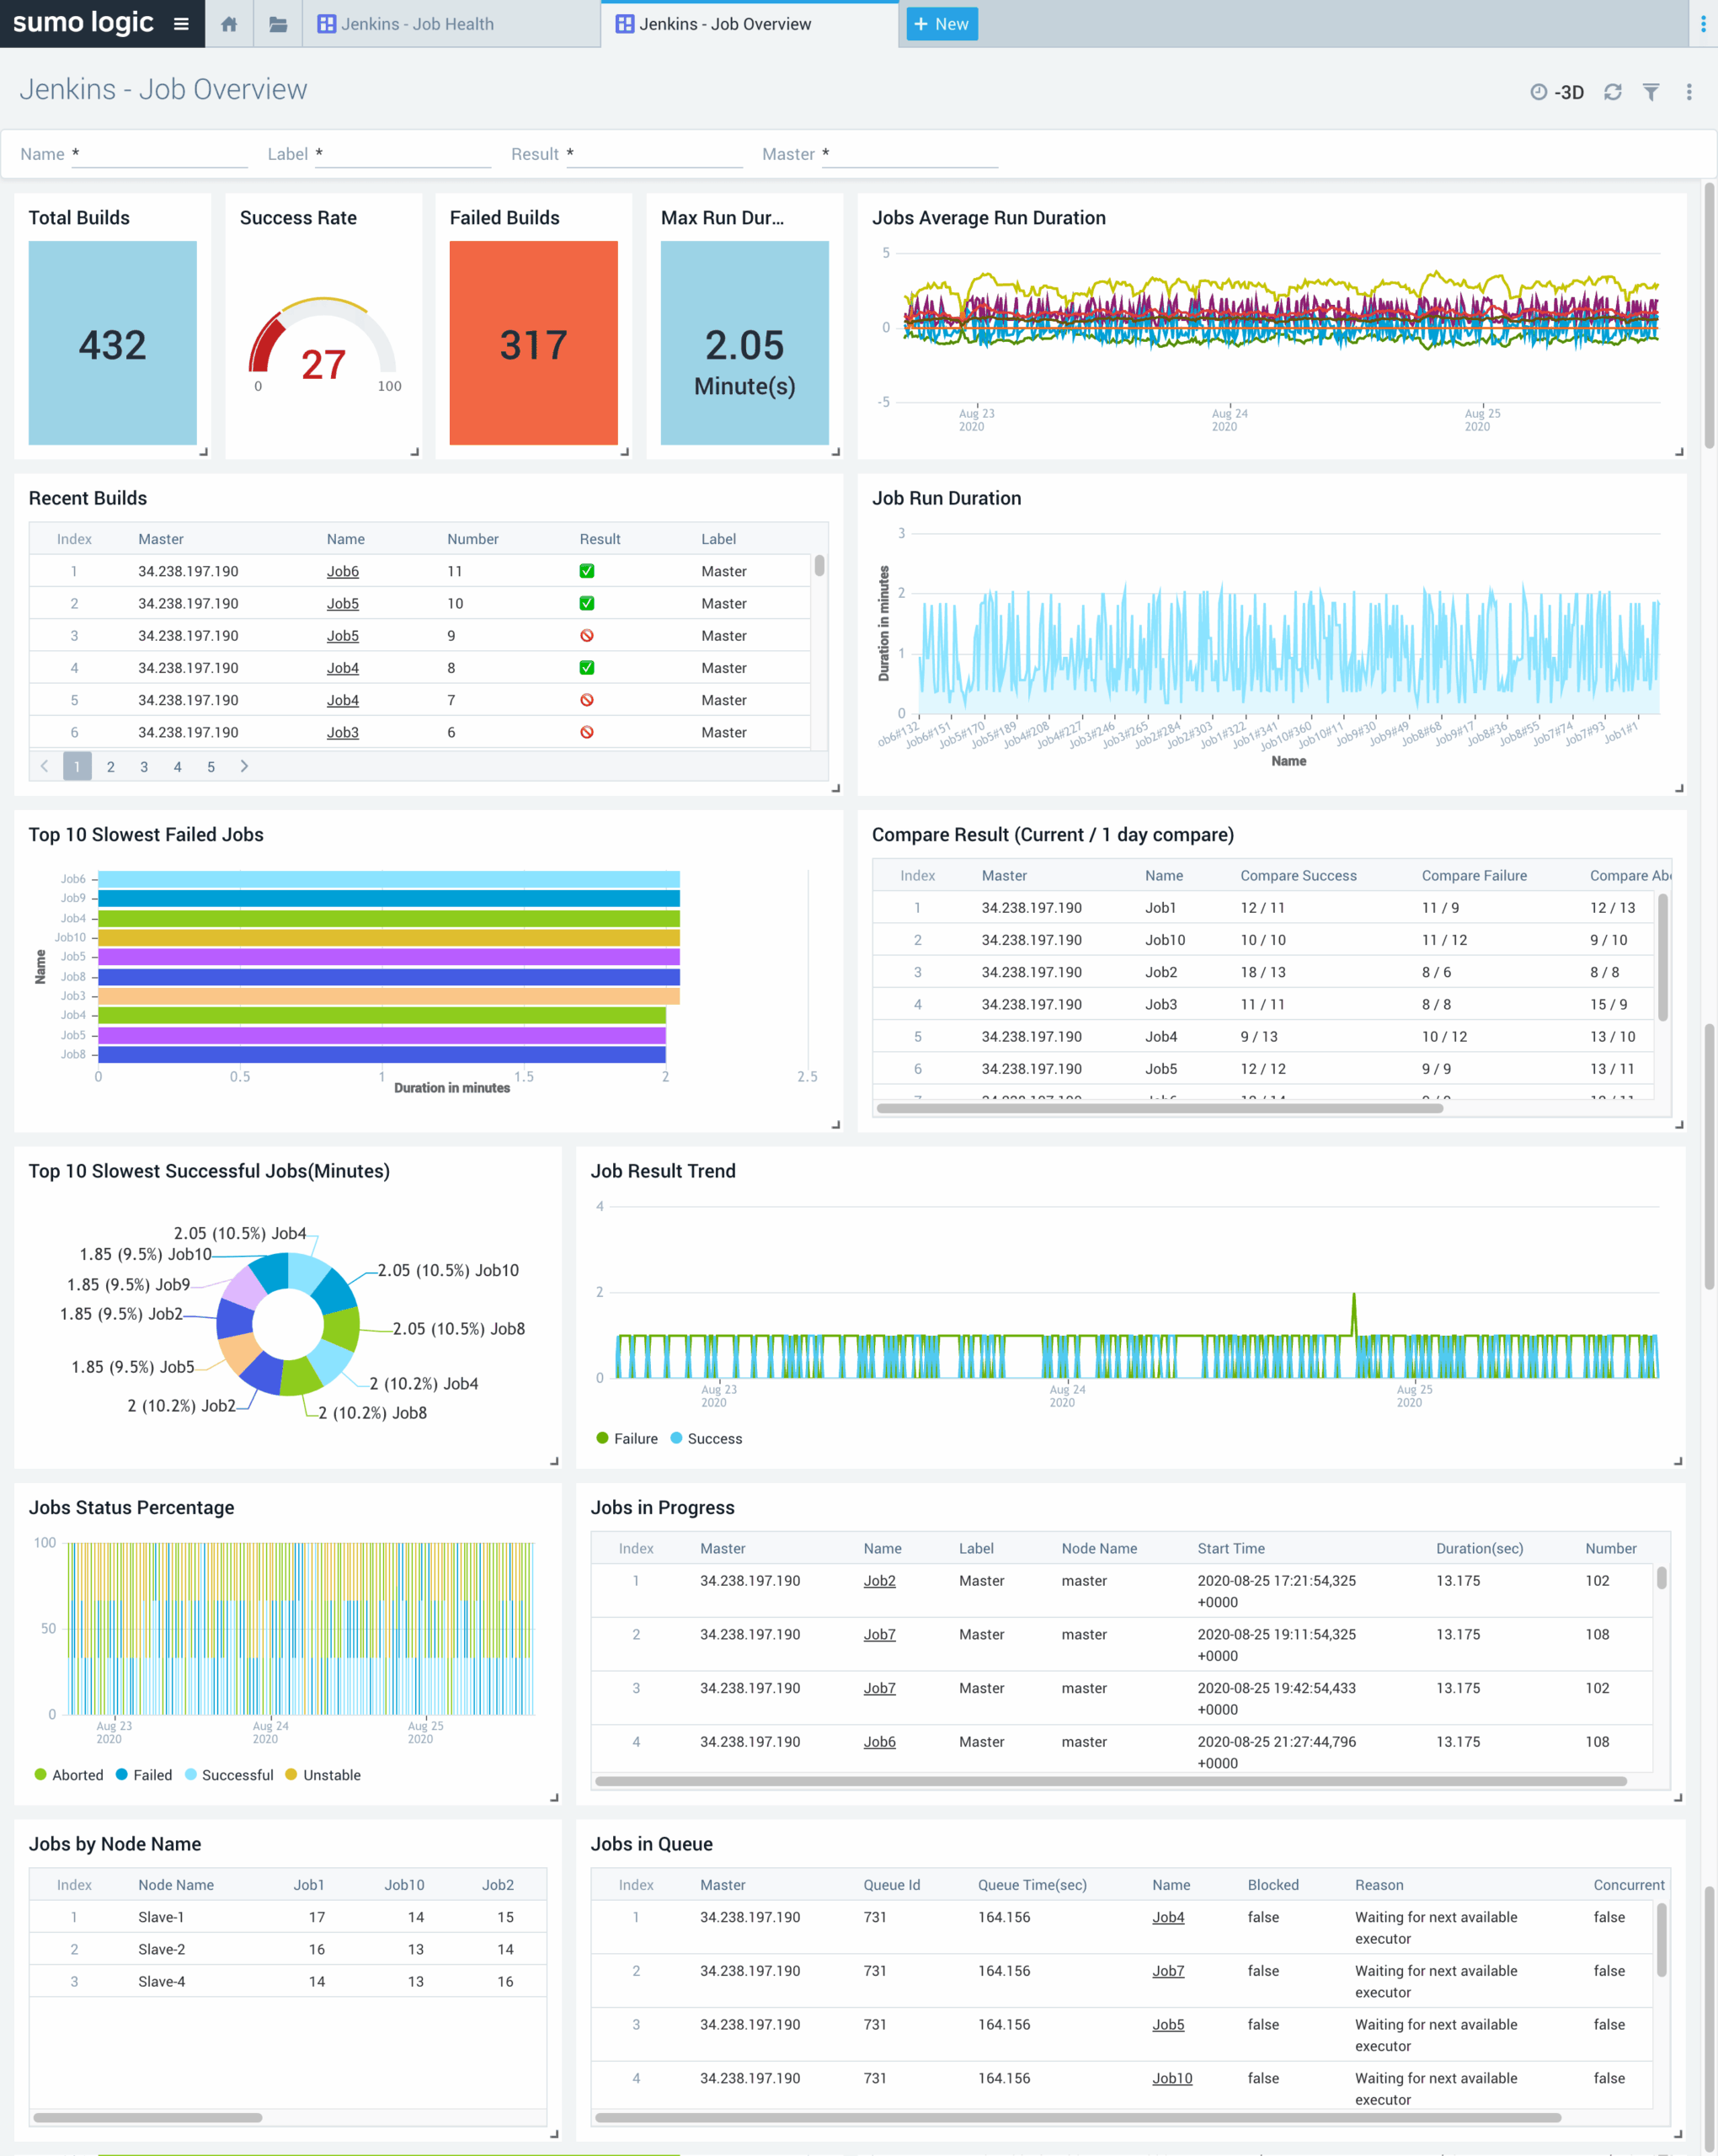
Use pre-configured dashboards to monitor system behavior including user events, configuration changes. Dashboards provide insight into the health of job and node health with information on shutdown events, Jenkins systems logs and metrics events such as CPU, memory, job duration, and more.
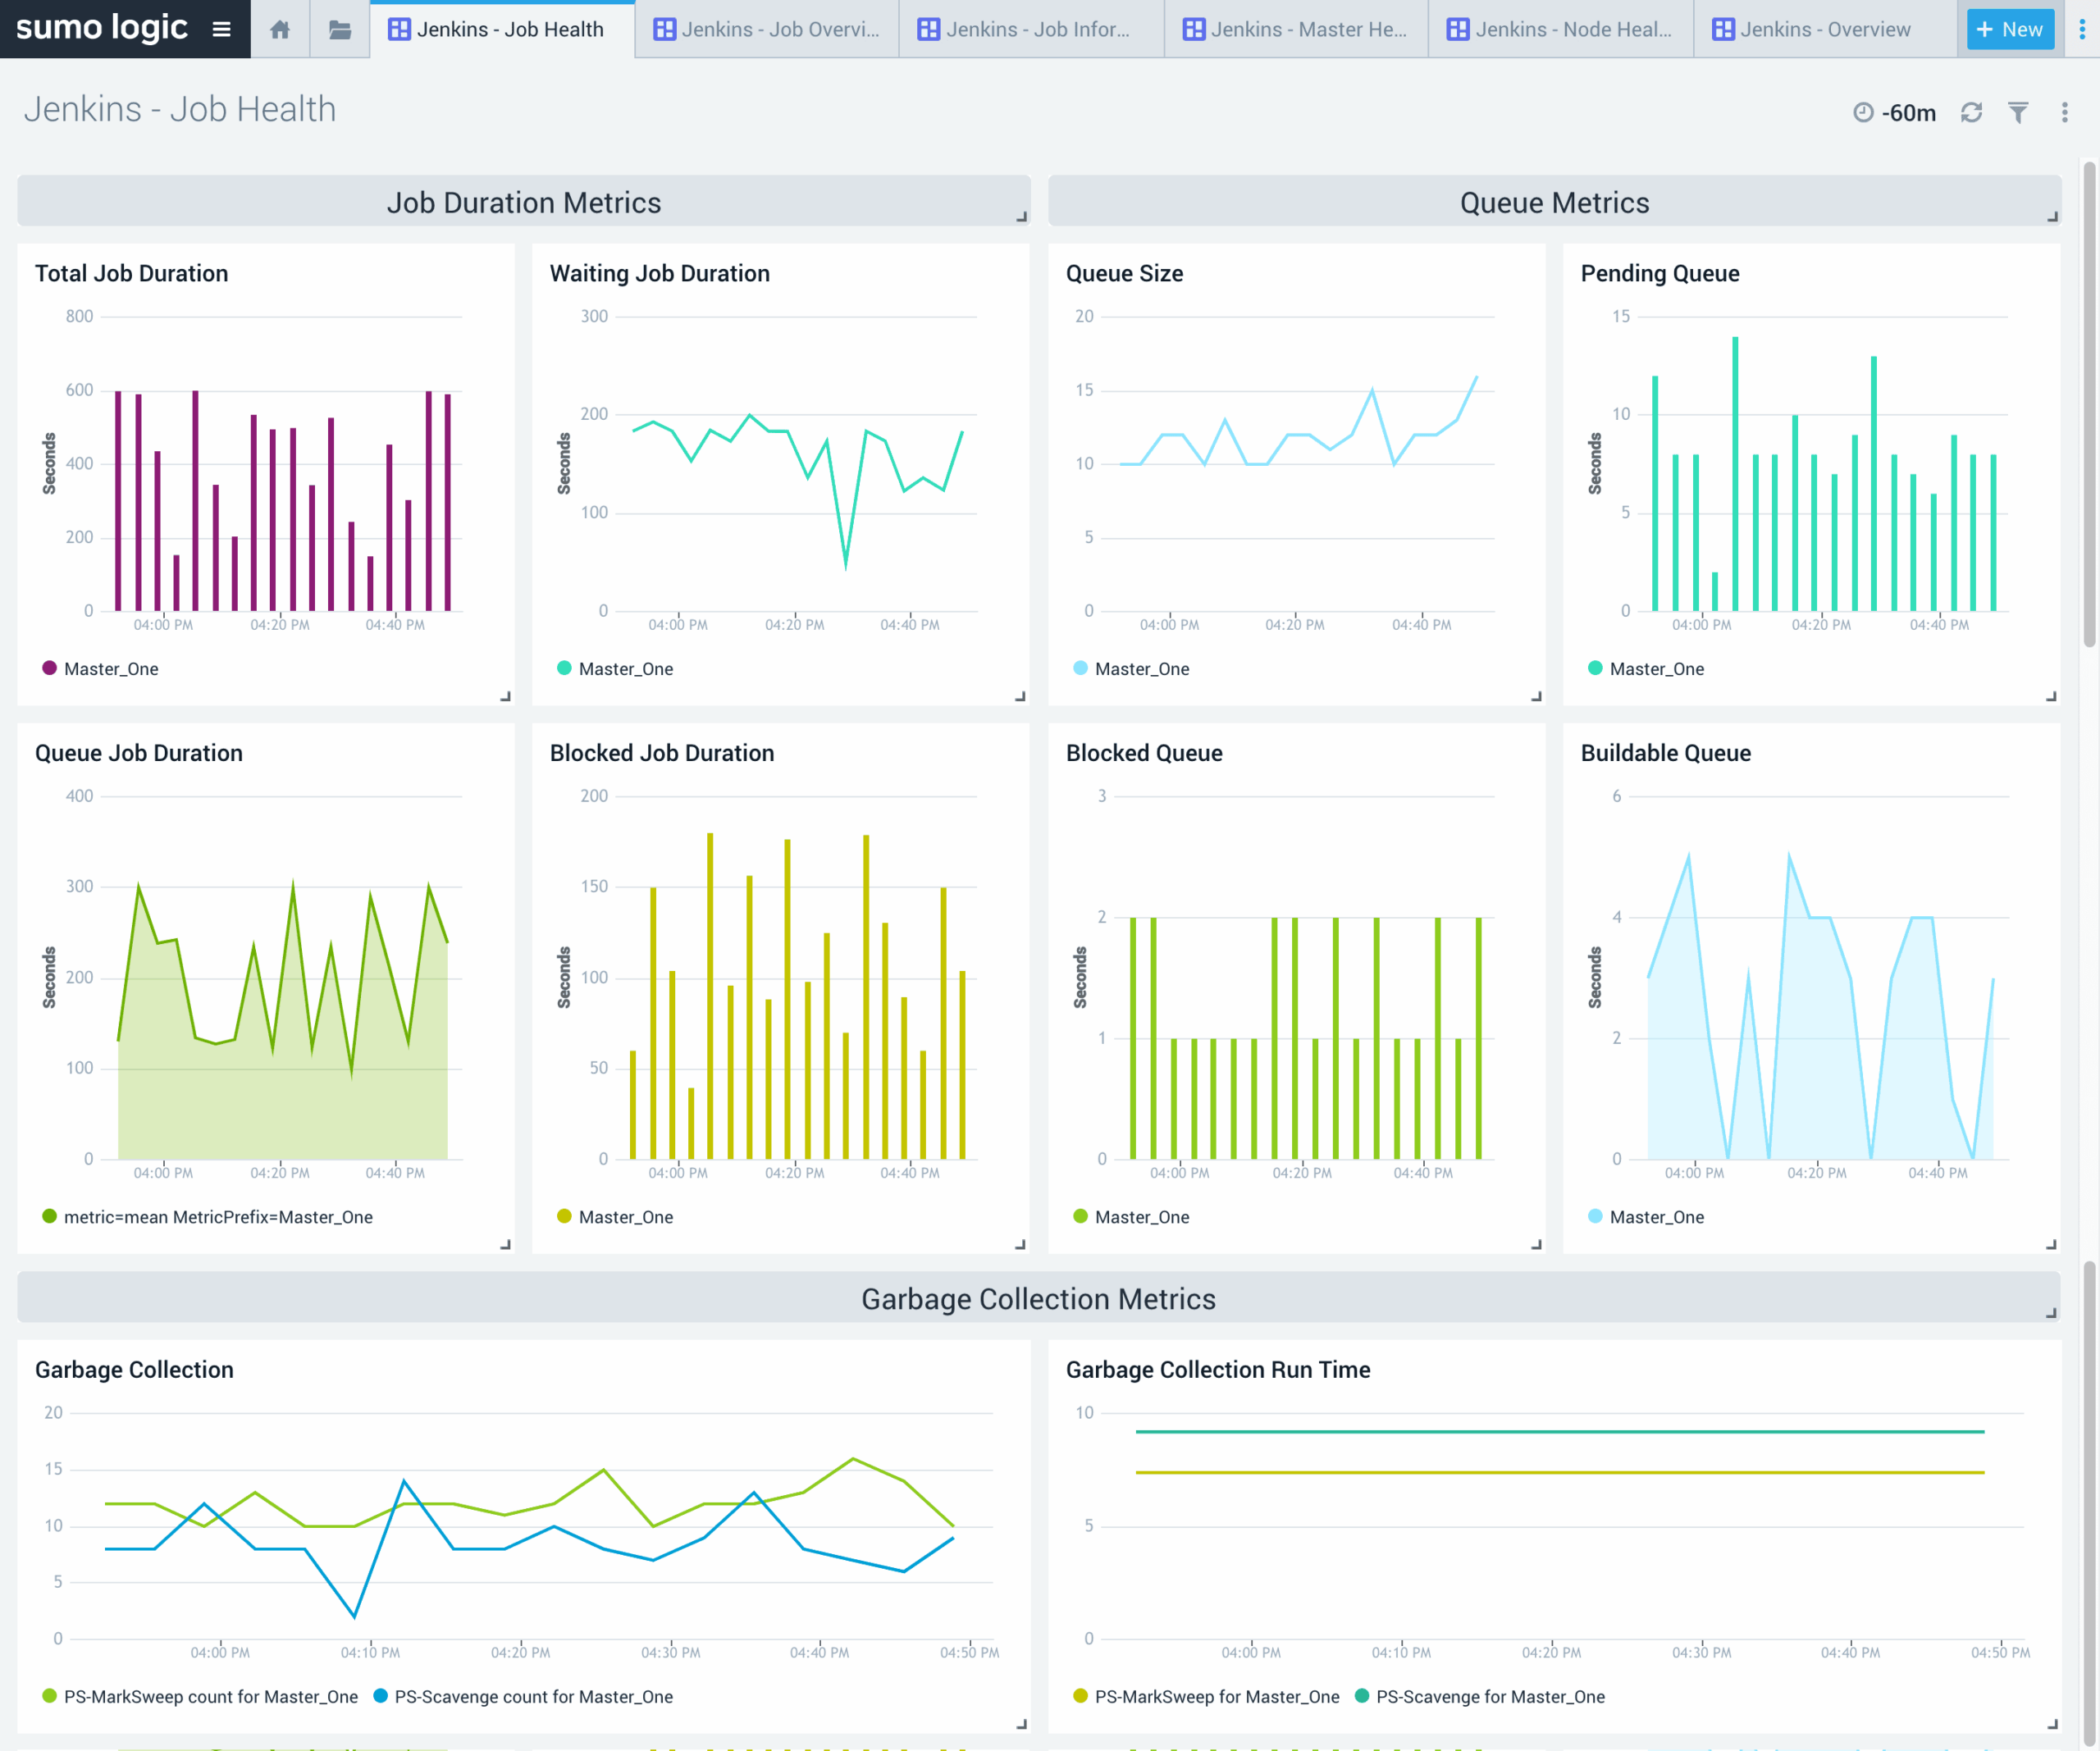

Transparency and visibility into Jenkins Jobs
Job monitoring dashboards provide information on job activities like job run duration, job status, test results, pipeline stages and console Logs. Job monitoring dashboards help you monitor job duration, status, failed jobs and test cases. You can determine stack trace failures, failed stages details, source control management details, job configuration changes, and stage wise console logs
Maintain speed and security
The Jenkins audit dashboard tracks information related to configuration changes, the users that made them and other job activities to help meet compliance and regulatory requirements. Create scheduled searches to alert on suspicious activity and send them to Sumo Cloud SIEM Enterprise as signals for real-time analysis.
