Comprehensive visibility into the operations, performance and health of MongoDB Atlas clusters
Performance of Atlas clusters
Identify slow and inefficient queries and monitor key database and system metrics
Security of Atlas clusters
Monitor user logins, audit events and project and organizational activity to improve security posture. Get a comprehensive view of Atlas security and audit aspects via the Atlas audit logs, alerts, and events logs.
Operational health of Atlas clusters
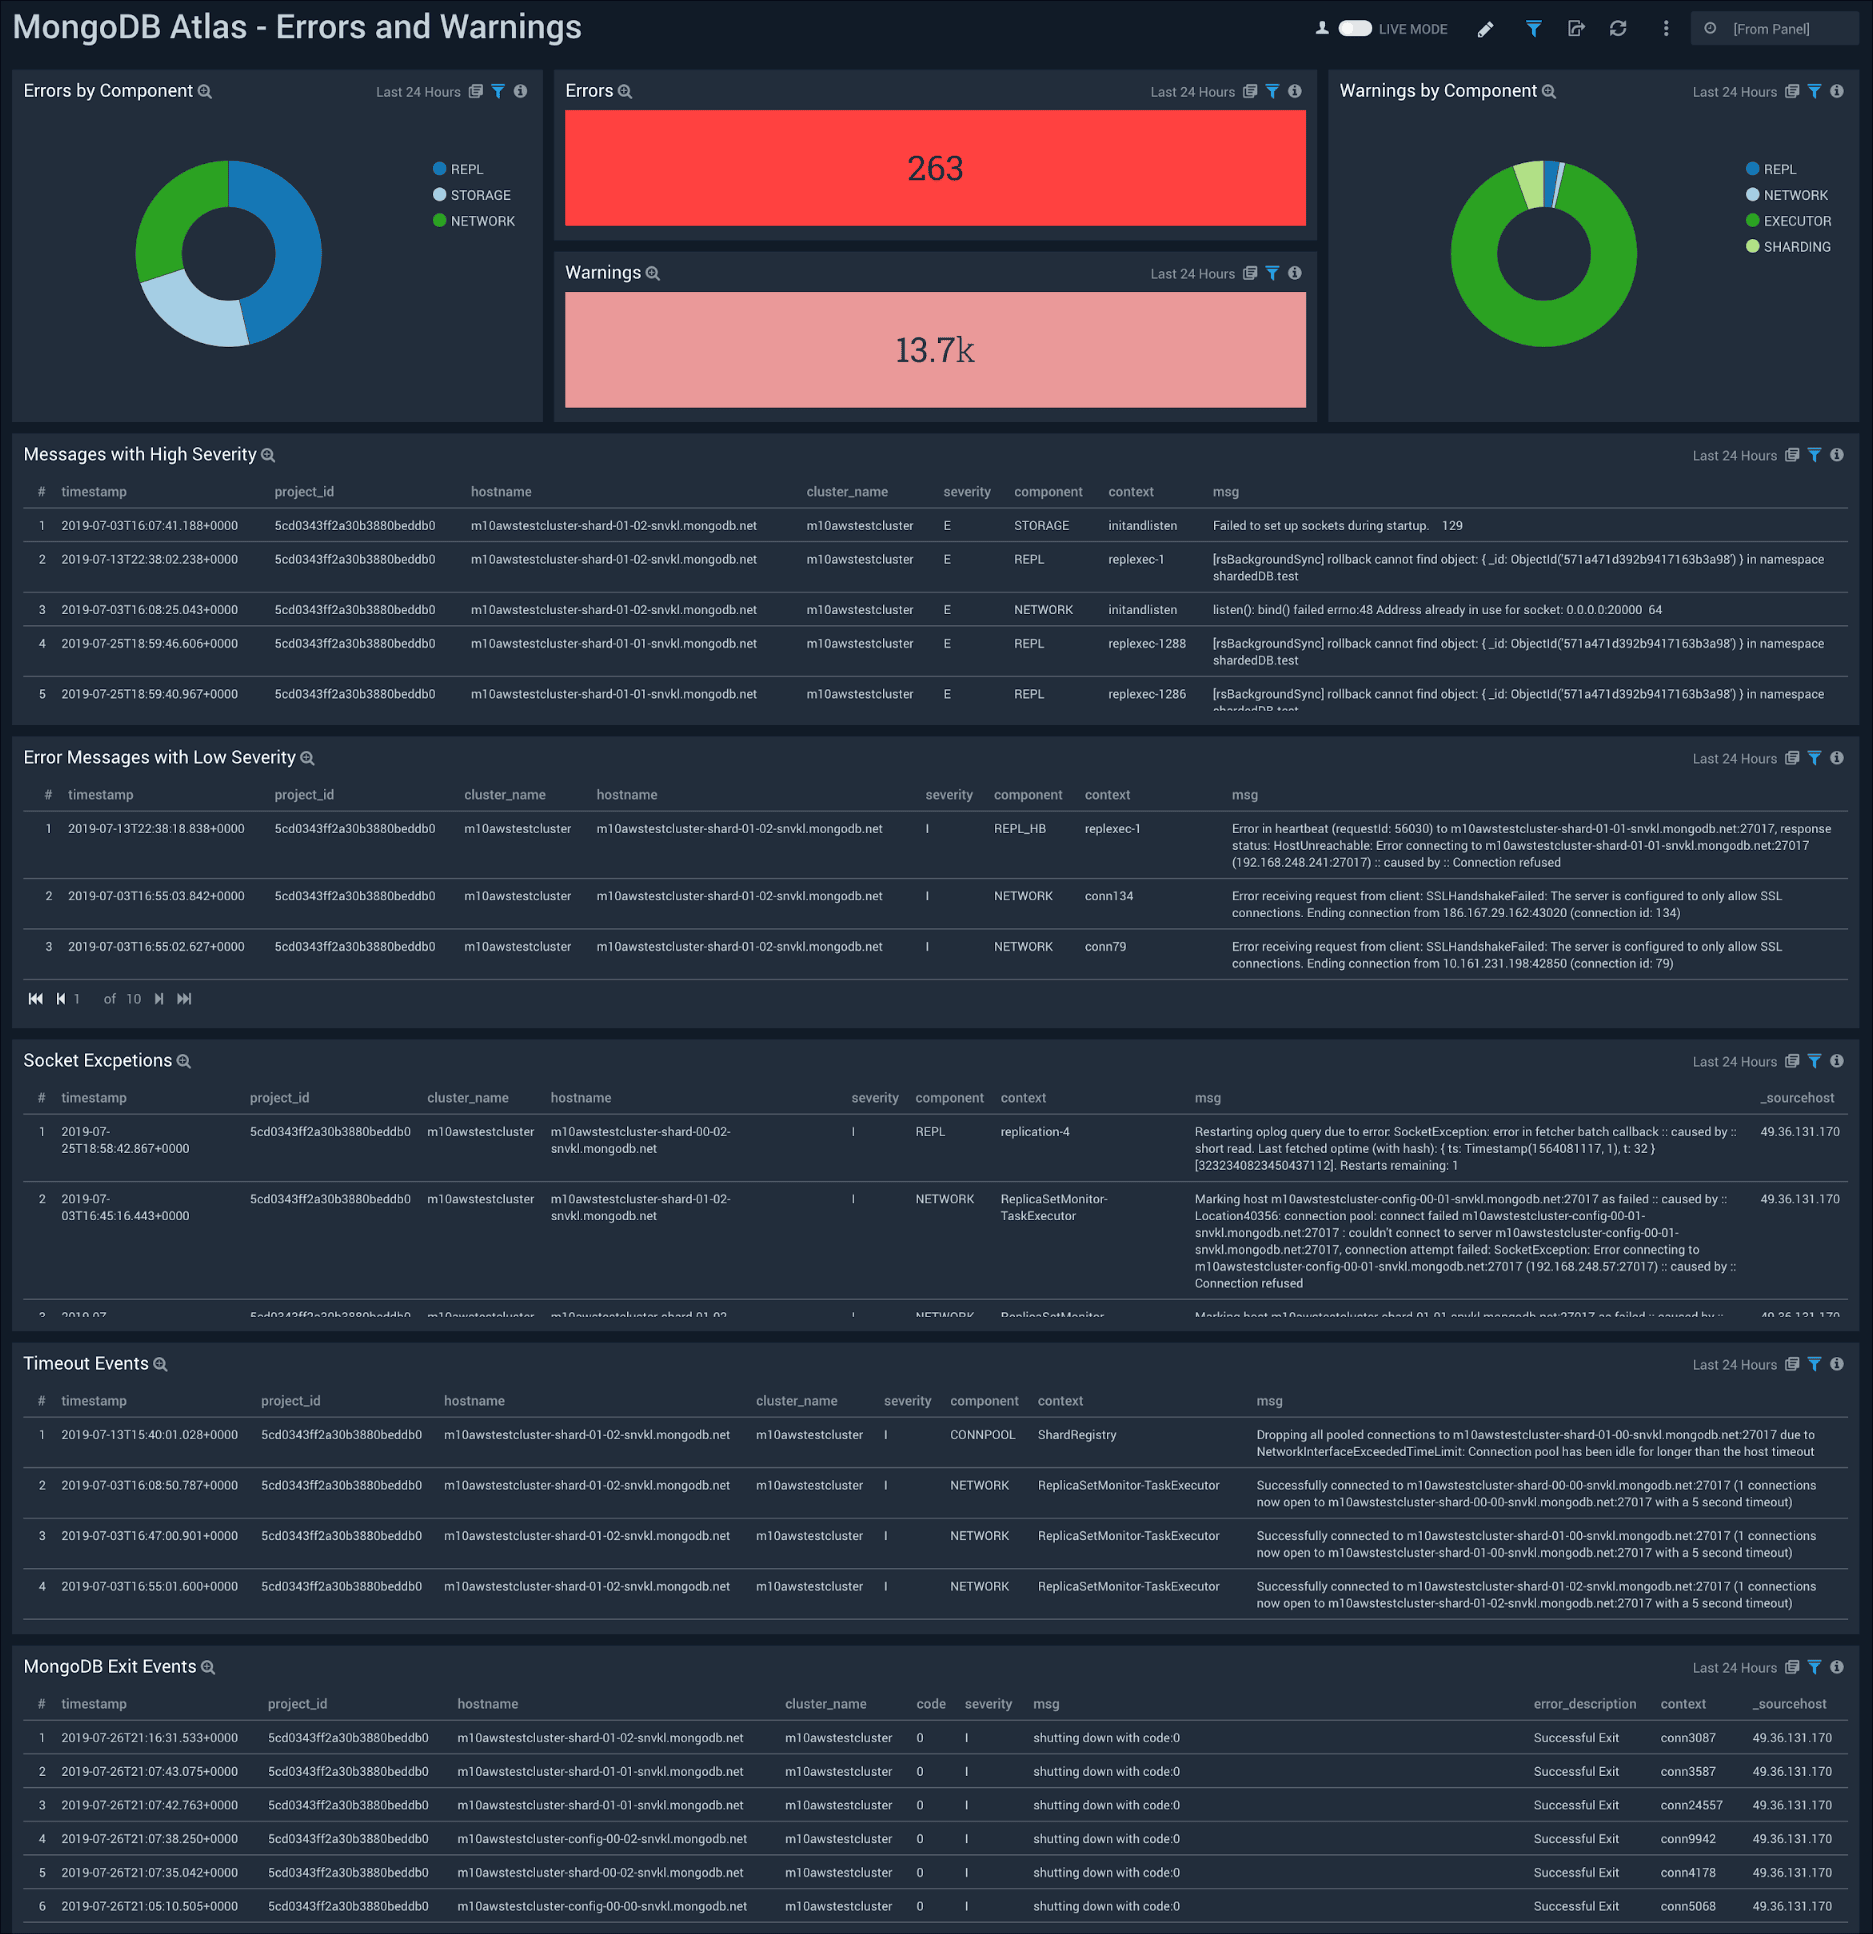
Monitor database operations, such as indexing, sharding, and replication. View detailed error logs for troubleshooting and track login activities in your database including failed attempts.

Query analytics
The MongoDB Atlas – Slow Queries dashboard provides details on the number of slow queries by type,trends, and slow server status. The dashboard identifies changes in the number and types of slow queries, connections collections experiencing slow queries and queries using scanned and returned objects.
Security Intelligence
Get insight into security events in your Atlas environment such as failed authentication, authorization and audit events, audit event trends, and originating geographic locations. Panels also display details on audit events by action type and user, and recent audit events by created and deleted resources.


Monitor database health
Get information on errors, warnings by component, severity and type. The dashboards also show information around daily error and warning summaries, socket exceptions, timeout events, and MongoDB exit events.

