If you manage workloads across multiple clouds, you know how easy it is for critical alerts or performance issues to get lost in the noise. Switching between consoles, correlating logs, and tracking metrics across platforms can slow down troubleshooting, delaying incident resolution and increasing risk of missing critical alerts.
Sumo Logic prevents this by bringing everything together in one place, giving you real-time visibility, faster troubleshooting, and better security, so you can spend less time firefighting and more time improving your systems. And now, we’re making it even easier to monitor and secure your Microsoft Azure environments with several new updates.
21 upgraded Azure apps
Sumo Logic apps are key to getting up and running fast. They provide sample searches, pre-built queries, and customizable dashboards and monitors for common use cases. As part of our Azure improvements, we’ve upgraded 21 apps to provide:
- Support for metrics and logs: All apps now support both Azure Metrics and Logs, providing more comprehensive monitoring across your environment.
- Improved correlation: Normalized log and metric fields create a common schema, enabling faster correlation, streamlined querying, and deeper insights for troubleshooting and monitoring.
- Out-of-the-box monitors: Pre-built monitors aligned with Azure best practices help you get started quickly.
- More efficient searches: An index field for log-based searches reduces partition scans, lowers credit consumption, and boosts performance. Check out this guide for details on configuring partitions and indexes for your log sources.
Three new Azure apps
We’ve also introduced three brand new apps to help you monitor and troubleshoot your Azure environments:
- Azure OpenAI: Collect resource logs and platform metrics from Azure OpenAI and integrate them into Sumo Logic for centralized monitoring, analysis, and alerting. This app provides visibility into request volume, token usage, response latency, and errors to help you optimize model utilization, ensure reliable AI performance, and troubleshoot issues quickly and efficiently.
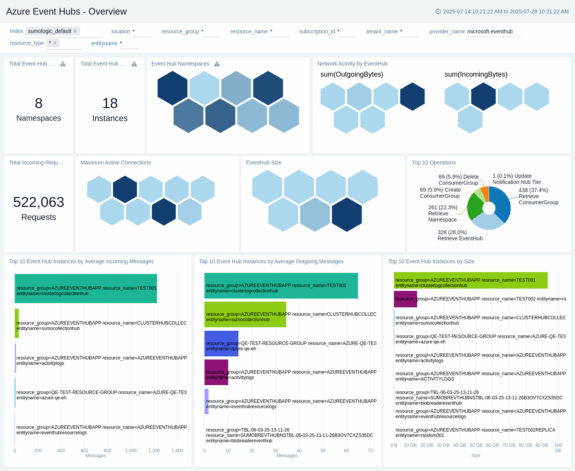
- Azure Event Hubs: Track data plane operations, such as sending/receiving events, and monitor performance metrics including consumer lag, throughput, and active connections.
- Azure Machine Learning: Monitor compute resources (CPU/GPU), training runs, model deployments, pipeline events, and policy recommendations. Gain visibility into resource utilization and data plane operations to troubleshoot and optimize your ML workloads.
New Azure metrics source
We’ve introduced a new Azure Metrics Source that leverages Azure’s native API to automate data collection. No more manual management of ARM templates, serverless functions, or addressing CVEs and bug fixes.
With automatic updates, your team can spend less time maintaining your data collection and focus on important value-add activities. Onboarding new metrics is now faster and easier, and richer metadata means deeper insights into your Azure environments.
Whether you’re a multi-cloud organization or primarily an Azure shop, these updates make it easier than ever to centralize monitoring, improve security, and gain actionable insights.
Ready to see it in action? Request a demo or sign up for a free trial—no credit card required.

