What is distributed tracing?
Distributed tracing is an observability practice used to track a single request as it travels across multiple services in a distributed system. In modern cloud environments powered by microservices architecture, containers, and APIs, a single user action may trigger dozens of service calls. Distributed tracing provides visibility into how those services interact, where latency occurs, and where performance bottlenecks emerge.
By generating and analyzing trace data, distributed tracing allows teams to monitor application performance, troubleshoot errors, and improve overall system reliability.
Key takeaways
- Distributed tracing follows a request across multiple services in a distributed system using trace IDs and spans.
- Distributed tracing allows businesses to quickly and seamlessly identify problems related to their microservices environments.
- Logging and distributed tracing is often only integrated when microservices are involved.
- Sumo logic’s transaction tracing provides cloud-native transactional intelligence for distributed business workflows by enriching and analyzing traces, logs, and metrics in real time.
How has distributed tracing changed over time
Before the advent of complex service-oriented architecture, it was pretty easy to see what went on within monolithic applications. With today’s cloud-based environments and complex architectures, it is far more difficult to identify transactions through an application’s various layers and tiers. Defining the source of latencies, delays, and other application-related issues can be especially tricky.
Companies want and need more visibility into their applications and their environments. Distributed tracing allows businesses to quickly and seamlessly identify problems related to their microservices environments.
Pros and cons of distributed tracing
Let’s look at some of the benefits and drawbacks of distributed tracing and some relevant alternatives in observation and monitoring.
Benefits of distributed tracing:
- Helps teams understand application performance issues quicker
- Teams can effectively identify the causes of issues and resolve them
- Monitoring and observability allow teams to predict when microservices are susceptible to bottlenecks and other problems within your infrastructure
- Improves the user experience and helps companies abide by defined SLA compliances
- It helps teams collectively understand issues, which improves communication and collaboration
- Increase competitive edge for companies by allowing them to get new products and services to market much more quickly
Some common issues:
- Requires you to generate trace data, which can be difficult early on
- Different software might not be structured to accept the instrumentation code that is a prerequisite for emitting tracing data
- Distributed tracing activities are often obsolete on arrival because of challenges surrounding an existing codebase.
- It is often difficult to parse through hundreds or thousands of services and decide which data is stored for analysis and which data to let go, as well as for how long you should store data
- Once data is retrieved, it is difficult to efficiently translate raw data into concrete insights and actionable strategies
Logging vs. distributed tracing
While you can use tracing and logging together, it’s important to know the differences and when it might be time to add distributed tracing to your monitoring process.
Logging is a method for tracking error reports and related data using logs generated by an app. Logging focuses on what happens within the application, and administrators can use logging to ensure that their applications run smoothly. They can do this by collecting and storing data logs, tracking events, and utilizing that data to audit various processes within your network or application.
Distributed tracing practices, on the other hand, follow a single transaction throughout its endpoint journey. Distributed tracing relies on the flow context of data within an application and can reduce the time it takes to detect and resolve any issues. Logging and distributed tracing can work in unison, and distributed tracing is often only integrated when microservices are involved.
The impact of distributed tracing
Distributed tracing offers real-time insights into your application and system’s health and is a reliable source for tracking a request through the many components throughout separate systems. Distributed tracing will allow your IT, SRE teams, and DevOps teams to:
- Accurately report on the status and health of microservices and applications to prevent failures
- Alert you before errors or failures occur from automated scaling
- Provide analytical reporting on end-user interactions, allowing you to stay on top of things like response times, user experience, errors, and other metrics relevant to DCX
- Identify and alienate bottlenecks, resolve code-related problems, and help in the debugging process
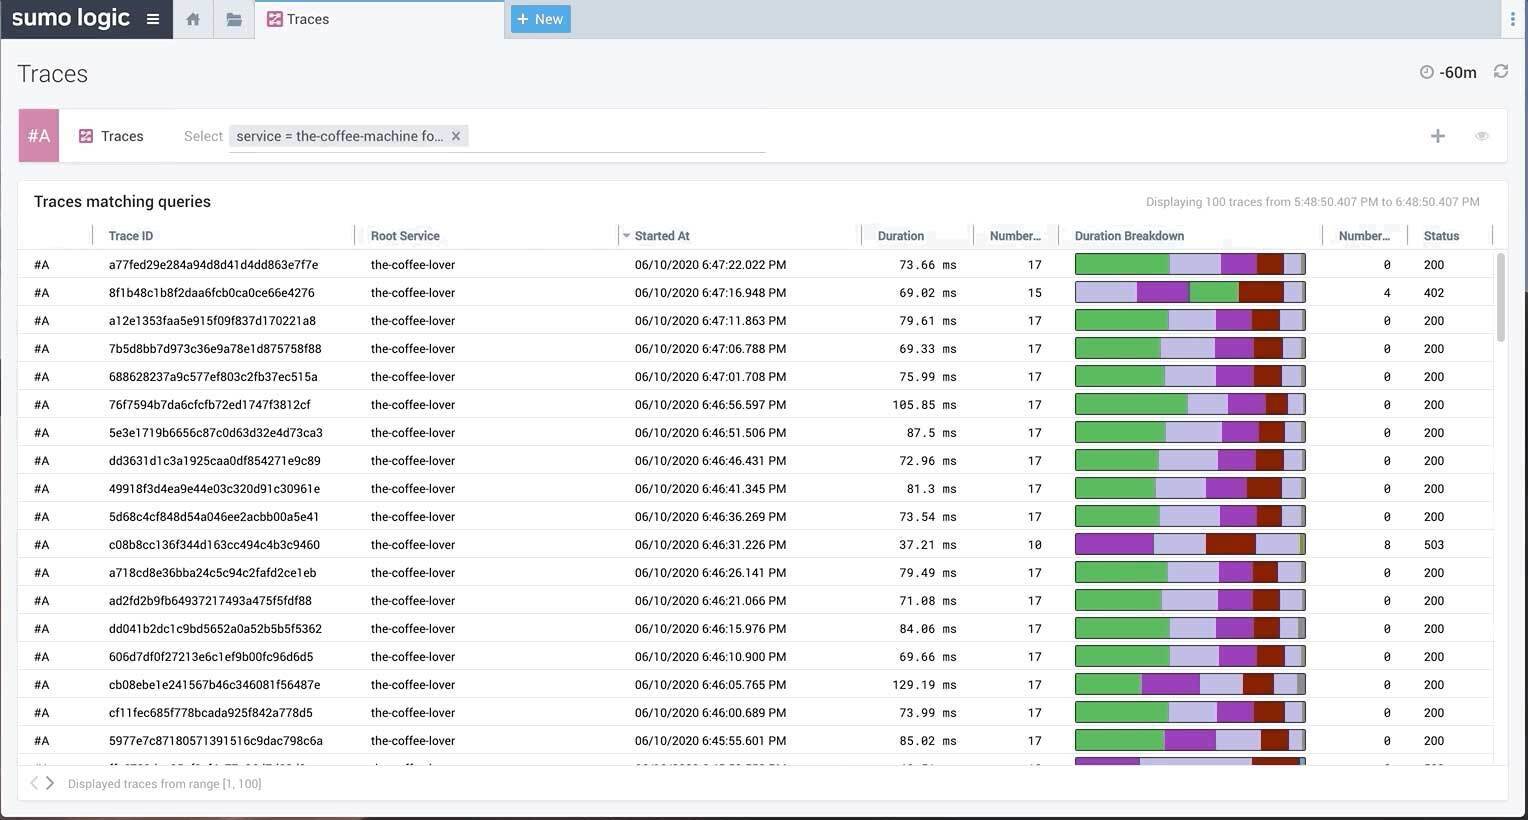
 Search for traces of transactions with Sumo Logic
How Sumo Logic can help
Sumo logic’s transaction tracing provides cloud-native continuous intelligence for distributed business workflows by enriching and analyzing traces, logs, and metrics in real time. Sumo Logic provides a seamless end-to-end experience managing and responding to production incidents and reducing downtime by streamlining root cause analysis.
Click here to learn more about how Sumo Logic can help you monitor your systems and resolve issues efficiently today.