Analyze Akamai cloud monitor data and set up alerts for security threats
Improve security posture
Analyze detailed logs from Akamai Cloud Monitor to alert on security threats and proactively defend apps and websites.
Analyze and correlate data
Correlate Akamai data with origin data to improve application availability, performance, and security.
Measure CDN impact
Measure the business impact of your content delivery network with centralized, actionable log data.
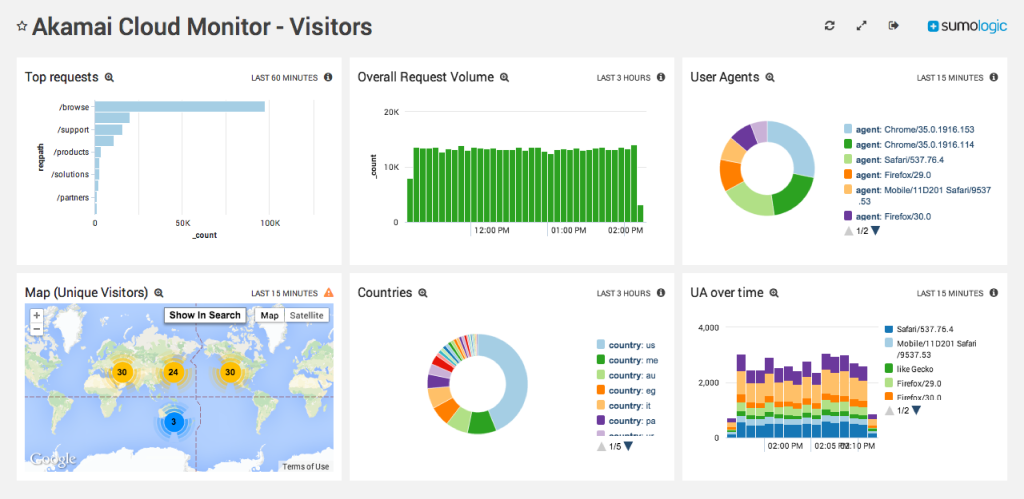
Analyze Akamai Log Data With One Unified View
With a Content Delivery Network (CDN) like Akamai, enterprises can gain a global infrastructure footprint and locate apps and websites near their end users. Akamai serves a significant amount of traffic on behalf of their customers, which makes Akamai logs critical to the performance and security of modern apps and websites.
The Sumo Logic App for Akamai gives customers the power to analyze and correlate Akamai data with origin data. With these data sets, you can increase the availability and performance of applications, improve the end-user experience, gain deeper user insights, proactively monitor applications, and resolve security incidents.
Download our Akamai data sheet to learn more about the challenges of Akamai logs (and how Sumo Logic can help you overcome them).
Pull Data From Origin Data Centers and Akamai
Akamai Cloud Monitor provides access to important data about application performance and security events. To date, applications that leverage Akamai have generated two machine data sets:
- Application logs at the origin data centers. Application owners can usually access these logs.
- Logs generated by Akamai as an application is distributed globally. Application owners typically have zero or limited access to these logs.
With the Sumo Logic App for Akamai, application owners can make use of all their data. The Sumo Logic app extracts insights from Akamai and Akamai Cloud Monitor in real-time, giving you a unified view of application availability, performance, security, and business analytics.
Deliver Real-Time User and Security Insights
With the Sumo Logic Application for Akamai, you can:
- Deliver real-time analytics about user behavior. Correlate and combine internal data sets with Akamai monitoring data to uncover granular insights into user behavior. The Sumo Logic app helps you understand how users behave across devices, geographies, and more.
- Conduct root cause analysis on security events. With the Sumo Logic app, you can perform advanced troubleshooting to deep-dive into sessions, IP addresses, and individual URLs that attackers are attempting to exploit and breach.
- Monitor and alert on security threats. Monitor and alert on security threats at the web application firewall (WAF) layer, correlate WAF events with internal security systems, and proactively defend applications.
Try Sumo Logic free for 30 days!
Simplify Application Performance Management and New Releases
The Sumo Logic App for Akamai streamlines application management at every stage of the development lifecycle.
Before and during a release, use your Akamai data to manage application releases and anticipate risky releases. Application owners and development teams can receive alerts when one or more origins have an elevated number of 4xx or 5xx errors. Pull the logs in question to see if the errors are caused by a new code push, configuration change, or another issue within the origin application infrastructure.
After the release, Akamai and Sumo Logic help you simplify application performance management. With integrated data sets, you can quickly determine if a performance issue is caused by your origin or by Akamai’s infrastructure, and you can dive deeper to see which regions, user agents, or devices are impacted.
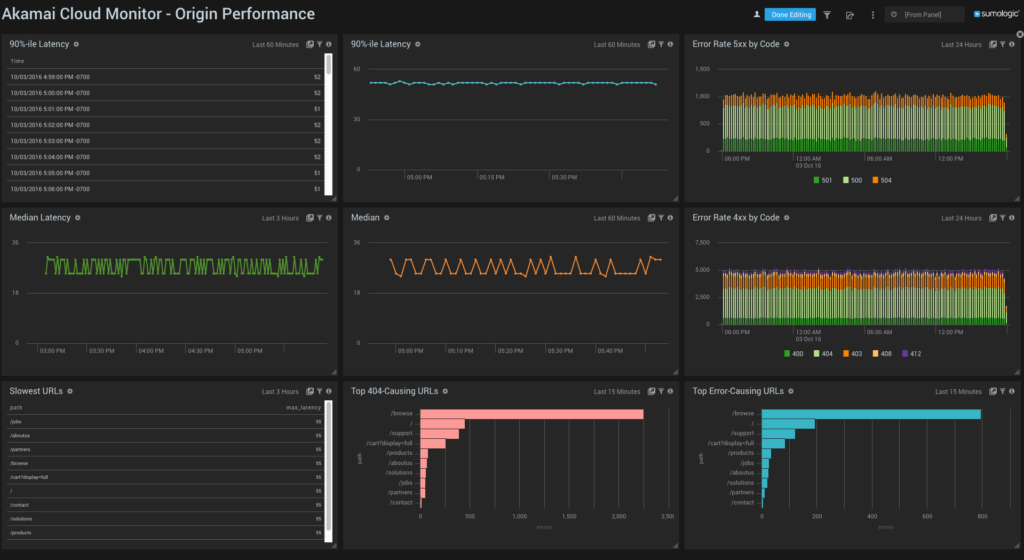
Get Started In Minutes With Predefined Akamai Dashboards
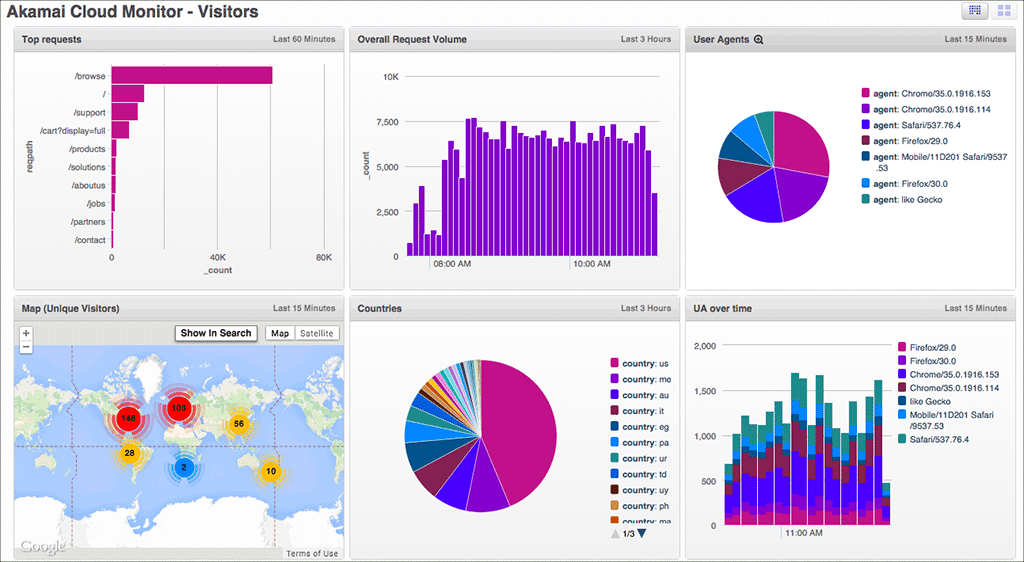
The powerful machine data analytics provided by Sumo Logic are built into several predefined dashboards and visualizations that help you understand your Akamai environment. Prebuilt dashboards (and top metrics for each dashboard) include:
- Overview: Map of unique visitors, download performance hotspots, countries, top 404-causing URLs, and top error-causing URLs.Origin.
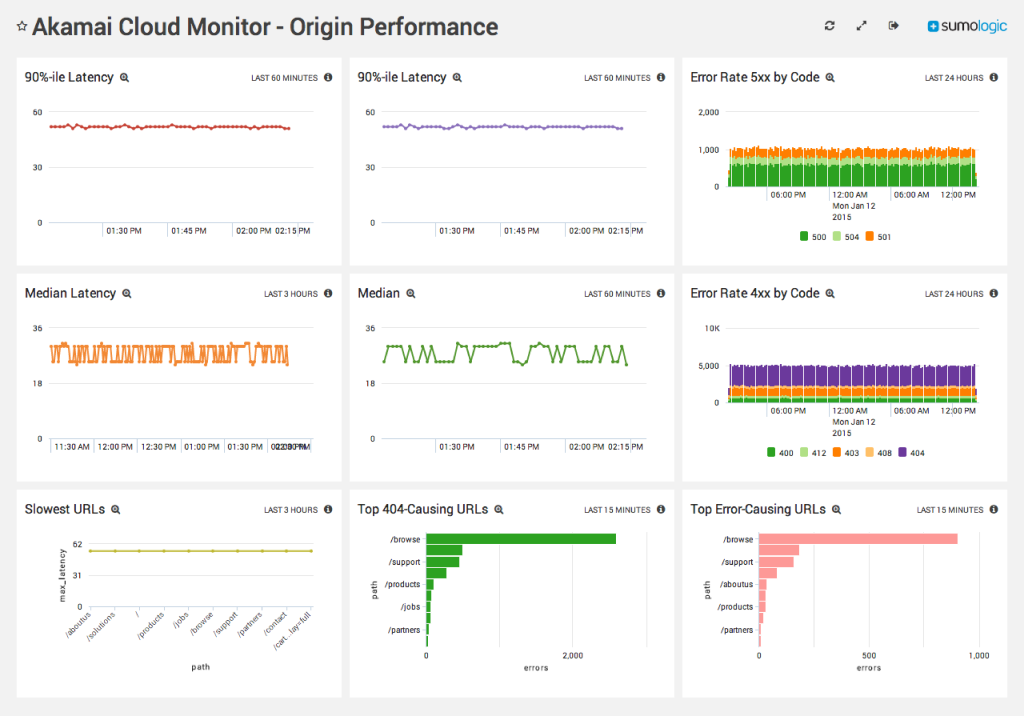
- Performance: 90%-ile percentile latency, median latency, slowest URLs, error rate 5xx by code, and error rate 4xx by code.
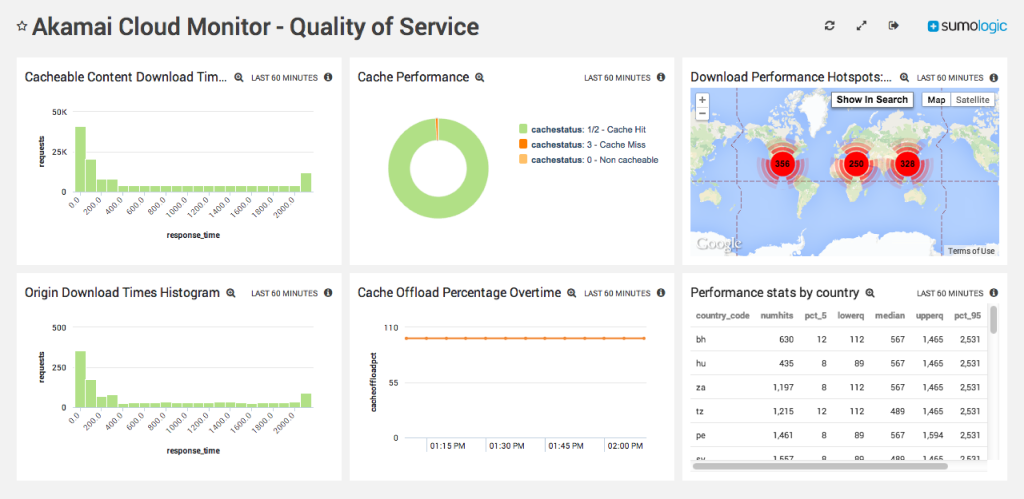
- Quality of Service: Cached content download times, histogram of origin download times, cache performance, cache offload percentage overtime, download performance hotspots, and performance stats by country.
- Security: WAF-warn requests per host, top warn rules, top warn URLs, denials by host, top deny rules, and top deny URLs.
- Visitors: Top requests, map of unique visitors, overall request volume, countries, user agents, and user agents over time.
- Web Application Firewall (WAF) Attacks: Attacks (individual warn/deny events)
Try the full Sumo Logic for free for 30 days!
Seamless Integration with Akamai
Sumo Logic founding VP of Product and Strategy Bruno Kurtic talks about Sumo Logic’s integration with Akamai Cloud monitoring.

