
Guest Blog Post by Ethan Culler-Mayeno, TechOps Engineer at LogicMonitor
On the LogicMonitor Technical Operations team, we love our logs. We know that logs are more than just “those files you need to delete to clear a disk space alert.” Logs provide patterns of normal behavior, and therefore make it easier to identify anomalies or changes in these patterns. Here at LogicMonitor, while our own product is the primary method used for monitoring performance and identifying issues, we also use logs as a tool to investigate (or better yet, prevent) issues.
Recently, one of our servers managed to find its way into an email loop with an auto-responder. Unfortunately, in this game of digital chicken, it was our machine which reached its port 25 saturation point first. This email loop resulted in degraded performance for other applications running on that machine. Now you may be saying something like “Bummer, but just put in a rule to discard mail from the auto-responder and Bob’s your Uncle.” While that is certainly the correct way to address this issue, let’s take a step back – how would you identify the issue? In most troubleshooting scenarios, fixing the issue is easy. It’s finding the issue that is the hard (and often time consuming) part. How would you know that your machine was getting blown up by an email responder if you got an alert for HTTPS performance issues for a web application on that machine?
Well now I am sure you’re guessing something along the lines of “the logs have the answer!” But mailserver logs are not usually the first place you look when investigating a web service performance issue…. So lets take a look at how we were able to use LogicMonitor to identify this issue.
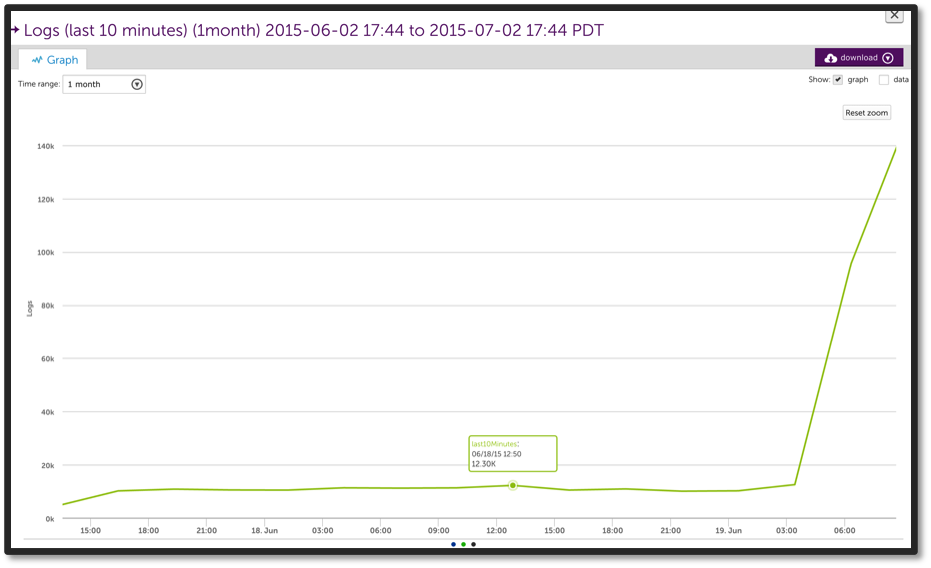
Our team uses SumoLogic as a log analysis tool. SumoLogic provides an excellent API for programmatically performing queries against logs, which allows our team to monitor and alert on subsets of our logs. We alert on specific events and exceptions, but we also use a groovy-based LogicModule (created by our engineers) that uses SumoLogic’s API to monitor the rate of log messages being written per device. Below is a graph for that datasource that shows the total number of log entries written for the server that was hit by the aforementioned mail loop.
Because we were trending the number of log messages, as soon as we started looking at the performance of that server in LogicMonitor, it was very clear that we needed to investigate the logged messages in SumoLogic for details of the issue – which immediately led us to the mail loop, and a quick resolution.
Monitoring your logs at a high level can fill in the pieces that content based log monitoring might miss. In many cases logs do not contain content that would cause a watcher (or monitoring solution) to bat an eye. However, when a device is logging 30x as many messages per minute as normal, it’s pretty safe to say that there is something wrong.
You can download the SumoLogic LogicModule we used – SumoLogic_Logs_Per_Host – from our core repository, by selecting “Settings..Datasources…Add.. From LogicMonitor Repository” from within LogicMonitor. (Some more information about it is available on this help page.) You can also easily modify it to track, graph and alert on other data from SumoLogic.
Let us know if you have other cool ways to tie into SumoLogic, or other logging systems, too!


